Last updated: March 24, 2026
Analyze Web Events
The Web Events tab in the Query Builder provides a curated interface for browser telemetry derived from Dash0's real user monitoring instrumentation.
Use it to track request volumes, error rates, user counts, page performance, and Core Web Vitals — all from a single focused view without writing PromQL.
Dash0 automatically generates a set of built-in metrics from your telemetry. These appear alongside your own custom metrics in the Query Builder, as can be seen above. For example:
dash0.web.events— total count of all browser-side events captured (web vitals, errors, navigations, custom interactions).dash0.web.errors— count of client-side JavaScript errors and failed operations captured in the browser.dash0.web.requests— total number of outbound HTTP requests initiated from the browser (XHR, Fetch, etc.).dash0.web.requests.duration— latency of outbound browser requests in milliseconds, from initiation to response.dash0.web.users— count of unique users observed within the telemetry window, derived from browser identifiers.dash0.web.vitals.lcp— Largest Contentful Paint: time in milliseconds until the largest visible element is fully rendered; measures perceived load speed.dash0.web.vitals.inp— Interaction to Next Paint: latency from a user interaction (click, keypress) to the next visible paint; measures responsiveness.dash0.web.vitals.cls— Cumulative Layout Shift: score representing total unexpected layout movement during page load; measures visual stability.dash0.web.page_views— number of distinct page views recorded across all sessions.dash0.web.sessions— total number of user sessions.dash0.web.sessions.duration— duration of user sessions in milliseconds, from first event to last.dash0.web.bounces— count of sessions where the user left without any further interaction after the initial page load.
These metrics are also accessible directly in the Metrics and PromQL tabs, giving you the flexibility to combine them with your own metrics or apply custom aggregations.
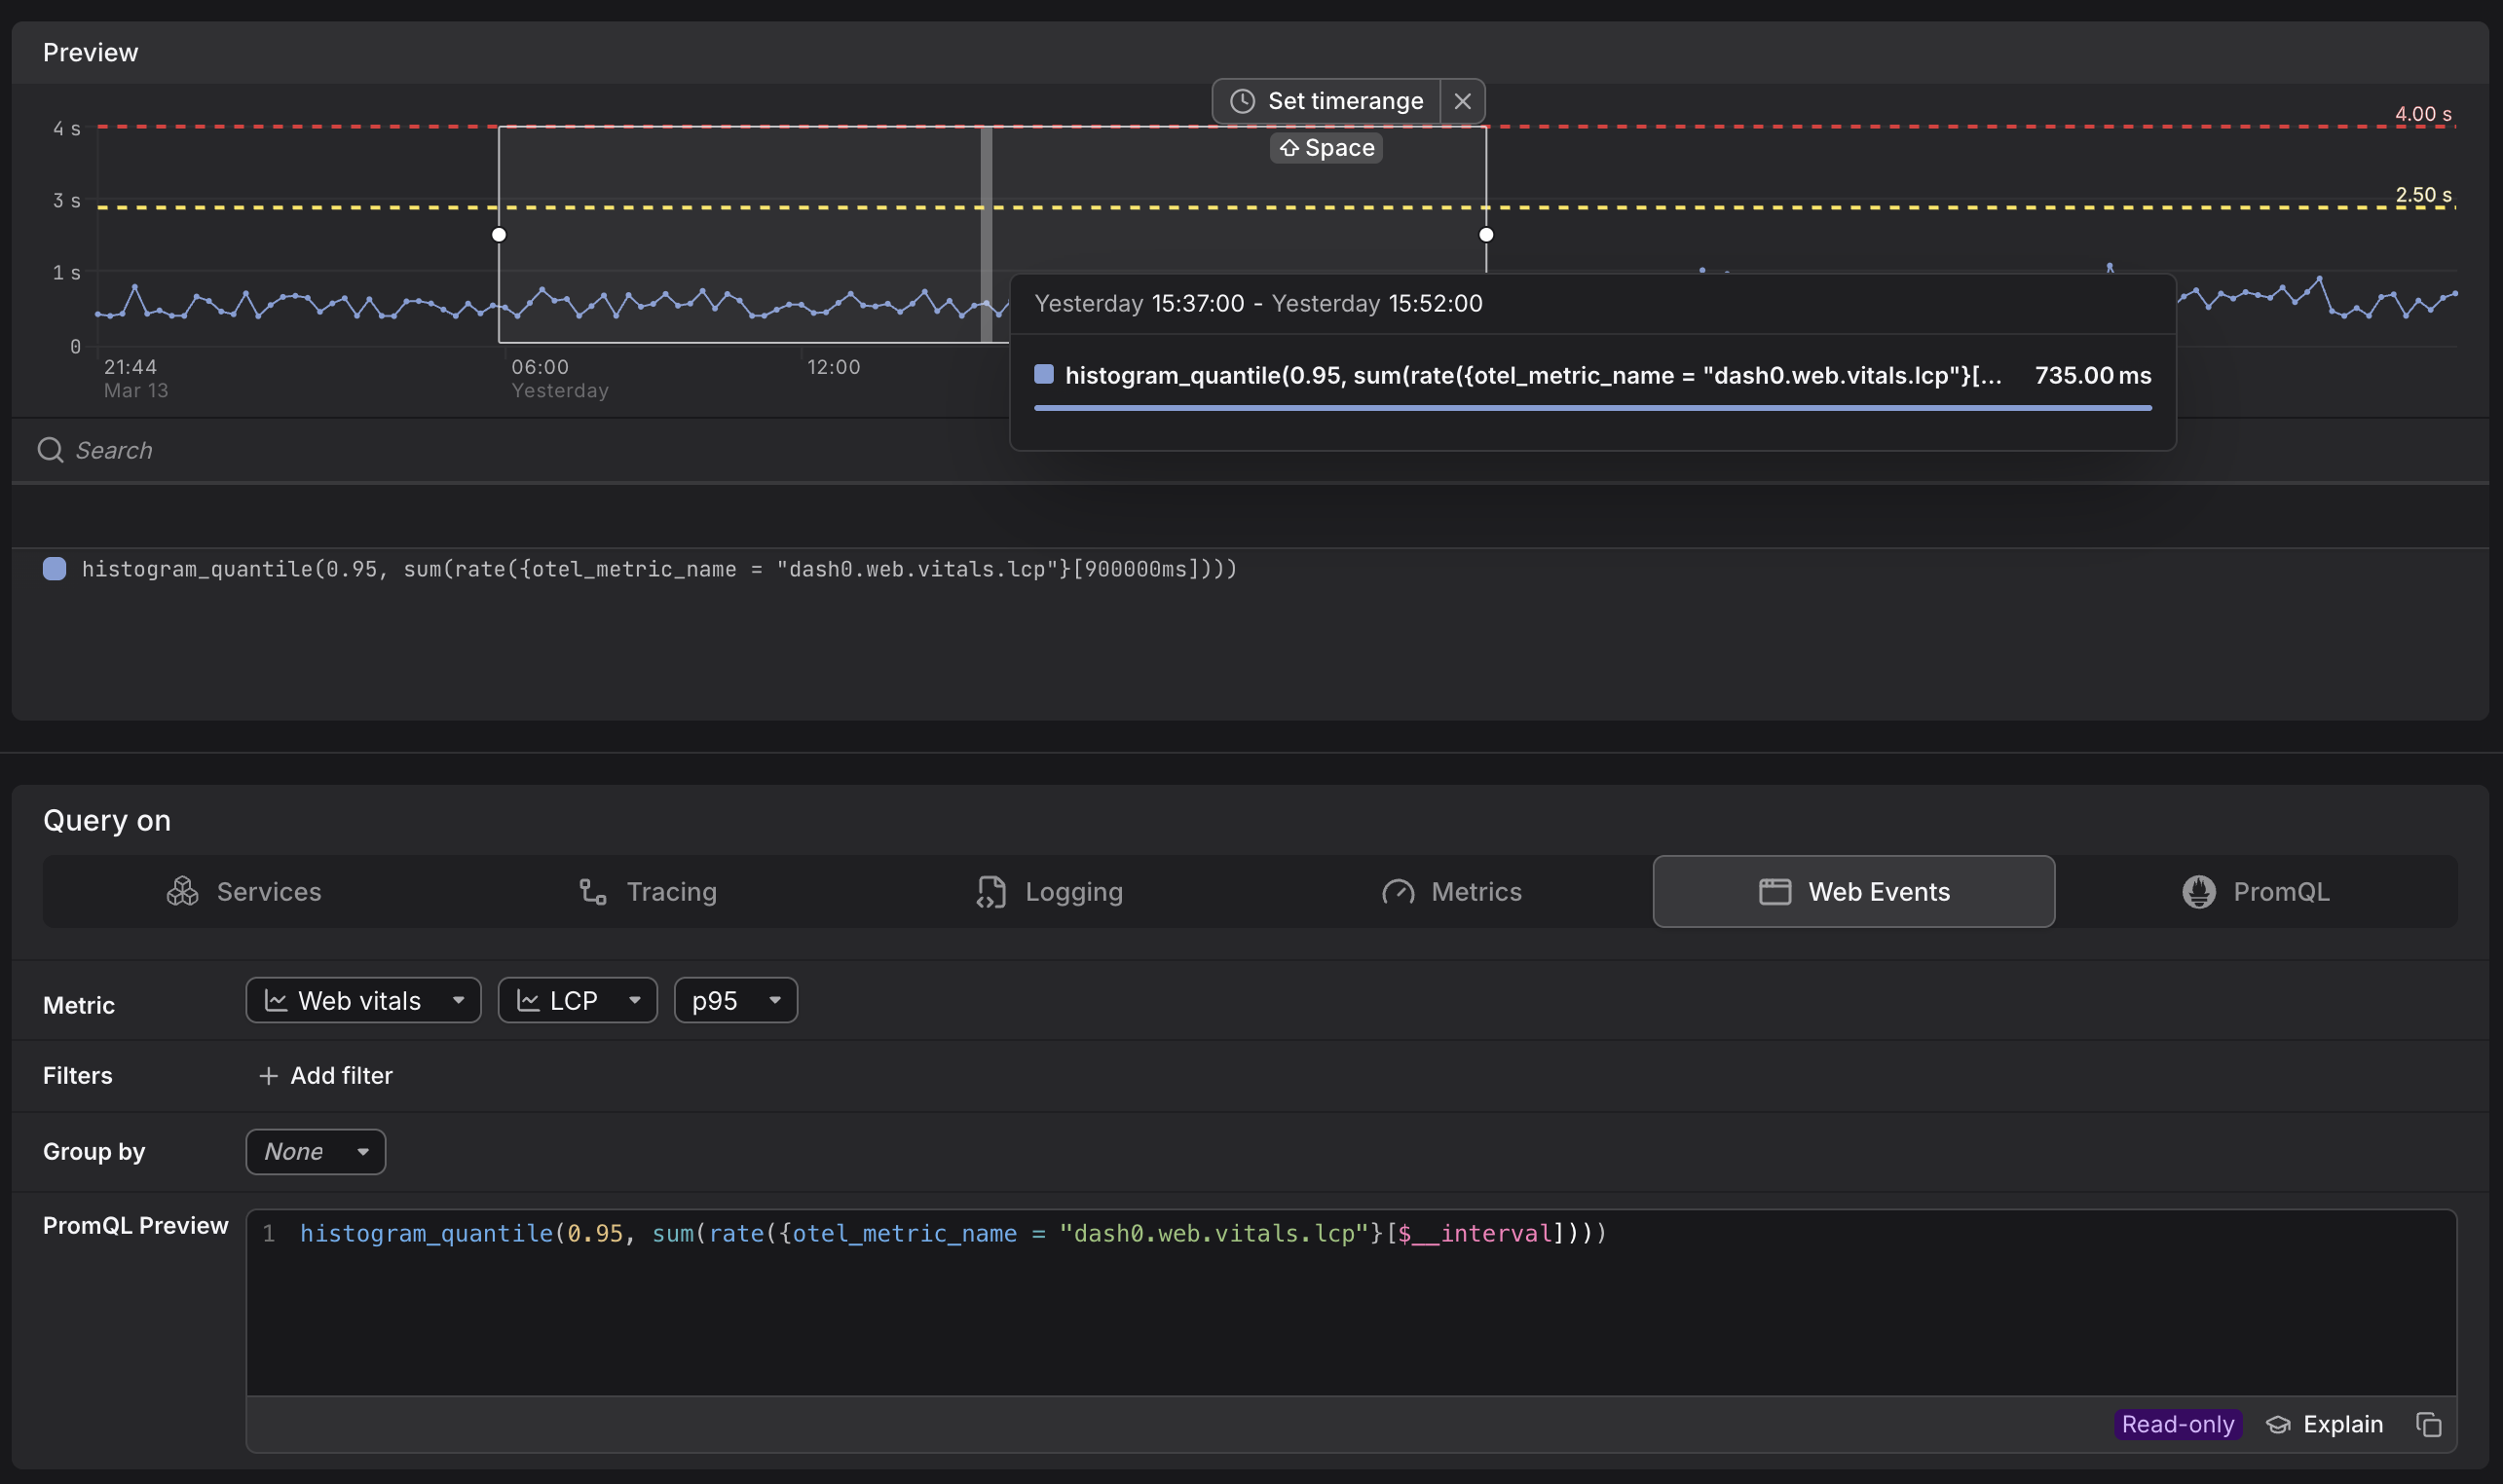
Select the Metric
Use the Metric dropdown to choose what you want to measure.
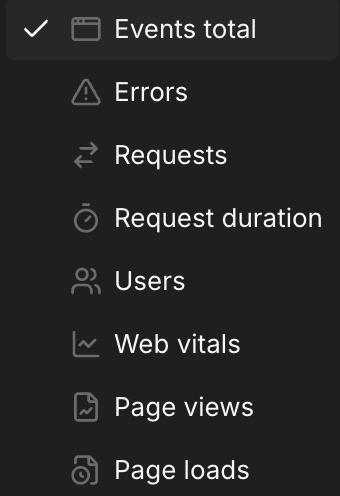
The available metrics fall into categories, each backed by a different PromQL pattern:
- Events total, Errors, Requests, Users, Page views, and Page loads are raw counters — queries use
increase()to return the total number of events accumulated over the selected interval. A> 0guard is appended to suppress empty intervals from the chart. - Request duration is a histogram metric — percentiles are computed using
histogram_quantile()andrate(). A second dropdown lets you choose the percentile: p50, p75, p90, p95, p99, or avg. - Web vitals expose Core Web Vitals (LCP, INP, CLS) as histogram metrics, also computed with
histogram_quantile()andrate(). Two additional dropdowns let you choose which vital and which percentile (p50, p75, p90, p95, p99). The default percentile is p75, which is the value Google uses when scoring pages for the Chrome User Experience Report.
The examples below show the base query for each metric with no filters or Group by applied. When you add filters or select a Group by attribute in the Query Builder, the generated PromQL will include the corresponding label matchers and by clause automatically.
| Metric | What it measures | When to use it |
|---|---|---|
| Events total | Total number of browser events recorded in the selected time window. | Use to understand overall browser activity volume and detect sudden changes in event throughput — for example, a drop that could indicate a JavaScript error preventing events from being recorded. |
Example:sum(increase({otel_metric_name="dash0.web.requests"}[$__interval])) > 0The > 0 guard suppresses intervals with no events, removing empty data points from the chart. | ||
| Errors | Total number of browser events that completed with an error status in the selected time window. | Use to track frontend error volume over time — useful for detecting regressions after a deployment or correlating error spikes with specific pages or user actions. |
Example:sum(increase({otel_metric_name="dash0.web.errors"}[$__interval])) > 0The > 0 guard suppresses intervals with no errors, keeping the chart free of flat zero lines during quiet periods. | ||
| Requests | Total number of browser-initiated HTTP requests in the selected time window. | Use to measure request volume independently of total event count — useful for understanding how much network activity your frontend is generating and whether it correlates with performance degradation. |
Example:sum(increase({otel_metric_name="dash0.web.requests"}[$__interval])) > 0 | ||
| Request duration | The duration of browser-initiated HTTP requests in seconds at the selected percentile (p50, p75, p90, p95, p99, or avg). | Use to measure frontend request latency as experienced by real users. P75 or P95 are good starting points for SLO definitions — choose a higher percentile to catch tail latency issues affecting a smaller but impactful share of requests. |
Example (p75):histogram_quantile(0.75, sum(rate({otel_metric_name="dash0.web.requests.duration"}[$__interval]))) | ||
| Users | Total number of distinct users who generated browser events in the selected time window. | Use to understand the scale of real user impact — pairing a users count with an error rate gives you a clearer picture of how many people are actually affected by a frontend issue. |
Example:sum(increase({otel_metric_name="dash0.web.users"}[$__interval])) > 0 | ||
| Web vitals | Core Web Vitals (LCP, INP, or CLS) at the selected percentile (p50, p75, p90, p95, p99). LCP measures loading performance, INP measures interactivity responsiveness, and CLS measures visual stability. Scores are updated throughout the session as the user interacts with the page, not just at initial load. | Use to monitor real-user page performance against Google's thresholds. P75 is the recommended baseline — it means 75% of your users are at or below the reported score, making it more representative than the median and more stable than the maximum. Switch to P95 or P99 to investigate tail experiences. |
Example (LCP p75):histogram_quantile(0.75, sum(rate({otel_metric_name="dash0.web.vitals.lcp"}[$__interval])))Replace lcp with inp or cls for the other vitals. Replace 0.75 with the appropriate quantile value for the selected percentile. See the Core Web Vitals tip below for a description of each vital. | ||
| Page views | Total number of page view events in the selected time window, including both full page loads and client-side navigations in single-page applications. | Use to track overall page view volume across your web application — useful as a normalisation baseline when comparing error rates or performance metrics per page view. |
Example:sum(increase({otel_metric_name="dash0.web.page_views"}[$__interval])) > 0 | ||
| Page loads | Total number of full (physical) page load events in the selected time window, excluding client-side navigations. | Use to distinguish hard page loads from soft navigations in single-page applications — a useful distinction when investigating Core Web Vitals, since LCP and CLS are only measured on physical page loads. |
Example:sum(increase({otel_metric_name="dash0.web.page_views", "dash0.web.page_view.type"="PHYSICAL_PAGE"}[$__interval])) > 0 | ||
Core Web Vitals are a set of metrics defined by Google that quantify real-user page experience. Dash0 uses the same thresholds as Google when colour-coding scores.
| Vital | What it measures |
|---|---|
| LCP — Largest Contentful Paint | How long it takes for the largest visible content element — typically a hero image or large text block — to fully render in the viewport after the page starts loading. |
| INP — Interaction to Next Paint | The latency of the worst user interaction (click, tap, or keyboard input) across the entire page lifecycle. Replaced First Input Delay (FID) as a Core Web Vital in March 2024. |
| CLS — Cumulative Layout Shift | The total amount of unexpected layout movement that occurs during the page lifecycle — for example, content jumping when images load without reserved dimensions or ads inject above existing content. |
For threshold values and guidance on improving scores, see Web Vitals on web.dev.
Add Filters
Use + Add filter to scope the query to web events that match specific attribute values. Multiple filters are combined with AND logic.
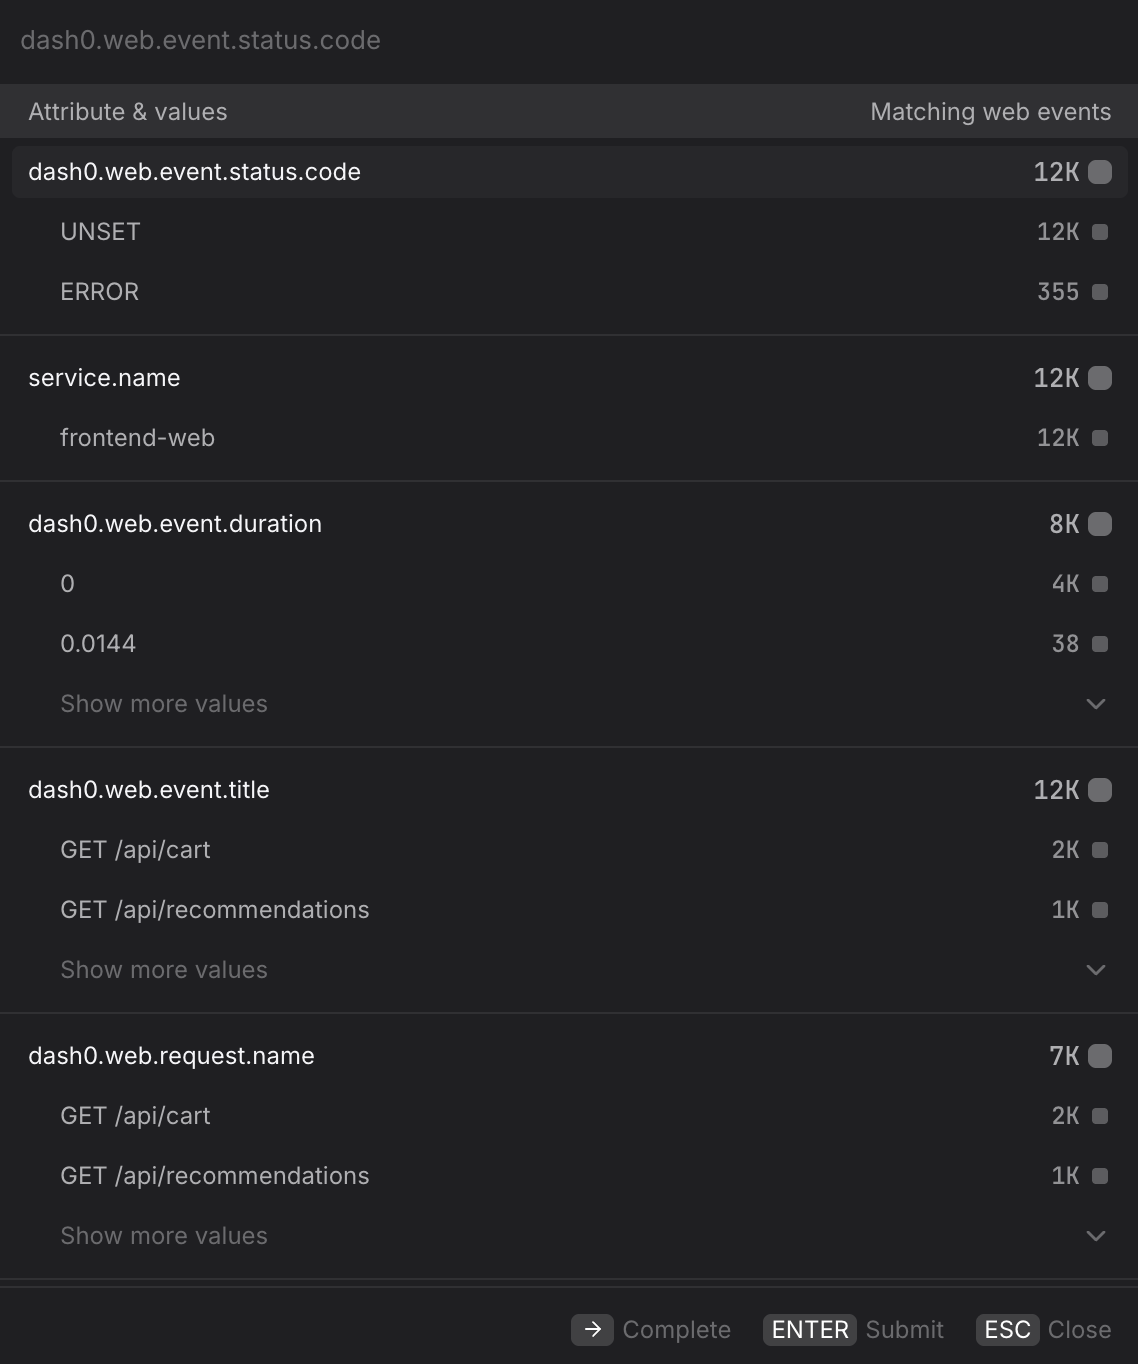
- Focus on error events only. Filter by
dash0.web.event.status.code=ERRORalongside the Events total metric to isolate events that completed with an error status. UseUNSETto see events where no explicit status was recorded. - Scope to a single service. Filter by
service.name=frontend-webto restrict the query to browser telemetry from a specific frontend application — useful when multiple web properties report into the same environment. - Narrow to a specific request. Filter by
dash0.web.request.name=GET /api/cartto measure the volume or duration of a single browser-initiated request — useful when investigating a specific API call that is slow or error-prone for real users. - Focus on a specific page or route. Filter by
dash0.web.event.title=GET /api/recommendationsto scope the query to events associated with a particular page or endpoint, without switching to a Group by view. - Isolate a single environment. Filter by
deployment.environment.name=productionto exclude staging or canary traffic from your baseline — especially important before creating a check rule where test traffic could cause false-positive alerts. - Filter by HTTP response code. Filter by
http.response.status_code=500to isolate requests that received a server-side error response, separating backend failures from client-side errors.
Group By an Attribute
Use the Group by dropdown to split the time series by a web event attribute, producing one line per unique value of that attribute.
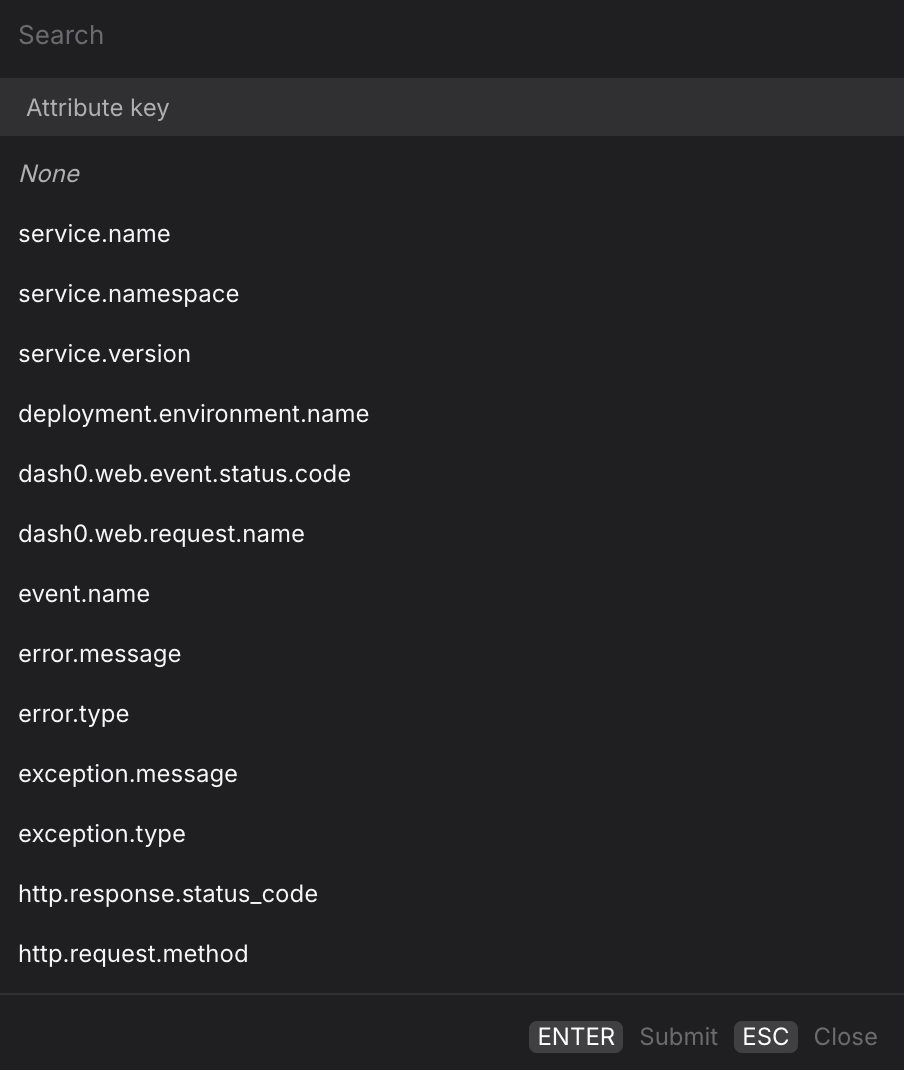
- Group by
dash0.web.request.nameto compare request volume or duration across all endpoints in a single chart — useful for identifying which API calls are the slowest or most error-prone for real users. - Group by
dash0.web.event.status.codealongside the Events total metric to visualise the split between successful and error events over time, and quickly detect when error events begin to grow. - Group by
service.namewhen multiple frontend applications report into the same environment, to compare their performance and error rates side by side. - Group by
http.request.methodto separateGETandPOSTrequest volumes — write operations often have very different latency profiles from reads and may warrant separate SLO thresholds. - Group by
error.typeorexception.typealongside the Errors metric to break down frontend error volume by error class — useful for prioritising which error types to investigate first. - For multi-dimension breakdowns, switch to the PromQL tab. Your current Web Events query is carried over and you can extend the
byclause manually — for example, to split by bothservice.nameanddash0.web.event.status.codesimultaneously.
Promote the Query
Once you have the view you want, use the buttons at the top of the Query Builder, above the preview chart.
![]()
- Click Add to dashboard to add the current query as a panel to a new or existing dashboard.
- Click Create check rule to open the check rule editor with this query pre-filled as the rule expression.