Last updated: March 24, 2026
About the Query Builder
The Query Builder is a visual, guided interface for exploring and plotting time series data based on the telemetry you send to Dash0.
The Query Builder is your starting point for:
- ad-hoc investigations when you want to explore a time series without committing to a dashboard or alert
- mouse-driven point-and-drag workflows to filter, group, and aggregate telemetry rather than writing PromQL from scratch
- starting an investigation that may later be promoted to a dashboard panel (via Add to dashboard) or an alerting rule (via Create check rule)
The Query Builder is designed to reduce the need to write raw PromQL.
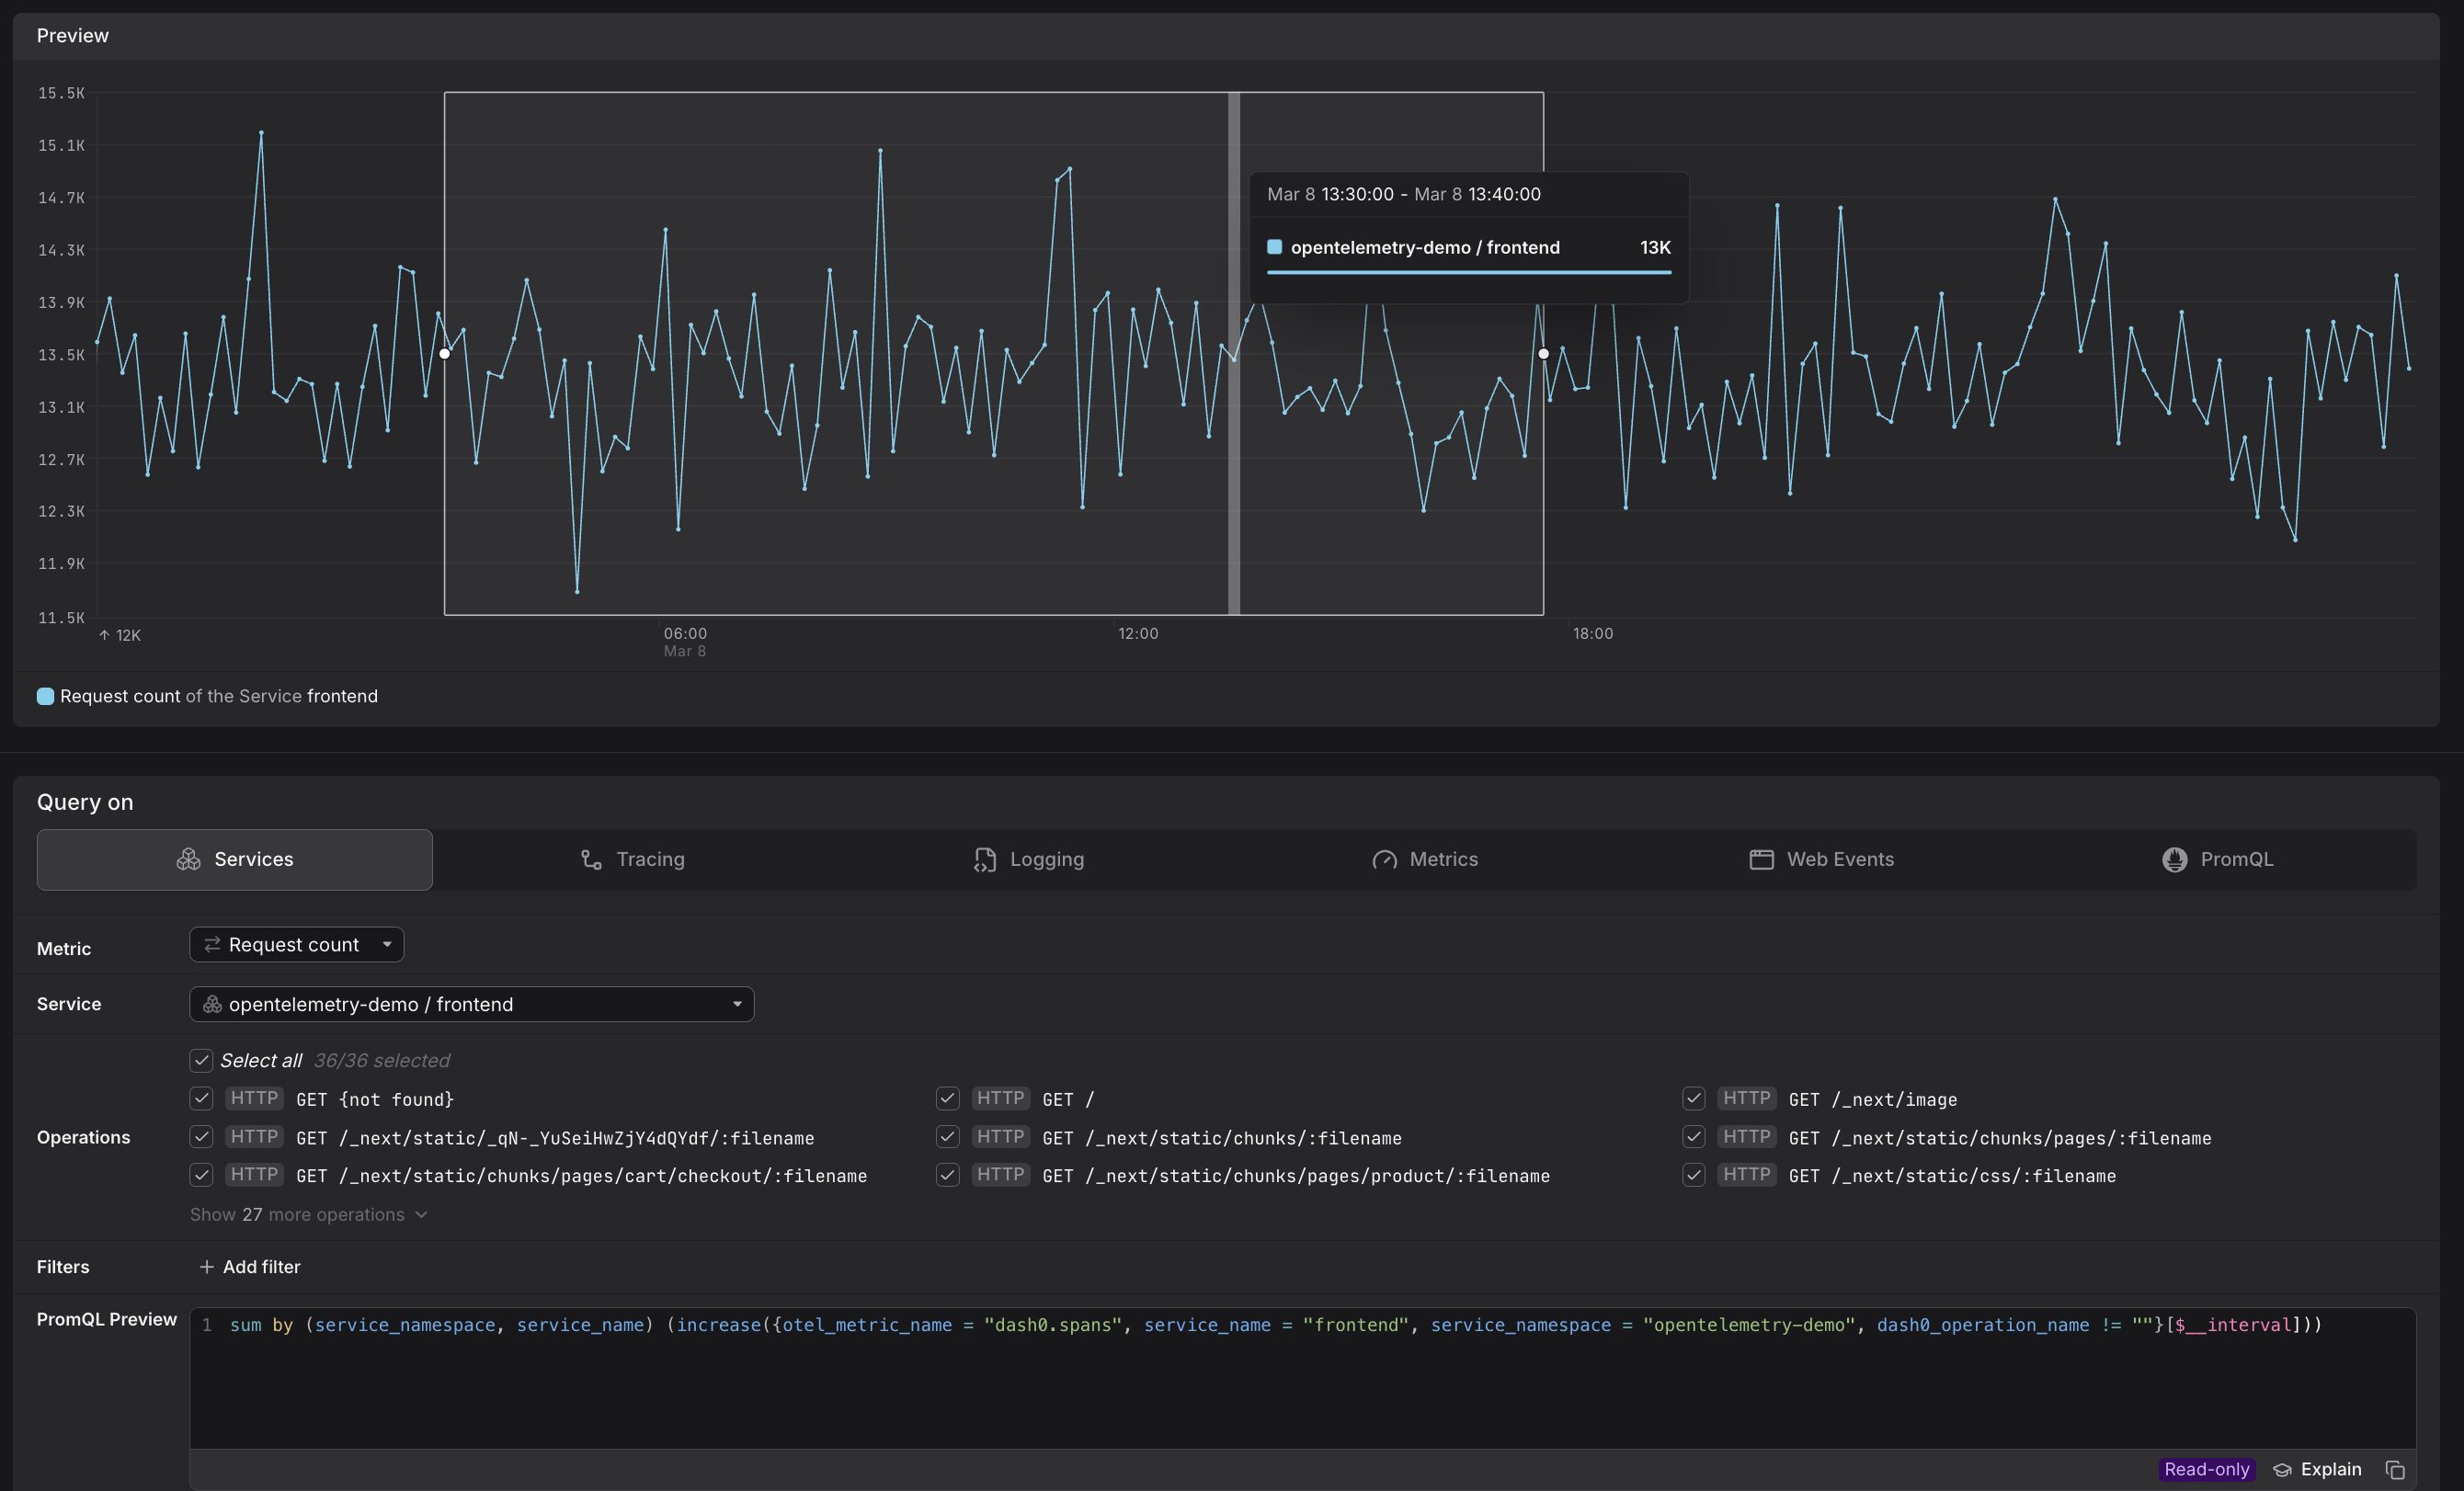
- Every selection you make with your mouse or point-and-drag in the visual interface is translated in real time into a PromQL expression shown in the PromQL Preview at the bottom of the panel.
- You can copy this expression for use in API calls, external tooling, or to learn PromQL incrementally.
- When you need to go beyond what the visual controls offer, you can switch to the PromQL tab at any time and take over the query directly.
Query Builder Tabs
The Query Builder is organized into six tabs under the Query on section. Each tab provides a focused entry point for a different kind of telemetry.
| Tab | What it targets |
|---|---|
| Services | Span-based metrics scoped to a specific service and its operations. More here... |
| Tracing | All span data across every service, with grouping support. More here... |
| Logging | Log count time series, including attributes extracted by Log AI. More here... |
| Metrics | Every metric available in your Dash0 environment. More here... |
| Web Events | Browser telemetry with curated web-vital presets. More here... |
| PromQL | Full manual PromQL entry for advanced use cases. More here... |
The tabs range from highly opinionated (e.g., Services) to fully generic (Metrics and PromQL), letting you choose the level of guidance that suits your task.
The Query Builder shares the same query capabilities as the query builders embedded inside dashboard panels and check rule editors. When you click Add to dashboard or Create check rule from the Query Builder, your current configuration — filters, grouping, metric selection — is carried over. Additional settings specific to panels (chart type, step size, visualization options) or check rules (evaluation schedule, thresholds) then become available in the respective editors.
Further Reading
- Analyze service metrics — explore request counts, error rates, and latency for a specific service and its operations.
- Analyze tracing metrics — query span data across all services with flexible grouping.
- Analyze log metrics — plot log counts over time and filter by attributes extracted by Log AI.
- Analyze all metrics — browse and query every metric available in your Dash0 environment.
- Analyze web events — explore browser telemetry using curated web-vital presets.
- Write PromQL queries — take full manual control of your queries using the PromQL tab.