Last updated: March 24, 2026
Analyze Log Metrics
The Logging tab in the Query Builder provides a time series view of log volume across your entire environment.
Use it to track how many log records are being produced over time, detect sudden spikes in error or warning output, and break down log volume by any attribute — including fields extracted automatically by Dash0's Log AI.
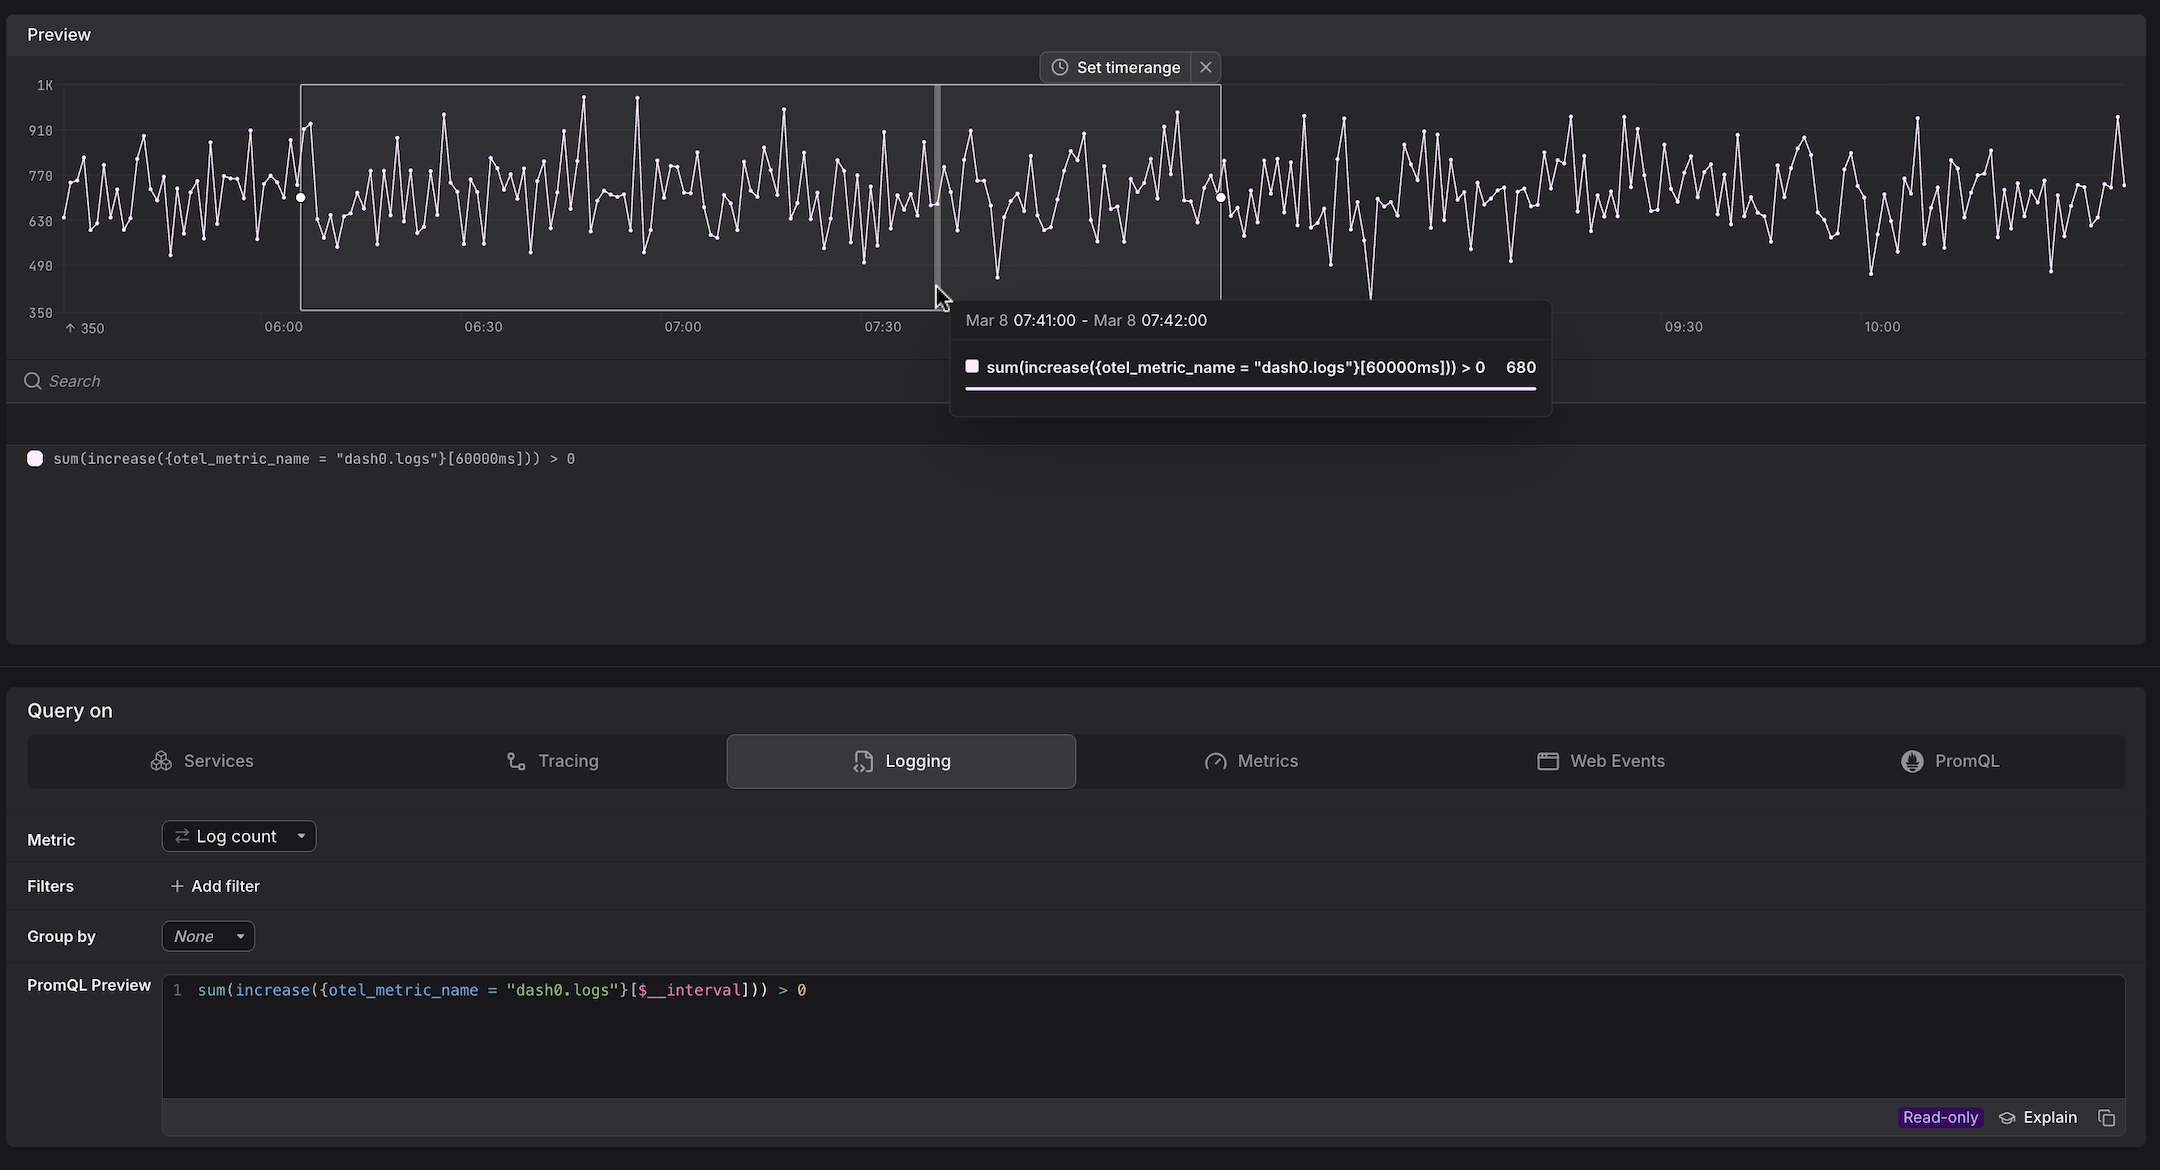
Dash0 automatically generates a set of built-in metrics from your telemetry. These appear alongside your own custom metrics in the Query Builder, as can be seen above. For example:
dash0.logs— derived from log telemetry; used by the Logging tab.
These metrics are also accessible directly in the Metrics and PromQL tabs, giving you the flexibility to combine them with your own metrics or apply custom aggregations.
Select the Metric
Use the Metric dropdown to choose what you want to measure.
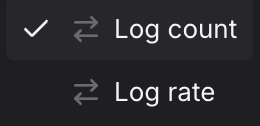
The available metrics fall into two categories, each backed by a different PromQL pattern:
- Log count is a raw counter — queries use
increase()to return the total number of log records accumulated over the selected interval. A> 0guard is appended to suppress empty intervals from the chart. - Log rate measures how fast log records are arriving — queries use
rate()to return log records per second, which is more useful for alerting because it is not affected by the length of the time window.
| Metric | What it measures | When to use it |
|---|---|---|
| Log count | Total number of log records produced across all services in the selected time window. | Use to understand absolute log volume and detect sudden spikes in output — for example, a sharp increase in error or warning records after a deployment. |
Example:sum(increase({otel_metric_name="dash0.logs"}[$__interval])) > 0The > 0 guard suppresses intervals with no log records, removing empty data points from the chart. | ||
| Log rate | Number of log records arriving per second across all services, averaged over the selected time window. | Use for alerting on log throughput — unlike log count, the value is not inflated by a longer time window, making thresholds easier to reason about and reuse across different interval lengths. |
Example:sum(rate({otel_metric_name="dash0.logs"}[$__interval])) | ||
The preview chart updates immediately and the PromQL Preview shows the generated query, including any filters and aggregations applied.
Add Filters
Use + Add filter to scope the query to log records that match specific attribute values. Multiple filters are combined with AND logic.
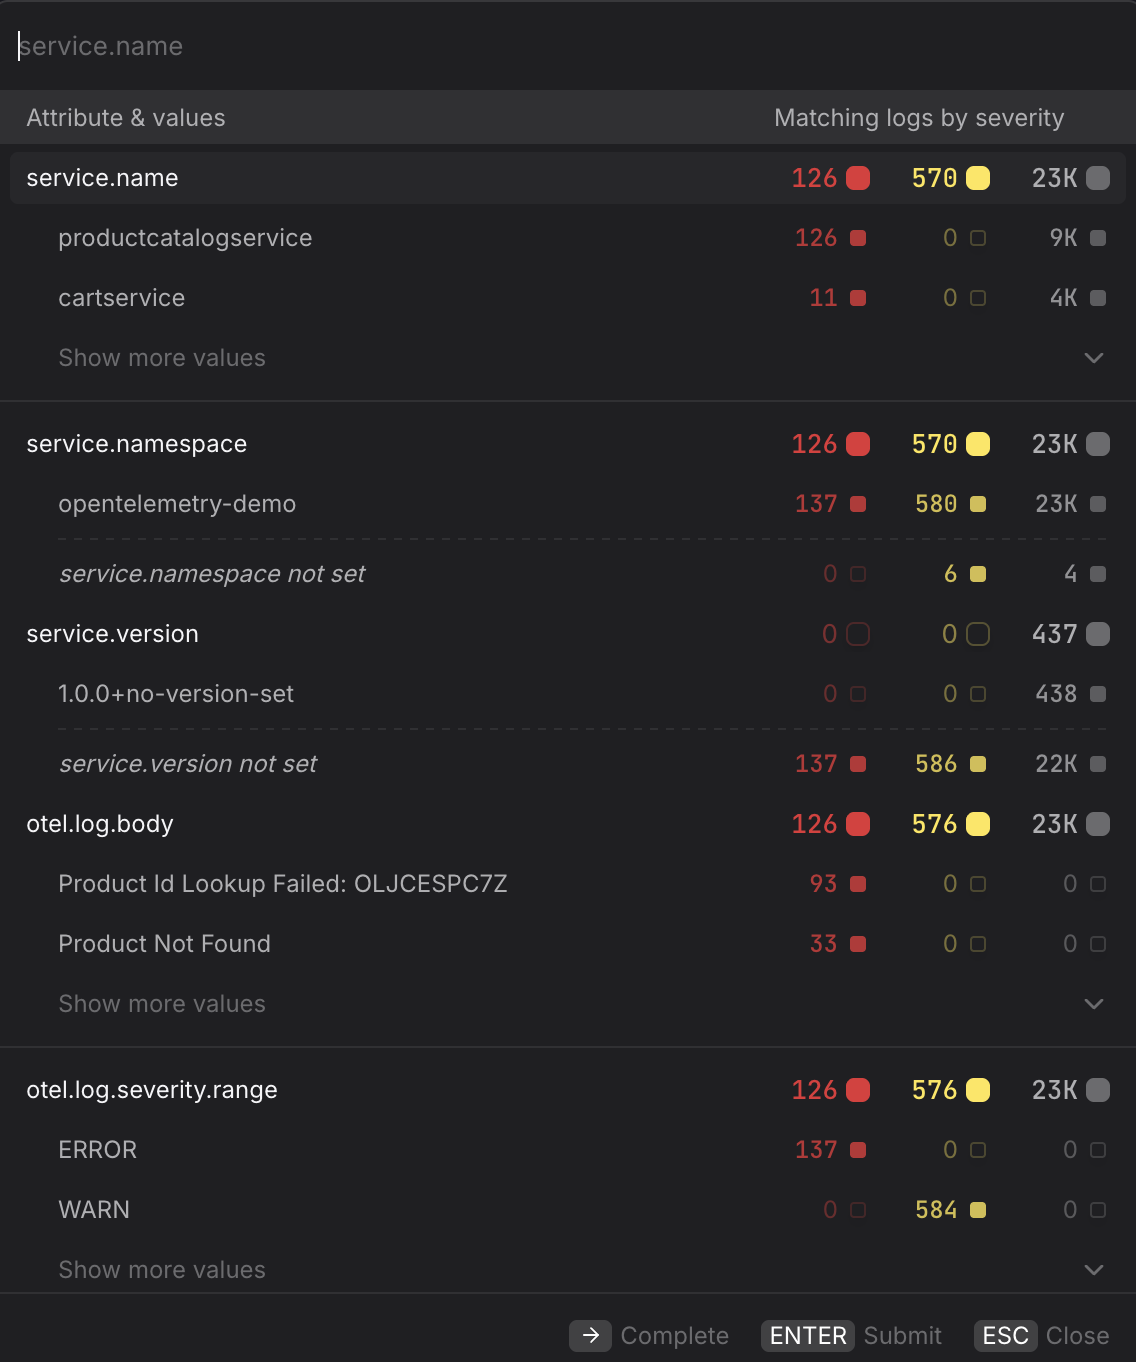
- Isolate a single service. Filter by
service.name=productcatalogserviceto count only the log records produced by that service — useful for tracking whether a noisy service is the source of a volume spike. - Scope to a specific namespace. Filter by
service.namespace=acme-prodin multi-tenant clusters to ensure you are only seeing log records from the intended workload and not from services that share the same name in a different namespace. - Focus on a specific severity range. Filter by
otel.log.severity.range=ERRORto measure only error-level records, orWARNto track warnings. Pairing a filtered log count with a check rule gives you an alert that fires when error output exceeds a threshold, independently of span-based error metrics. - Filter by log body content. Filter by
otel.log.body=Product Not Foundto count only records that contain a specific message — useful for tracking the frequency of a known error pattern over time without writing a custom PromQL query. - Use Log AI-extracted attributes. Dash0's Log AI automatically extracts structured fields from free-text log bodies. These attributes are available as filter keys in the same picker, so you can chart the volume of logs matching a specific extracted value — for example, filtering by a extracted
node_namefield — without writing any PromQL manually.
Group By an Attribute
Use the Group by dropdown to split the time series by a log attribute, producing one line per unique value of that attribute.
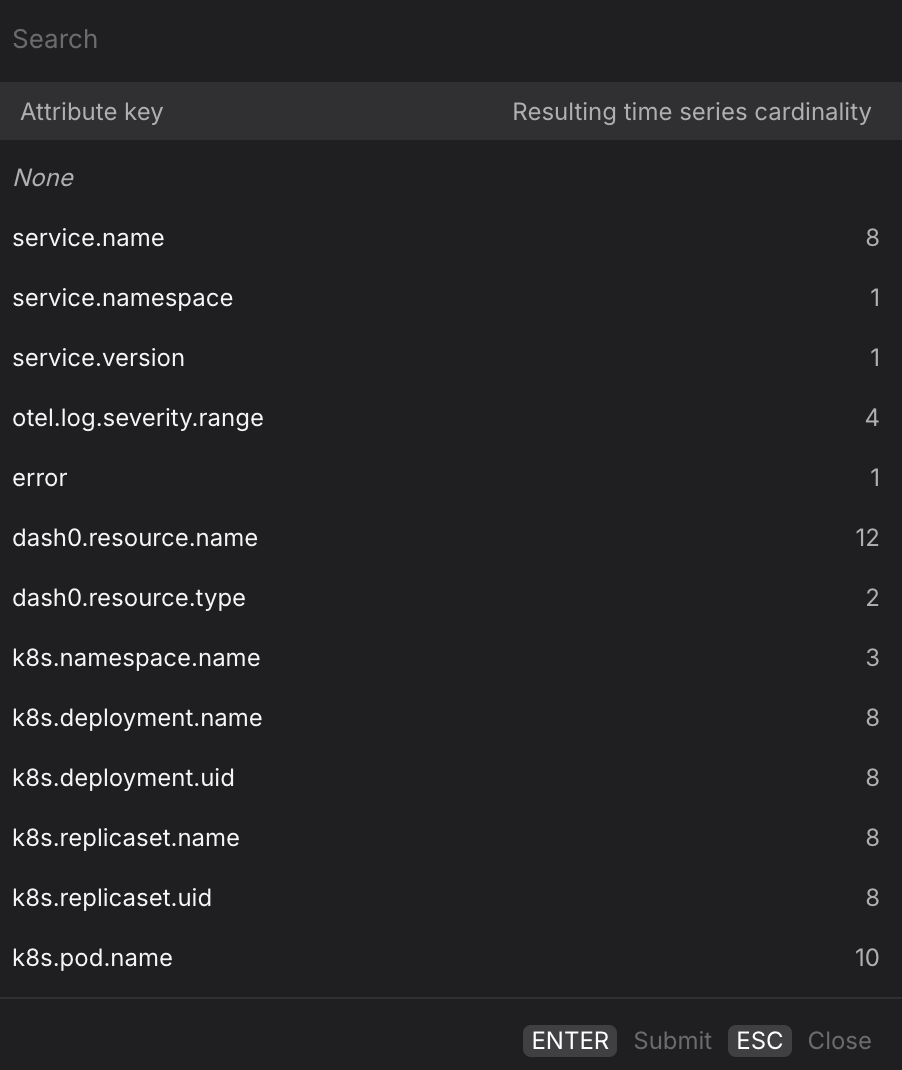
- Group by
service.nameto compare log volume across all services in a single chart — useful for spotting which service started producing significantly more output after a deployment. - Group by
otel.log.severity.rangeto visualise the distribution of log severity levels over time — for example, to detect whenERRORorWARNoutput begins to grow relative to informational records. - Group by
k8s.namespace.nameto compare log volume across Kubernetes namespaces — useful in multi-tenant clusters where you want to confirm that a volume spike is isolated to one namespace rather than environment-wide. - Group by
k8s.deployment.nameork8s.pod.nameto drill down to the infrastructure level — helpful when a service runs across multiple deployments or pods and you want to confirm whether elevated log volume is concentrated on a specific instance. - Group by
dash0.resource.nameto break down log volume by the resource that produced it — useful when you want to correlate log output with a specific infrastructure component across service boundaries. - For multi-dimension breakdowns, switch to the PromQL tab. Your current Logging query is carried over and you can extend the
byclause manually — for example, to split by bothservice.nameandotel.log.severity.rangesimultaneously.
Promote the Query
Once you have the view you want, use the buttons at the top of the Query Builder, above the preview chart.
![]()
- Click Add to dashboard to add the current query as a panel to a new or existing dashboard.
- Click Create check rule to open the check rule editor with this query pre-filled as the rule expression.