Last updated: March 24, 2026
Analyze Tracing Metrics
The Tracing tab in the Query Builder provides a cross-service view of span-based metrics across your entire environment.
Use it when you want to analyze latency, request volumes, or error rates across all services at once, or when you want to break down span data by attributes that cut across service boundaries.
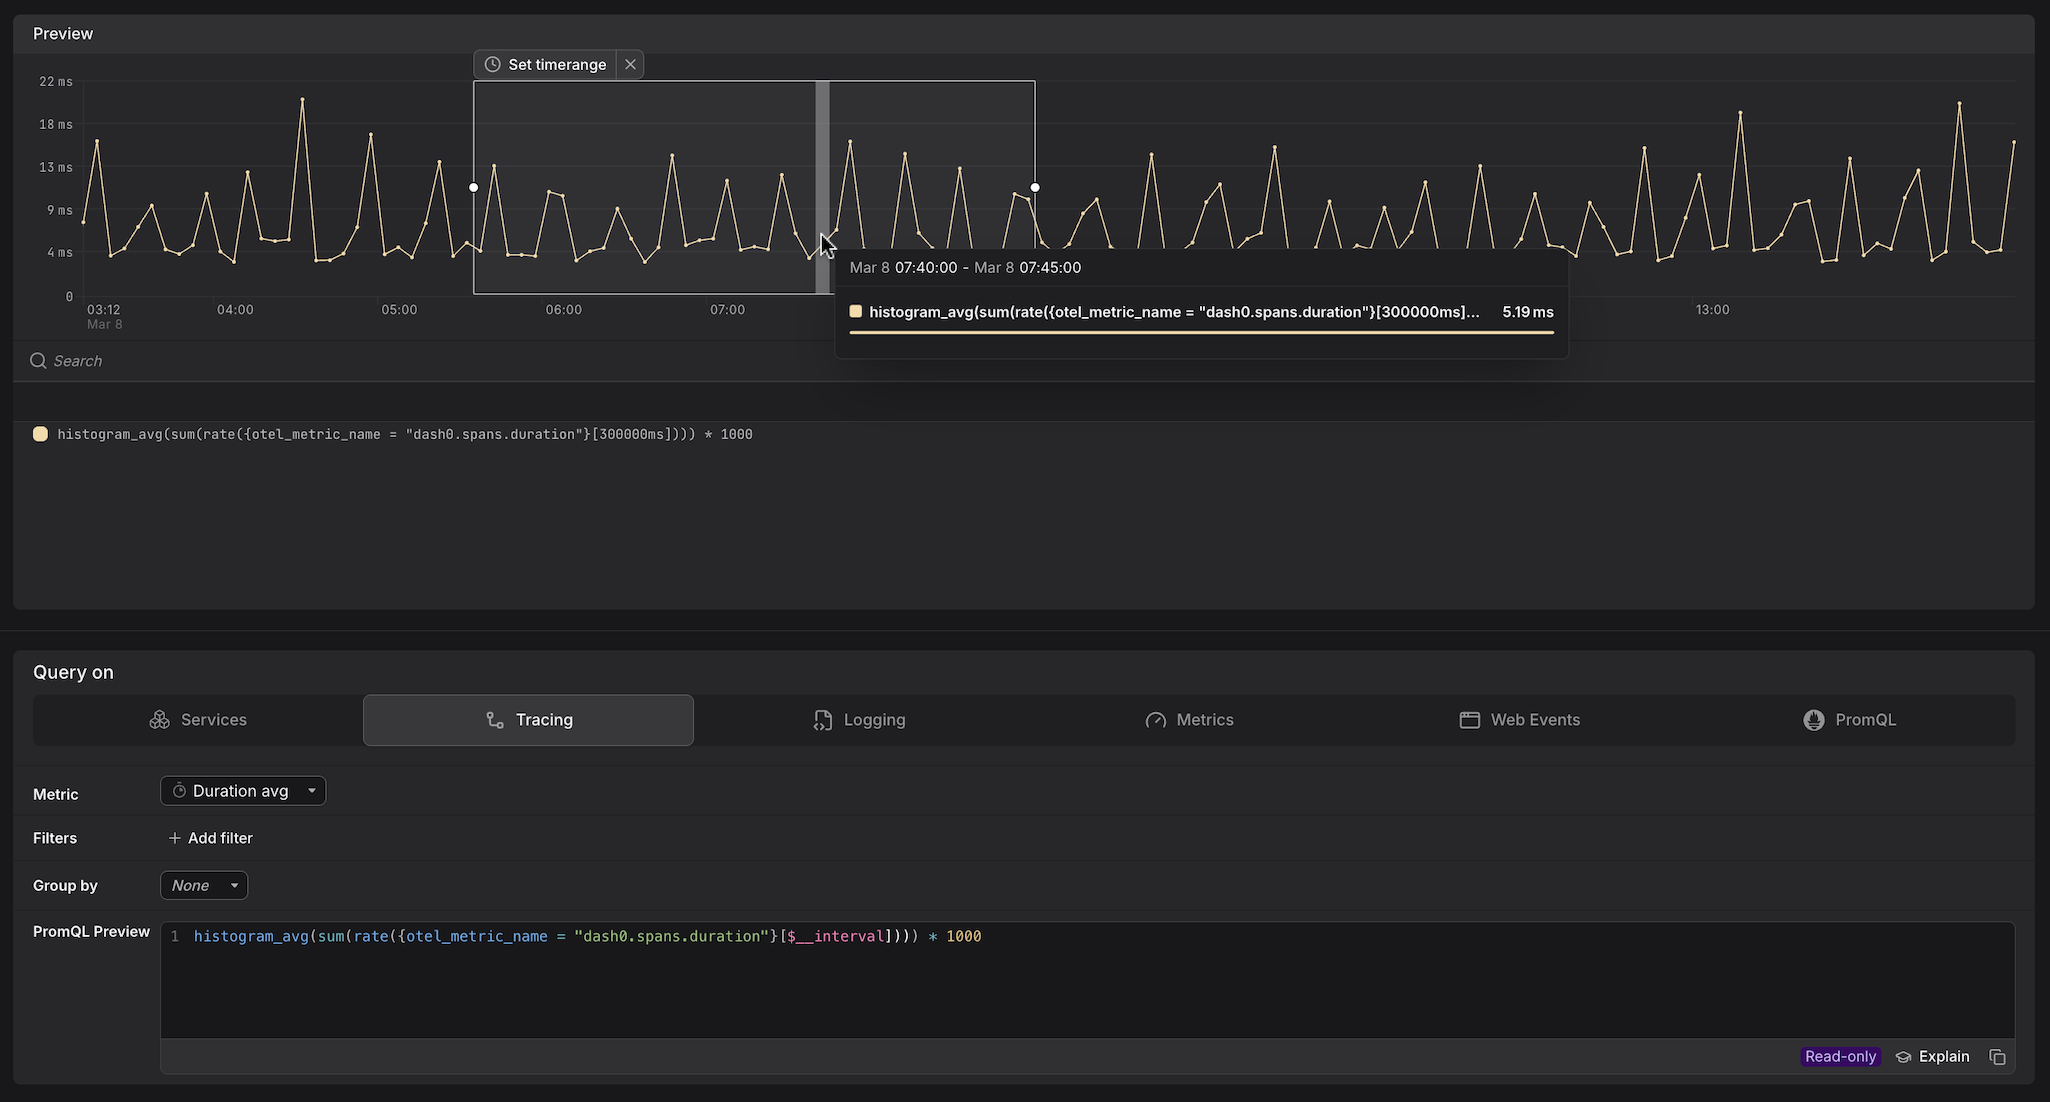
Dash0 automatically generates a set of built-in metrics from your telemetry. These appear alongside your own custom metrics in the Query Builder, as can be seen above. For example:
dash0.spans— derived from span telemetry; used by the Services and Tracing tabs.dash0.spans.duration— the duration histogram of all spans; powers latency queries in Services and Tracing.
These metrics are also accessible directly in the Metrics and PromQL tabs, giving you the flexibility to combine them with your own metrics or apply custom aggregations.
Select the Metric
Use the Metric dropdown to choose what you want to measure.
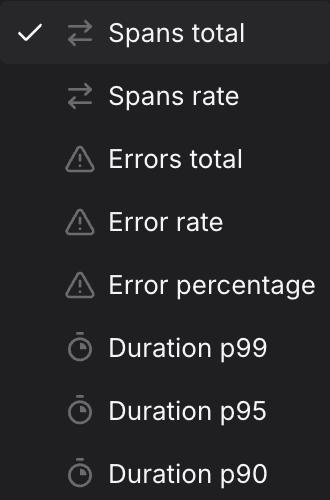
The available metrics fall into categories, each backed by a different PromQL pattern:
- Spans total and Errors total are raw counters — queries use
increase()to return the total number of spans accumulated over the selected interval. A> 0guard is appended to suppress empty intervals from the chart. - Spans rate and Error rate measure how fast spans are arriving — queries use
rate()to return spans per second, which is more useful for alerting because it is not affected by the length of the time window. - Error percentage is a derived ratio — it divides the error span count by the total span count, returning a value between 0 and 1. Dash0 renders this as a percentage in the preview chart, so a query result of
0.05is displayed as5%. Thresholds in check rules must be set in the 0–1 range. - Duration percentiles are computed from
dash0.spans.duration, Dash0's native histogram metric. Unlike classic bucket-based histograms, native histograms encode the full distribution of observed durations dynamically rather than against fixed pre-defined boundaries, which produces significantly more accurate percentile estimates — particularly in the tail. Results are multiplied by1000to convert from seconds to milliseconds.
The examples below show the base query for each metric with no filters or Group by applied. When you add filters or select a Group by attribute in the Query Builder, the generated PromQL will include the corresponding label matchers and by clause automatically.
| Metric | What it measures | When to use it |
|---|---|---|
| Spans total | Total number of spans completed across all services in the selected time window. | Use to understand absolute traffic volume across your entire environment and detect sudden spikes or drops in throughput. |
Example:sum(increase({otel_metric_name="dash0.spans"}[$__interval])) > 0The > 0 guard suppresses intervals with no spans, removing empty data points from the chart. | ||
| Spans rate | Number of spans arriving per second across all services, averaged over the selected time window. | Use for alerting on throughput — unlike spans total, the value is not inflated by a longer time window, making thresholds easier to reason about and reuse across different interval lengths. |
Example:sum(rate({otel_metric_name="dash0.spans"}[$__interval])) | ||
| Errors total | Total number of spans that completed with an error status across all services in the selected time window. | Use to measure the raw volume of failures across your environment — useful when you need to track absolute error budgets rather than proportional error rates. |
Example:sum(increase({otel_metric_name="dash0.spans", otel_span_status_code="ERROR"}[$__interval])) > 0The > 0 guard suppresses intervals with no errors, keeping the chart free of flat zero lines during quiet periods. | ||
| Error rate | Number of error spans arriving per second across all services, averaged over the selected time window. | Use for alerting on error throughput when you want a rate-stable signal that is independent of window length. Pair with Spans rate on the same panel to see errors in context of total traffic. |
Example:sum(rate({otel_metric_name="dash0.spans", otel_span_status_code="ERROR"}[$__interval])) | ||
| Error percentage | The proportion of spans that completed with an error status, returned as a ratio between 0 and 1. Dash0 renders this as a percentage in the preview chart — so a value of 0.28 is displayed as 28%. | Use for SLO definitions and error-budget burn-rate alerts — a ratio-based threshold is stable regardless of traffic volume. Note that thresholds must be set in the 0–1 range: use > 0.05 to alert at 5% errors, not > 5. |
Example:(sum(increase({otel_metric_name="dash0.spans", otel_span_status_code="ERROR"}[$__interval])) > 0) / (sum(increase({otel_metric_name="dash0.spans"}[$__interval])) > 0) > 0The query divides the number of error spans by the total number of spans over the same interval, producing a ratio between 0 and 1. Unlike Errors total or Error rate, this ratio stays meaningful regardless of traffic volume — a spike from 2 errors to 20 errors looks alarming in absolute terms but is far less concerning if total requests also grew tenfold. The > 0 guard on both the numerator and denominator drops intervals where either side has no data, preventing division by zero and suppressing the result entirely during periods with no traffic or no errors. The final > 0 on the full expression ensures that intervals where the ratio evaluates to exactly zero produce no data point, keeping the chart and alert evaluations free of noise during error-free periods. | ||
| Duration — P99 | The 99th percentile span duration in milliseconds across all services — only the slowest 1% of requests exceed this time. | Use to identify tail-latency issues that affect a small but impactful share of requests, such as cache misses or database lock contention. |
Example:histogram_quantile(0.99, sum(rate({otel_metric_name="dash0.spans.duration"}[$__interval]))) * 1000 | ||
| Duration — P95 | The 95th percentile span duration in milliseconds across all services — only the slowest 5% of requests exceed this time. | Use for SLO definitions and alerting; reflects the experience of most users, including those on slower paths. |
Example:histogram_quantile(0.95, sum(rate({otel_metric_name="dash0.spans.duration"}[$__interval]))) * 1000 | ||
| Duration — P90 | The 90th percentile span duration in milliseconds across all services — only the slowest 10% of requests exceed this time. | Use as a practical latency target for internal SLOs — broader than P95 or P99, it gives a stable signal with less sensitivity to individual outliers. |
Example:histogram_quantile(0.90, sum(rate({otel_metric_name="dash0.spans.duration"}[$__interval]))) * 1000 | ||
Add Filters
Use + Add filter to scope the query to specific span attributes. Multiple filters are combined with AND logic.
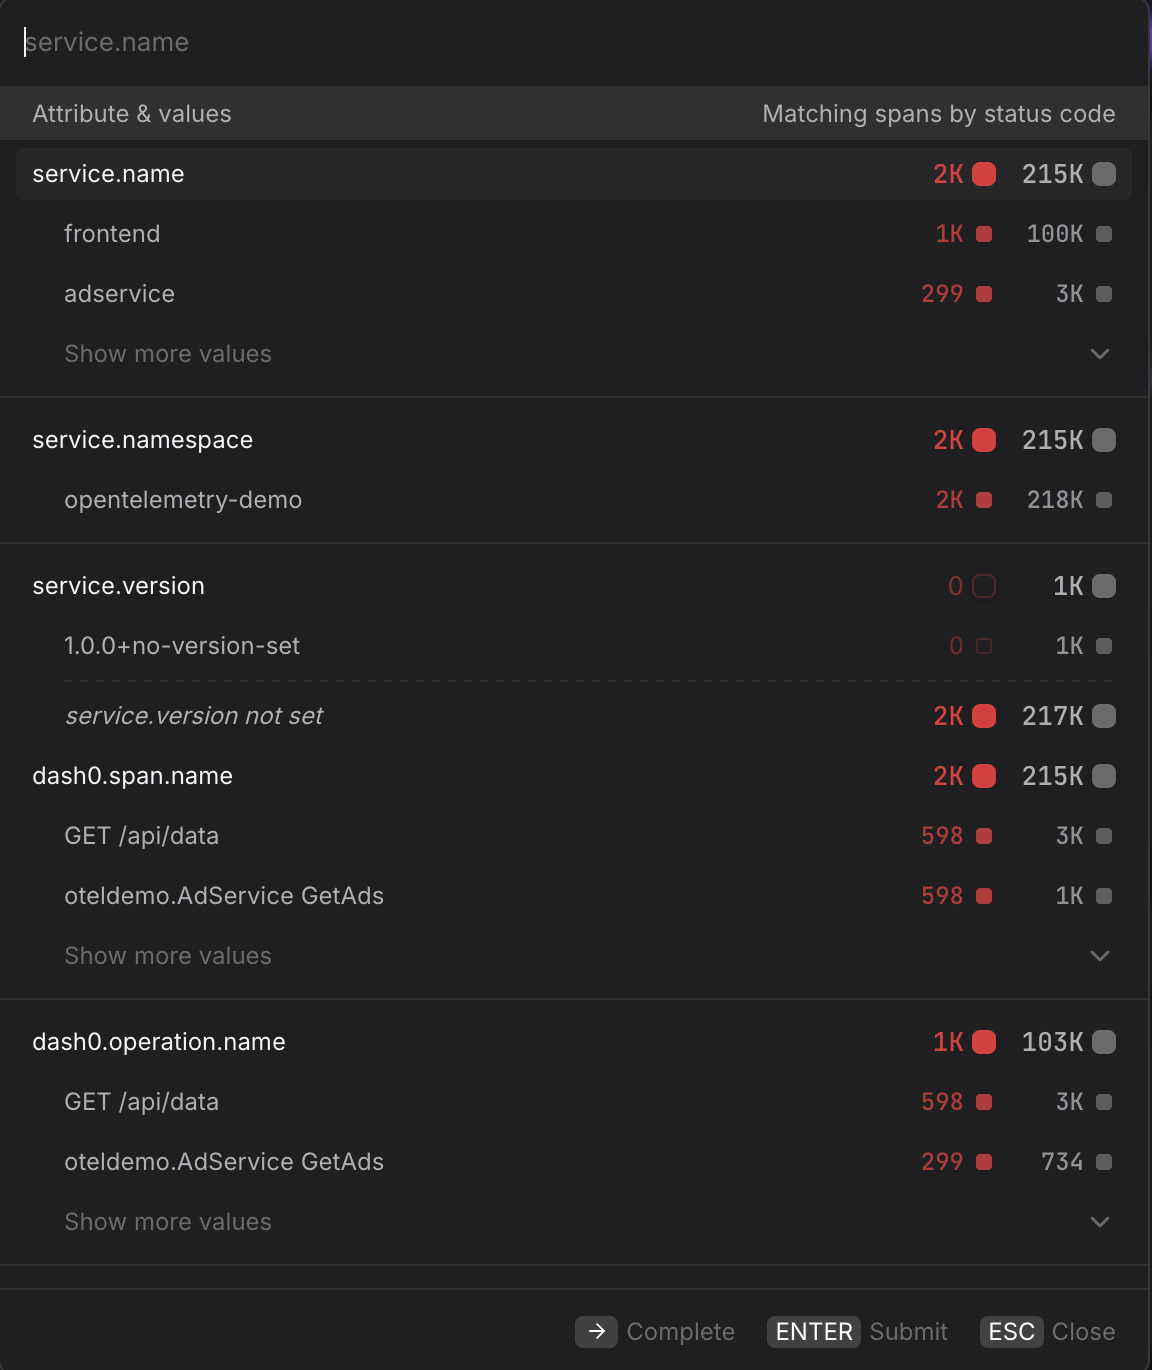
- Scope to a single service. Filter by
service.name=frontendto restrict the query to a single service without switching to the Services tab — useful when you want to combine a service filter with a Group by dimension that is not available in the Services tab. - Scope to a specific namespace. Filter by
service.namespace=acme-prodin multi-tenant clusters to ensure you are only seeing spans from the intended workload and not from services that share the same name in a different namespace. - Focus on error spans only. Filter by
otel.span.status.code=ERRORalongside the Error rate metric to isolate spans that completed with an error status. UseUNSETto see spans where no explicit status was set — these are neither successes nor failures and can indicate incomplete instrumentation. - Filter by HTTP response code. Filter by
http.response.status_code=500to isolate server-side failures and separate them from client errors (400–499) that may not warrant an alert. - Narrow to a specific operation. Filter by
dash0.operation.name=GET /api/datato focus on a single endpoint across all services — useful when the same operation name appears in multiple services and you want to compare their behaviour in the same query.
Group By an Attribute
Use the Group by dropdown to split the time series by a span attribute, producing one line per unique value of that attribute.
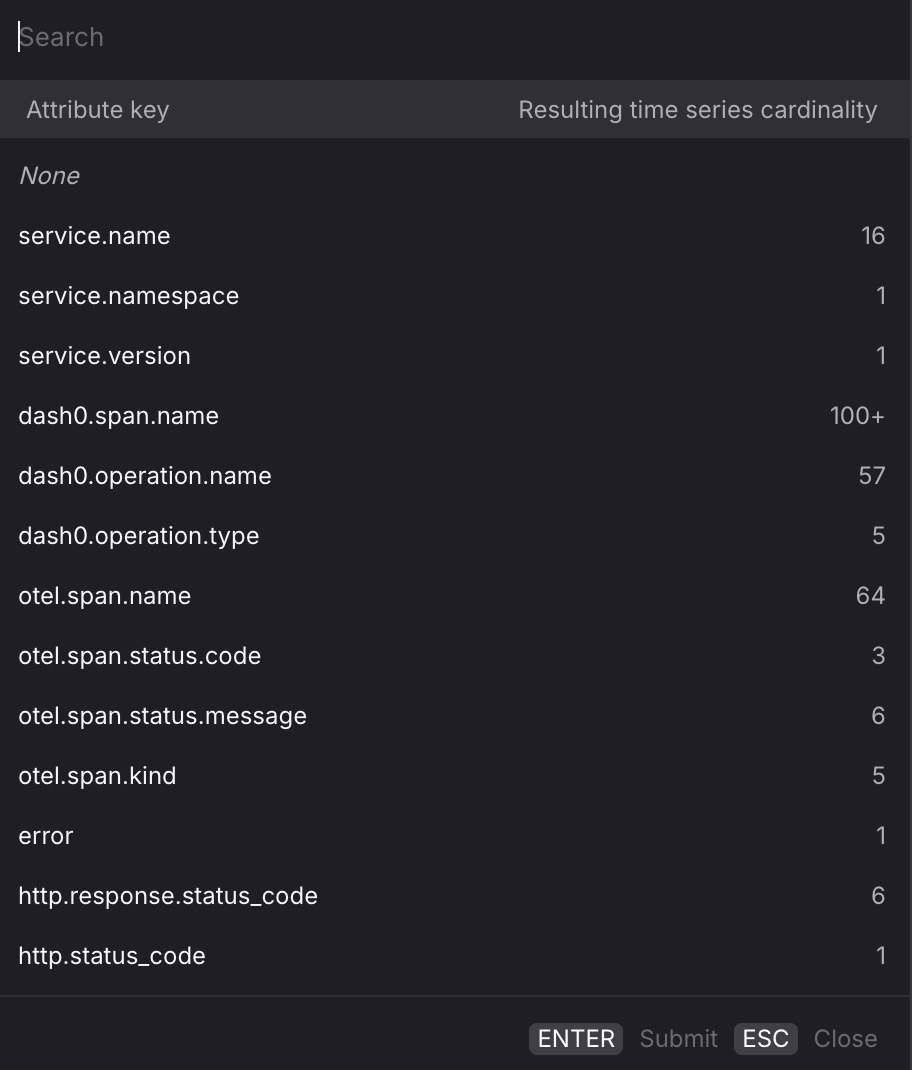
- Group by
service.nameto compare latency or error rates across all services in a single chart — useful for spotting which service started degrading after a deployment without having to build separate queries per service. - Group by
dash0.operation.nameto rank operations by latency or error rate across your entire environment, without being restricted to a single service. - Group by
otel.span.kindto separate client-side spans (CLIENT) from server-side spans (SERVER) — the two often have very different latency profiles and mixing them can obscure where time is actually being spent. - Group by
http.response.status_codealongside the Spans total metric to visualise the distribution of response codes over time and quickly spot when500responses begin to climb relative to200responses. - For multi-dimension breakdowns, switch to the PromQL tab. Your current Tracing query is carried over and you can extend the
byclause manually — for example, to split by bothservice.nameanddash0.operation.namesimultaneously.
Promote the Query
Once you have the view you want, use the buttons at the top of the Query Builder, above the preview chart.
![]()
- Click Add to dashboard to add the current query as a panel to a new or existing dashboard.
- Click Create check rule to open the check rule editor with this query pre-filled as the rule expression.