Last updated: March 23, 2026
Analyze Service Metrics
The Services tab in the Query Builder provides a focused view of span-based metrics for a single service.
Use it to quickly investigate latency, request count, or error rate for a specific service and narrow the data down to the operations that matter.
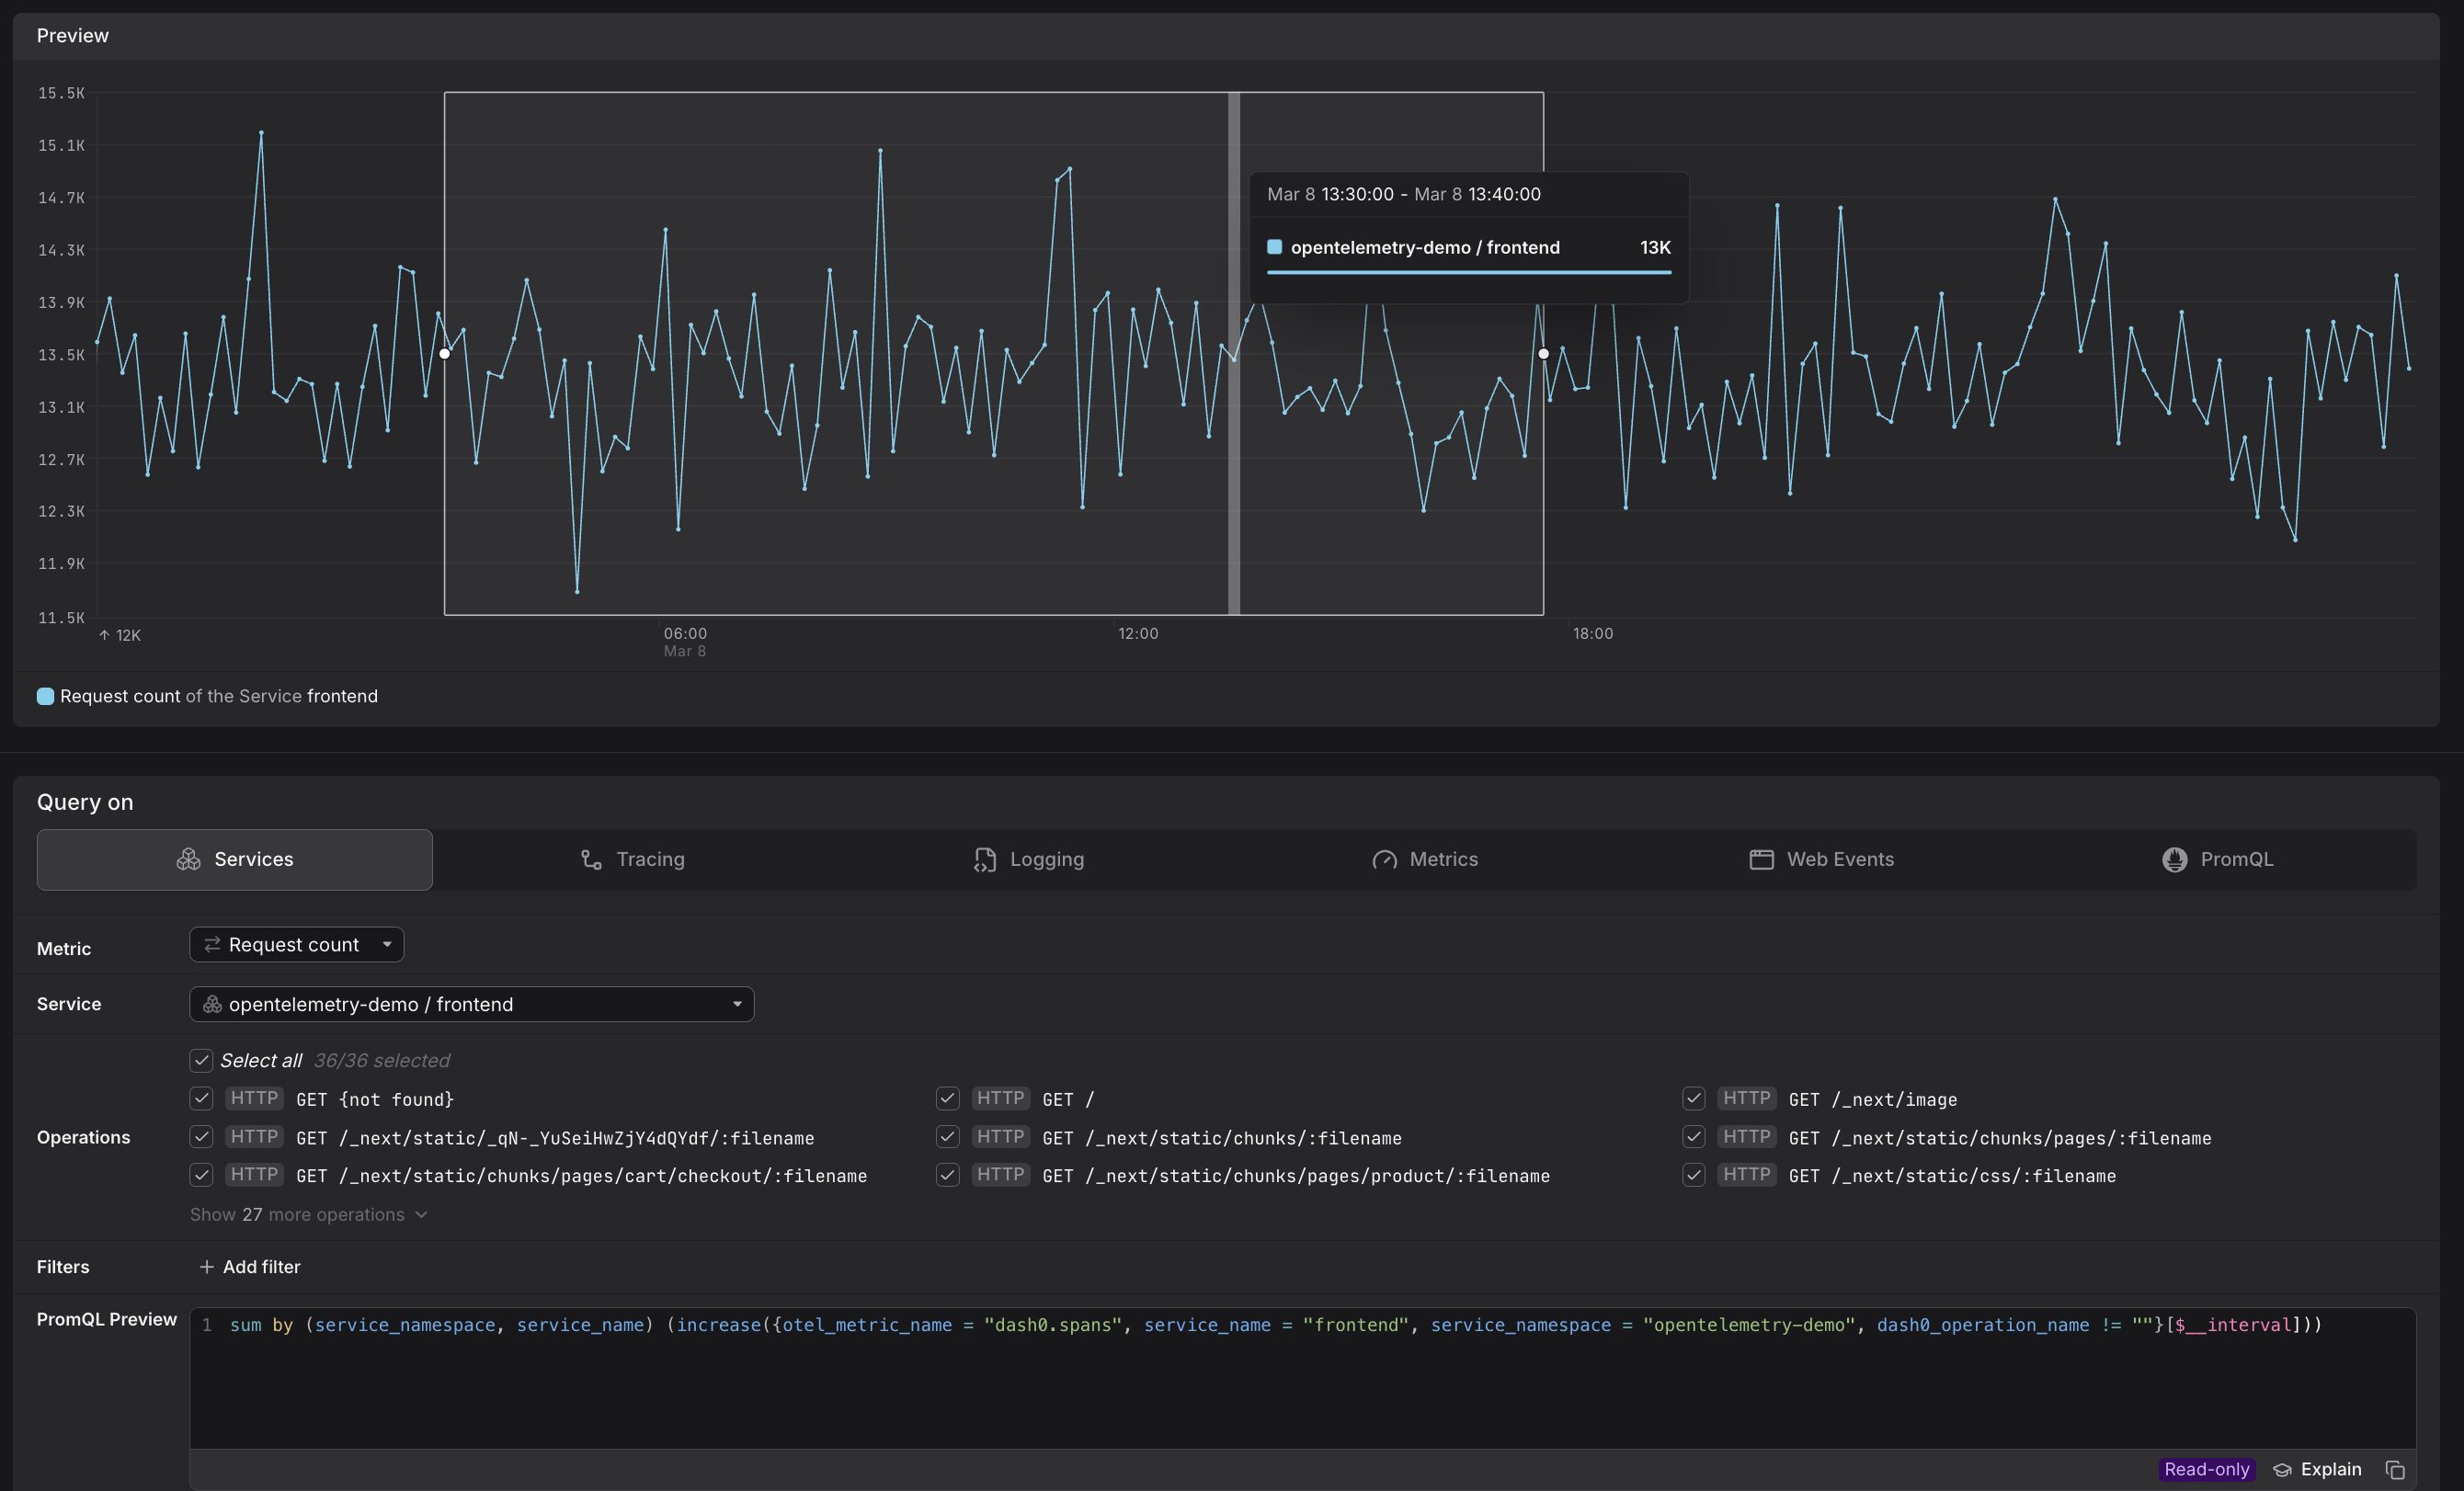
Dash0 automatically generates a set of built-in metrics from your telemetry. These appear alongside your own custom metrics in the Query Builder, as can be seen above. For example:
dash0.spans— derived from span telemetry; used by the Services and Tracing tabs.dash0.spans.duration— the duration histogram of all spans; powers latency queries in Services and Tracing.
These metrics are also accessible directly in the Metrics and PromQL tabs, giving you the flexibility to combine them with your own metrics or apply custom aggregations.
Select the Metric
Use the Metric dropdown to choose what you want to measure.
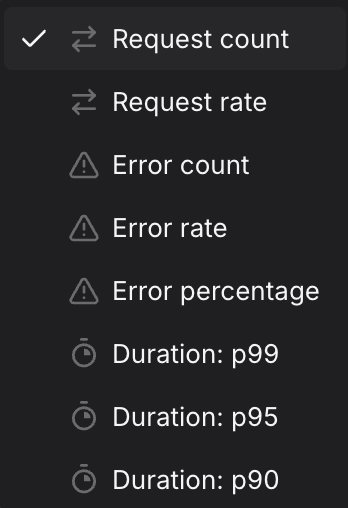
The available metrics fall into categories, each backed by a different PromQL pattern:
- Request count and Error count are raw counters — queries use
increase()to return the total number of spans accumulated over the selected interval. - Request rate and Error rate measure how fast spans are arriving — queries use
rate()to return spans per second, which is more useful for alerting because it is not affected by the length of the time window. - Error percentage is a derived ratio — it divides the error span count by the total span count, returning a value between 0 and 1. Dash0 renders this as a percentage in the preview chart, so a query result of
0.05is displayed as5%. Thresholds in check rules must be set in the 0–1 range. - Duration percentiles are computed from
dash0.spans.duration, Dash0's native histogram metric. Unlike classic bucket-based histograms, native histograms encode the full distribution of observed durations dynamically rather than against fixed pre-defined boundaries, which produces significantly more accurate percentile estimates — particularly in the tail. Results are multiplied by1000to convert from seconds to milliseconds.
| Metric | What it measures | When to use it |
|---|---|---|
| Request count | Total number of spans completed by the service in the selected time window. | Use to understand absolute traffic volume and detect sudden spikes or drops in throughput. |
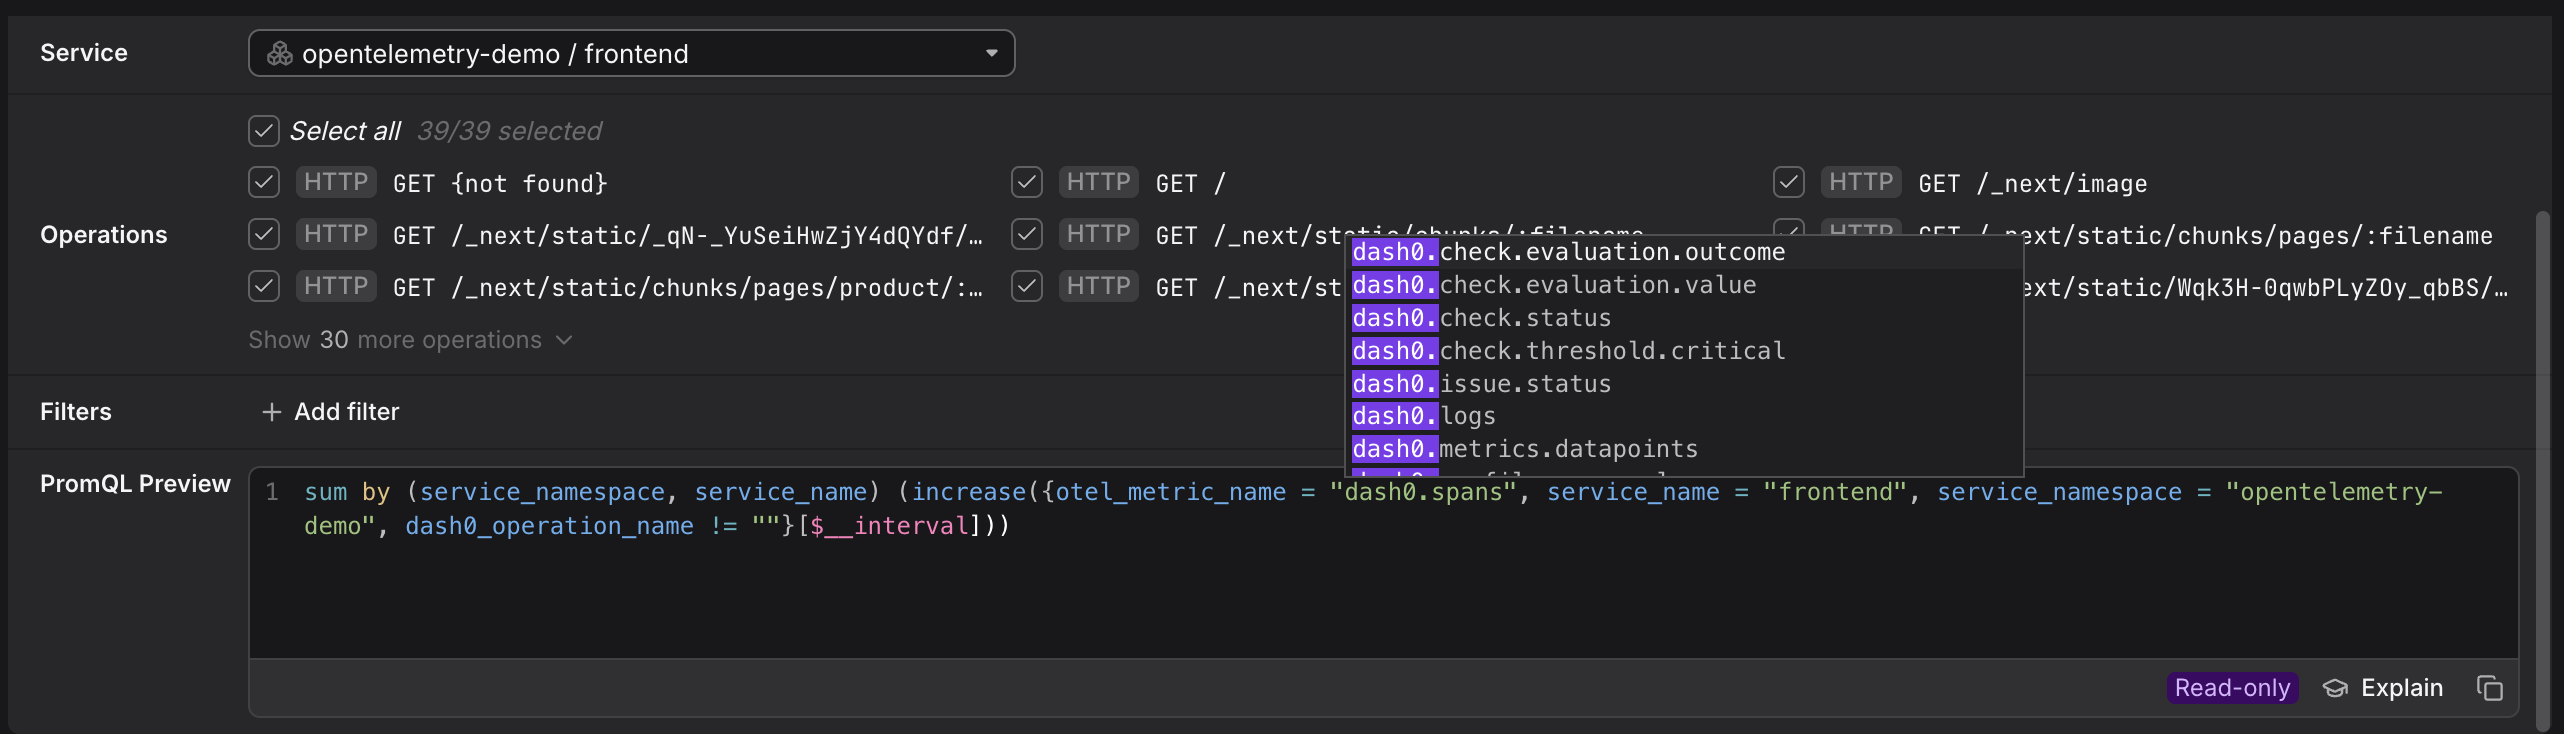
Example:sum by (service_namespace, service_name) (increase({otel_metric_name="dash0.spans", service_name="frontend", service_namespace="acme-prod", dash0_operation_name!=""}[$__interval])) | ||
| Request rate | Number of spans arriving per second, averaged over the selected time window. | Use for alerting on throughput — unlike request count, the value is not inflated by a longer time window, making thresholds easier to reason about and reuse across different interval lengths. |
Example:sum by (service_namespace, service_name) (rate({otel_metric_name="dash0.spans", service_name="frontend", service_namespace="acme-prod", dash0_operation_name!=""}[$__interval])) | ||
| Error count | Total number of spans that completed with an error status in the selected time window. | Use to measure the raw volume of failures — useful when you need to track absolute error budgets rather than proportional error rates. |
Example:sum by (service_namespace, service_name) (increase({otel_metric_name="dash0.spans", service_name="frontend", service_namespace="acme-prod", otel_span_status_code="ERROR", dash0_operation_name!=""}[$__interval])) | ||
| Error rate | Number of error spans arriving per second, averaged over the selected time window. | Use for alerting on error throughput when you want a rate-stable signal that is independent of window length. Pair with Request rate on the same panel to see errors in context of total traffic. |
Example:sum by (service_namespace, service_name) (rate({otel_metric_name="dash0.spans", service_name="frontend", service_namespace="acme-prod", otel_span_status_code="ERROR", dash0_operation_name!=""}[$__interval])) | ||
| Error percentage | The proportion of spans that completed with an error status, returned as a ratio between 0 and 1. Dash0 renders this as a percentage in the preview chart — so a value of 0.28 is displayed as 28%. | Use for SLO definitions and error-budget burn-rate alerts — a ratio-based threshold is stable regardless of traffic volume. Note that thresholds must be set in the 0–1 range: use > 0.05 to alert at 5% errors, not > 5. |
Example:(sum by (service_namespace, service_name) (increase({otel_metric_name = "dash0.spans", service_name = "frontend", service_namespace = "acme-prod", dash0_operation_name != "", otel_span_status_code = "ERROR"}[$__interval]))) / (sum by (service_namespace, service_name) (increase({otel_metric_name = "dash0.spans", service_name = "frontend", service_namespace = "acme-prod", dash0_operation_name != ""}[$__interval])) > 0) > 0The query divides the number of error spans by the total number of spans over the same interval, producing a ratio between 0 and 1. Unlike Error count or Error rate, this ratio stays meaningful regardless of traffic volume — a spike from 2 errors to 20 errors looks alarming in absolute terms but is far less concerning if total requests also grew tenfold. The > 0 guard on the denominator prevents division by zero during intervals with no traffic, dropping the data point instead of producing NaN or +Inf. The > 0 on the full expression suppresses data points when there are no errors, removing the flat zero line from the chart and keeping alert evaluations free of noise during quiet periods. | ||
| Duration — P99 | The 99th percentile span duration in milliseconds — only the slowest 1% of requests exceed this time. | Use to identify tail-latency issues that affect a small but impactful share of requests, such as cache misses or database lock contention. |
Example:histogram_quantile(0.99, sum by (service_namespace, service_name) (rate({otel_metric_name="dash0.spans.duration", service_name="frontend", service_namespace="acme-prod", dash0_operation_name!=""}[$__interval]))) * 1000 | ||
| Duration — P95 | The 95th percentile span duration in milliseconds — only the slowest 5% of requests exceed this time. | Use for SLO definitions and alerting; reflects the experience of most users, including those on slower paths. |
Example:histogram_quantile(0.95, sum by (service_namespace, service_name) (rate({otel_metric_name="dash0.spans.duration", service_name="frontend", service_namespace="acme-prod", dash0_operation_name!=""}[$__interval]))) * 1000 | ||
| Duration — P90 | The 90th percentile span duration in milliseconds — only the slowest 10% of requests exceed this time. | Use as a practical latency target for internal SLOs — broader than P95 or P99, it gives a stable signal with less sensitivity to individual outliers. |
Example:histogram_quantile(0.90, sum by (service_namespace, service_name) (rate({otel_metric_name="dash0.spans.duration", service_name="frontend", service_namespace="acme-prod", dash0_operation_name!=""}[$__interval]))) * 1000 | ||
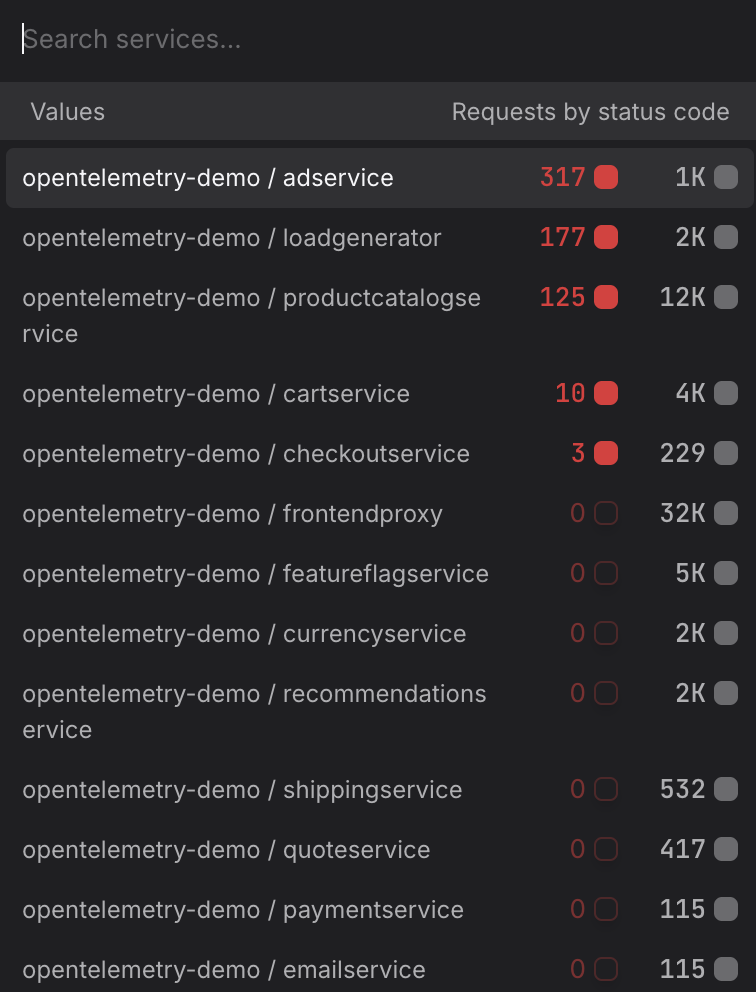
Filter by Service
Use the Service dropdown to select the service you want to investigate.
- Start at the edge, work inward. If you are investigating a user-reported slowdown, start with your outermost public-facing service — for example
frontendorapi-gateway— to confirm whether latency is concentrated there or whether it is being passed down from a dependency. Then move to upstream callers likecheckoutorpaymentto trace where the time is actually being spent. - Investigate a downstream dependency directly. If a call-graph or trace already points to a slow dependency — for example a
recommendationorproduct-catalogservice — select that service directly rather than the caller. Measuring the dependency in isolation tells you whether the problem is in the service itself or in how it is being called. - Compare services side by side. To compare two services — for example
order-serviceandpayment-service— build a query for each and add both to the same dashboard panel. Seeing their P95 latency on the same chart makes it easier to spot which service started degrading first after a deployment.
Filter by Operation
Once a service is selected, the Operations list appears below the service picker.
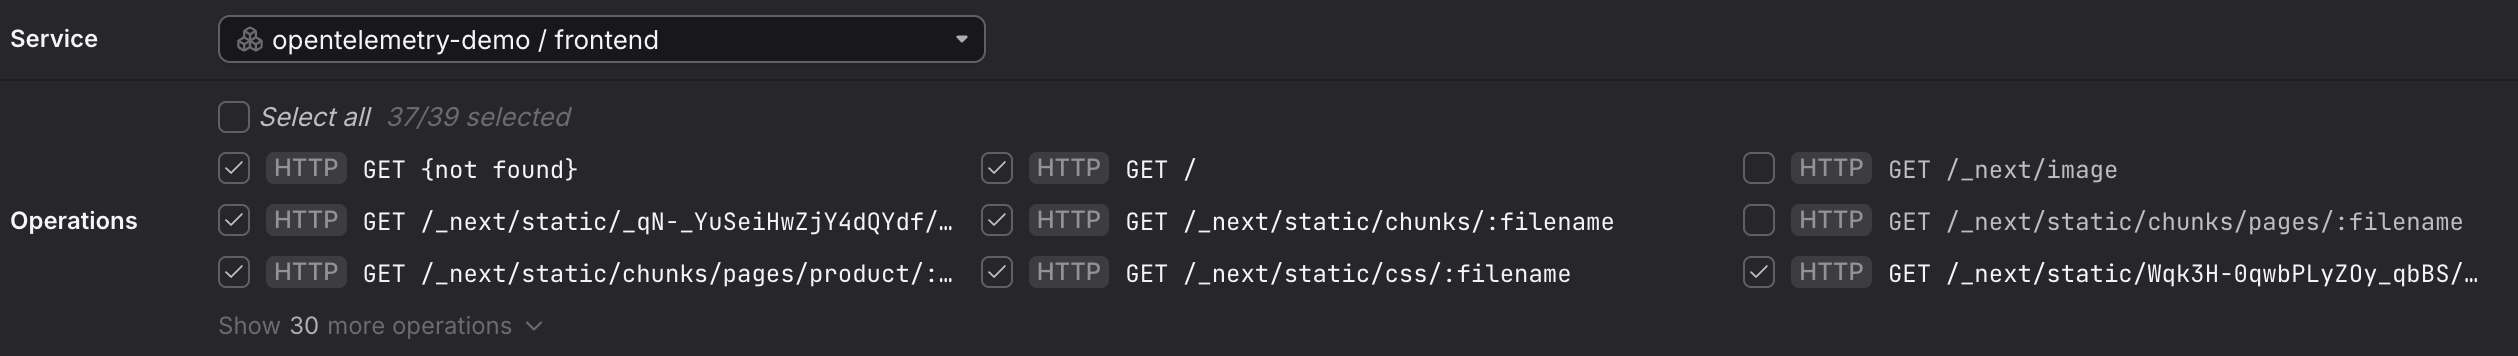
It shows every operation (endpoint) that the selected service has reported spans for.
- All operations are selected by default.
- Uncheck individual operations to exclude them from the query — for example, to remove a health-check endpoint like
/pingthat would otherwise skew your latency data. (More tips below.) - Use Select all to reset to the full set.
- Remove health-check and liveness probe endpoints. Kubernetes liveness and readiness probes generate a continuous high-frequency stream of fast, successful spans. Endpoints like
/healthz,/readyz,/livez, or/pingwill pull your P90 and P95 values down and make real user latency appear better than it is. Uncheck these before adding a query to a dashboard or check rule. - Isolate write operations from reads. Services that handle both reads and writes often show a bimodal latency distribution —
GEToperations are typically fast whilePOSTorPUToperations that write to a database are slower. Uncheck read operations likeGET /productswhen you want a clean view of write latency, and vice versa. - Focus on a single high-value endpoint. If you are building a check rule for a specific SLO — for example a 300 ms P95 target for your checkout flow — uncheck everything except the operation that represents that flow, such as
POST /checkout. Including unrelated operations in the same rule makes it harder to attribute a breach to its root cause. - Use Select all to reset after exploring. If you have been unchecking operations to explore different slices of the data, click Select all before promoting the query to a dashboard to make sure you are not accidentally omitting operations that belong in the final view.
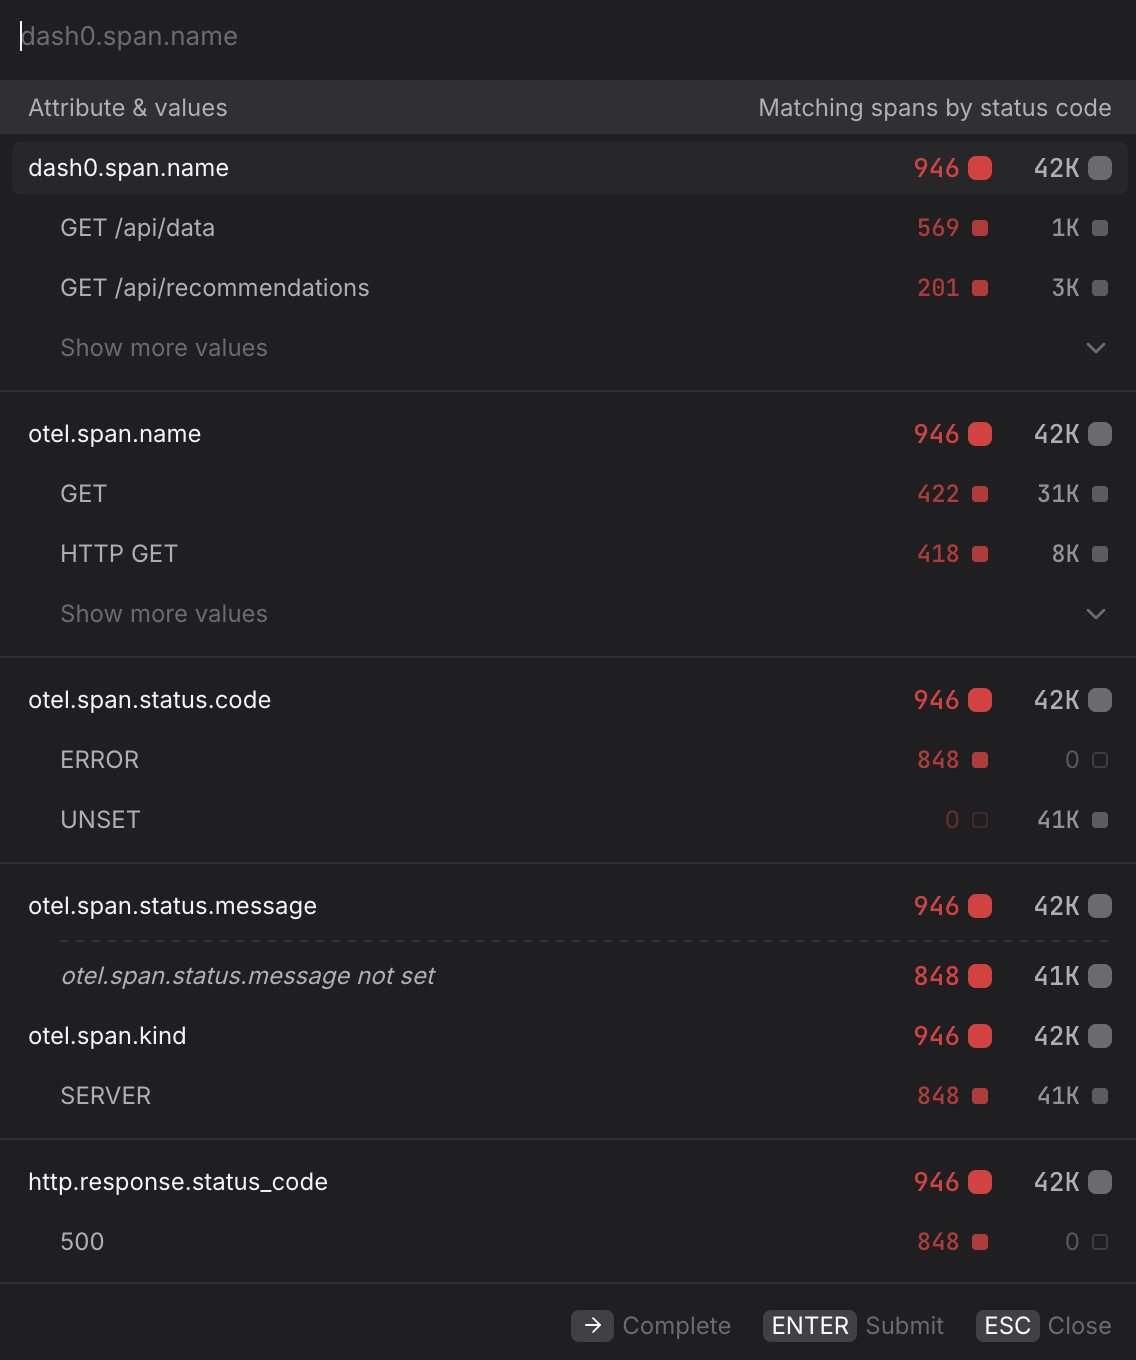
Filter by Attributes
To narrow the data further, click + Add filter and specify the attribute and value you want to match. Multiple filters are combined with AND logic.
- Isolate a single environment. Filter by
deployment.environment=productionto exclude staging or canary traffic from your baseline. This is especially important before creating a check rule, where staging noise can cause false-positive alerts. - Scope to a specific cluster. If the same service runs across multiple Kubernetes clusters, filter by
k8s.cluster.name=prod-eu-west-1to compare clusters individually and rule out region-specific issues. - Focus on error spans only. Filter by
otel.span.status.code=ERRORalongside the Error rate metric to isolate spans that completed with an error status. UseUNSETto see spans where no explicit status was set — these are neither successes nor failures and can indicate incomplete instrumentation. - Filter by HTTP response code. Filter by
http.response.status_code=500to isolate server-side failures and separate them from client errors (400–499) that may not warrant an alert. - Narrow to a specific operation name. Filter by
dash0.span.name=GET /api/datato focus on a single endpoint without using the Operations list — useful when you want to combine an operation filter with other attribute filters in the same query. - Pin to a specific namespace. In multi-tenant clusters, filter by
k8s.namespace.name=acme-prodto ensure you are only seeing spans from the intended workload and not from services that share the same name in a different namespace.
Finetune the Query
Use Ctrl-Space in the PromQL Preview to see relevant ways of finetuning the prompt as needed.
A common workflow is to start with a visual tab to get the basic shape of a query, then switch to the PromQL tab to add complexity.
Promote the Query
Once you have the view you want, use the buttons at the top of the Query Builder, above the preview chart.
![]()
- Click Add to dashboard to add the current query as a panel to a new or existing dashboard.
- Click Create check rule to open the check rule editor with this query pre-filled as the rule expression.