
Last updated:
Filter and Group Profiles
| Control | Where | Purpose |
|---|---|---|
| Filter profiles... | Above the metrics chart | Restrict profiles by their attributes. |
| Sum by | Beside Profile type, or inside each comparison query | Split the metrics chart into series by attribute values. |
| Group by | Flame graph toolbar | Change the grouping of the code visualization. |
| Samples group by | Flame chart toolbar | Organize samples into separate timeline groups. |
| Add filter | Code visualization toolbar | Keep or drop whole stacks, or filter individual frames. |
Filter profiles by workload
- Click Filter profiles..., or use
Shift+F. - Select an available attribute, an operator, and the value to match.
- Add further conditions as needed.
Use attributes present in your profiles. For Kubernetes data, useful choices include k8s.namespace.name, k8s.deployment.name, and k8s.pod.name. For example, filter to a namespace before investigating one pod within it. See Filtering for the shared filter controls.
Split the metrics chart with Sum by
- Open Sum by.
- Search for an attribute key.
- Select one or more keys. Press Space to toggle a selection and Enter to submit it.
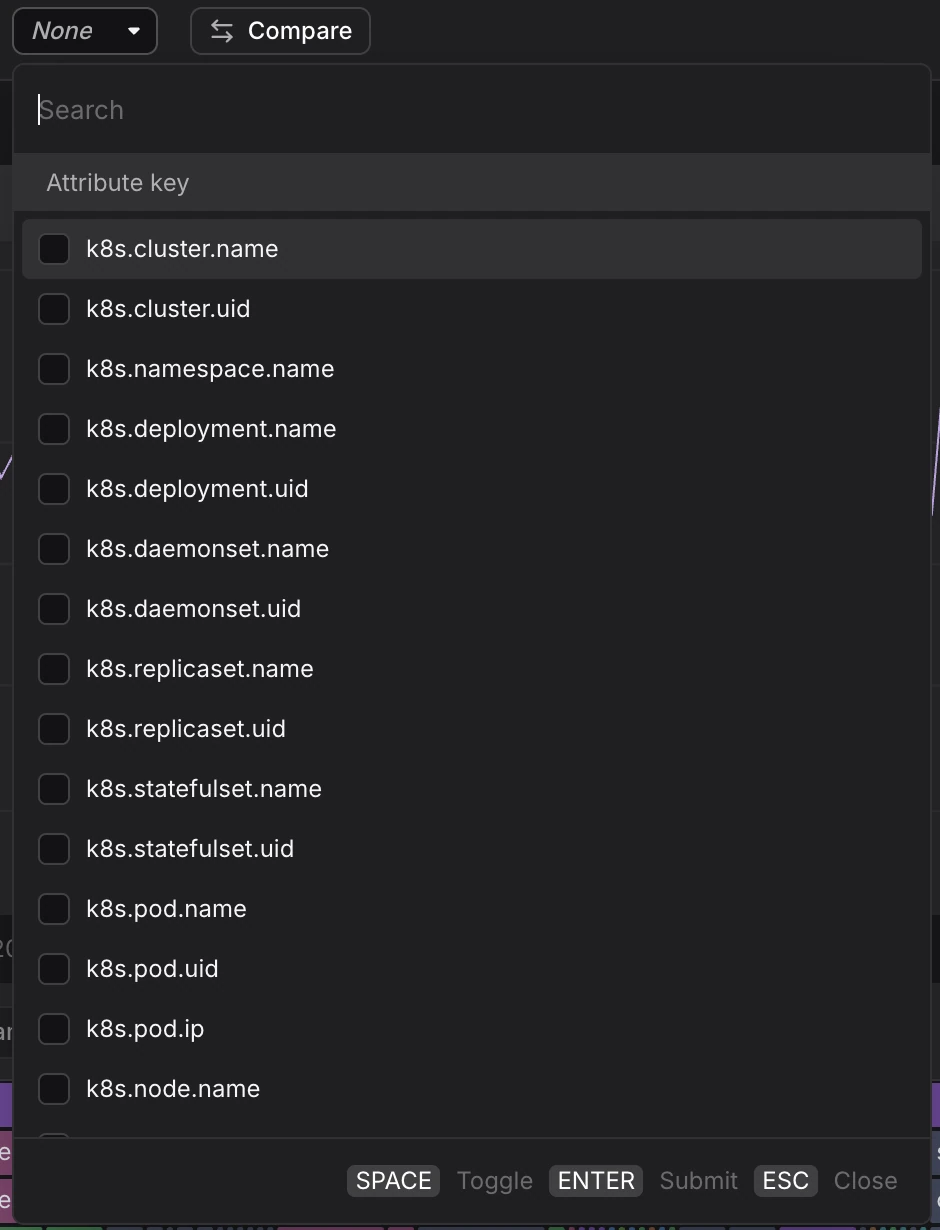
Select k8s.pod.name to compare pods. In the On-CPU screenshot, each series shows a pod's CPU consumption. The legend identifies each series by its attribute value. Set Sum by to None for the combined All samples series.

To group the code views, use Group by in the flame graph or Samples group by in the flame chart. See Inspect Samples over Time for timeline grouping.
Filter call stacks and frames
Click Add filter in the visualization toolbar to choose a preset or use Build a filter.
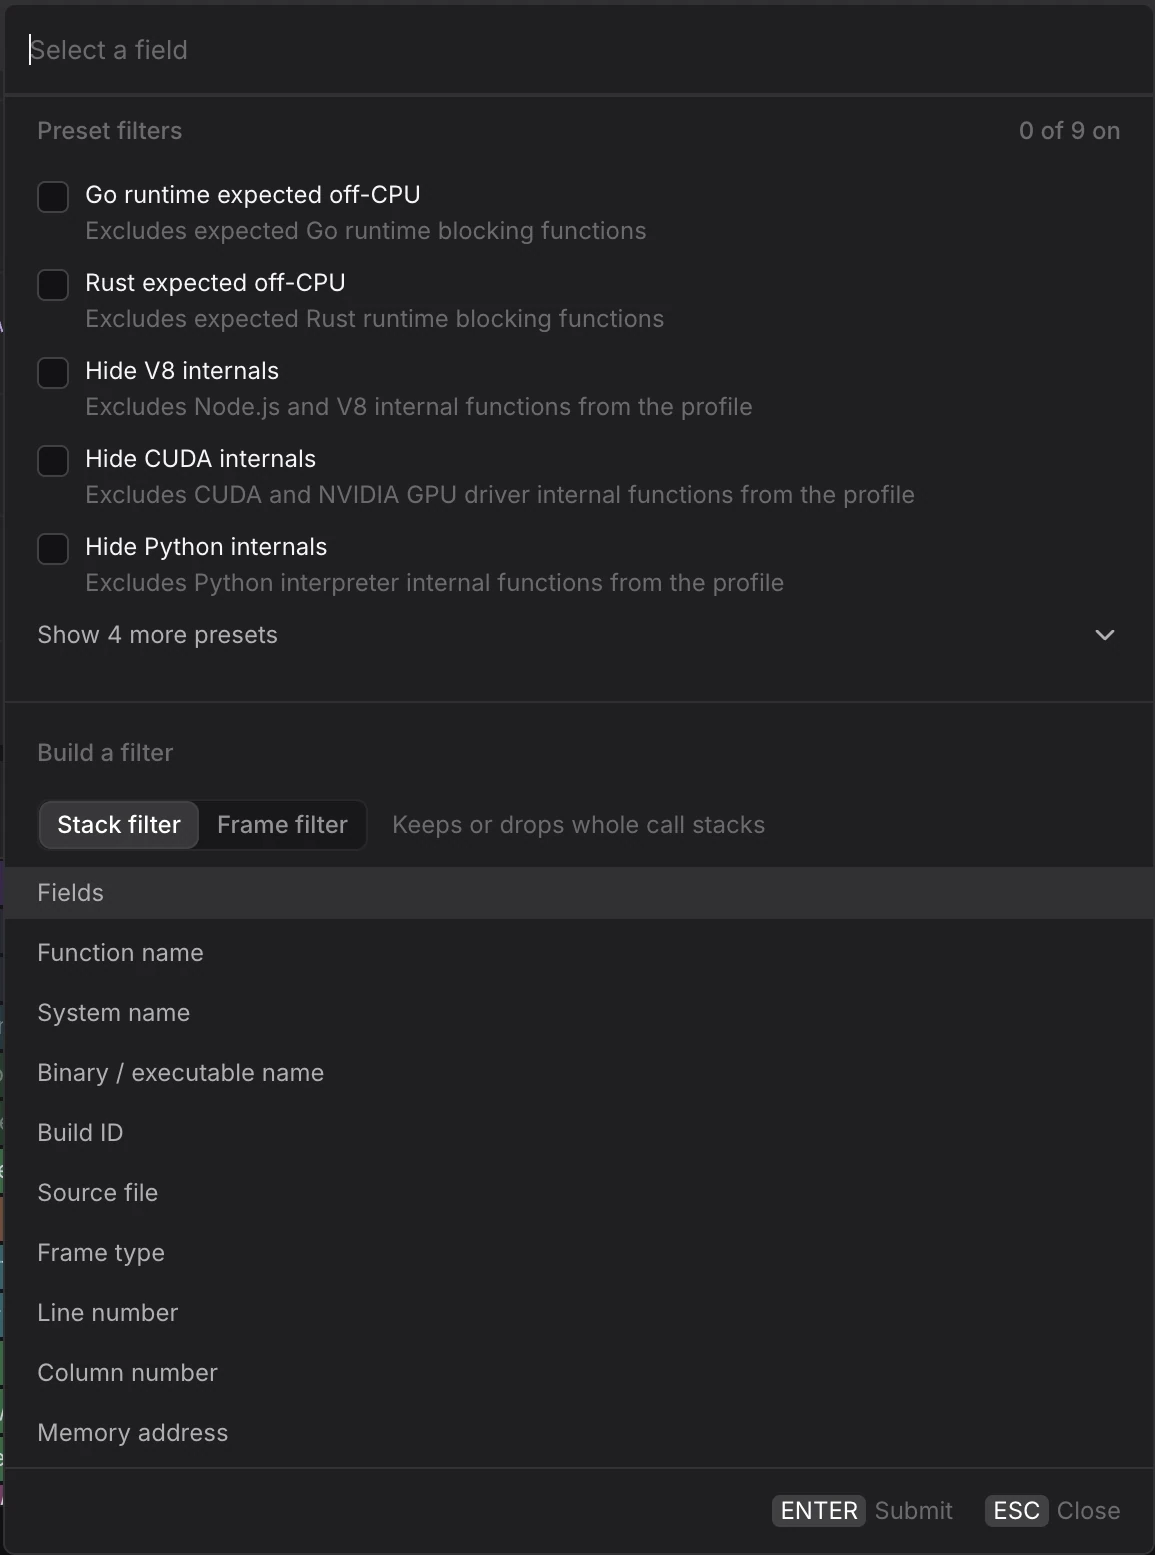
Choose the filter mode before choosing the field:
- Stack filter: Keep or drop whole call stacks. For example, keep stacks involving a function or binary to preserve their call context.
- Frame filter: Filter individual frames without discarding the whole stack.
The menu shows Function name, System name, Binary / executable name, Build ID, Source file, Frame type, Line number, Column number, and Memory address. Select a field and complete the condition in the filter editor. Available metadata depends on the profiler's output.
For example, use a stack filter on Source file that matches your repository's paths to reduce the view to your own code. Use a stack filter on Function name to focus on a compression path, or a frame filter to hide runtime internals.
To reuse filters, save them in a view with Save as. See Save an investigation view.
Code-view filters only change what you see. They do not change ingestion or delete stored profiles.
Use preset filters
The preset menu includes:
| Preset | Purpose shown in the menu |
|---|---|
| Go runtime expected off-CPU | Exclude expected Go runtime blocking functions. |
| Rust expected off-CPU | Exclude expected Rust runtime blocking functions. |
| Hide V8 internals | Exclude Node.js and V8 internal functions. |
| Hide CUDA internals | Exclude CUDA and NVIDIA GPU driver internal functions. |
| Hide Python internals | Exclude Python interpreter internal functions. |
Expand Show 4 more presets in the pictured menu for the remaining choices. Use presets for the runtime you are investigating. Disable them when you need to inspect the runtime code itself.
Further Reading
- About Profiling — Overview of the explorer controls.
- Analyze Flame Graphs — Combine filtering with call-stack analysis.
- Compare Profiles — Filter baseline and comparison workloads separately.
- Inspect Samples over Time — Group samples on a timeline.