
Last updated:
Analyze Flame Graphs
Select Flame Graph to inspect call paths for the selected profile type. See Key Concepts for how to read frame width and stack depth.
Read the call paths
In the original call-stack order, start at root and follow the frames toward the leaves. Wide branches account for more of the selected measurement.

Click a frame to expand it to the full width and focus the flame graph on its call paths. This makes narrow callees readable.
A wide parent can owe most of its Total to its callees. Switch to Table to distinguish Self from Total. Read frame width in the selected profile's units.
The same function can appear in different branches because it has different callers. Use Sandwich to investigate the callers and callees of a selected frame.
The flame graph is not a request timeline. Frames next to each other did not necessarily run one after another. Use Flame Chart when you need a time axis.
Start at the leaves
Use the call-stack order button immediately to the left of Settings to switch between the original and reversed call-stack order.
Reversed order puts leaf functions directly below root, so you can find large Self contributions across calling paths. Follow the frames away from a leaf to inspect its callers. This regroups stacks by their leaves rather than just flipping the drawing.

In the pictured reversed view, the button's tooltip is Original Call Stack. Use it to return to the original order.
To rank functions by their direct contribution, use the function table sorted by Self.
Focus on relevant code
Use Group by in the flame graph toolbar to separate samples by attributes before aggregating their call paths. For example, group by pod to see whether one pod runs different code from its replicas. This control is separate from Sum by, which splits the metrics chart.
Click Add filter to apply a Stack filter, Frame filter, or preset. Keep whole stacks to preserve a function's calling context. Filter individual frames to remove visual noise. See Filter and Group Profiles for the fields and presets.
Adjust display settings
Open Settings in the visualization toolbar.
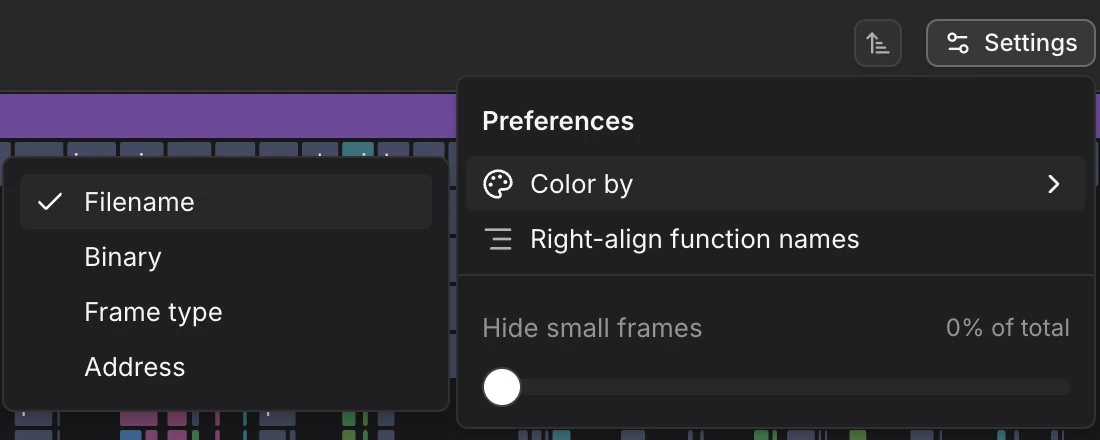
- Color by: Choose Filename, Binary, Frame type, or Address. These colors distinguish frame properties, not severity.
- Right-align function names: Show the end of a long name when the full name does not fit.
- Hide small frames: Set a percentage-of-total threshold to hide small frames. Set it to 0% to inspect small contributors.
Check the small-frame threshold if a function seems to be missing.
Further Reading
- About Profiling — Overview of all code views.
- Compare Profiles — Read differential flame graphs.
- Filter and Group Profiles — Narrow stacks and frames.
- Find Hot Functions in the Table — Inspect self and total contributions.
- Investigate Callers and Callees — Inspect relationships around one frame.