Last updated: July 14, 2026
About Synthetic Monitoring
Synthetic checks are automated, scripted tests that proactively verify the availability and performance of your websites and APIs. Rather than waiting for real users to encounter problems, they simulate requests to your endpoints at regular intervals so issues get caught early.
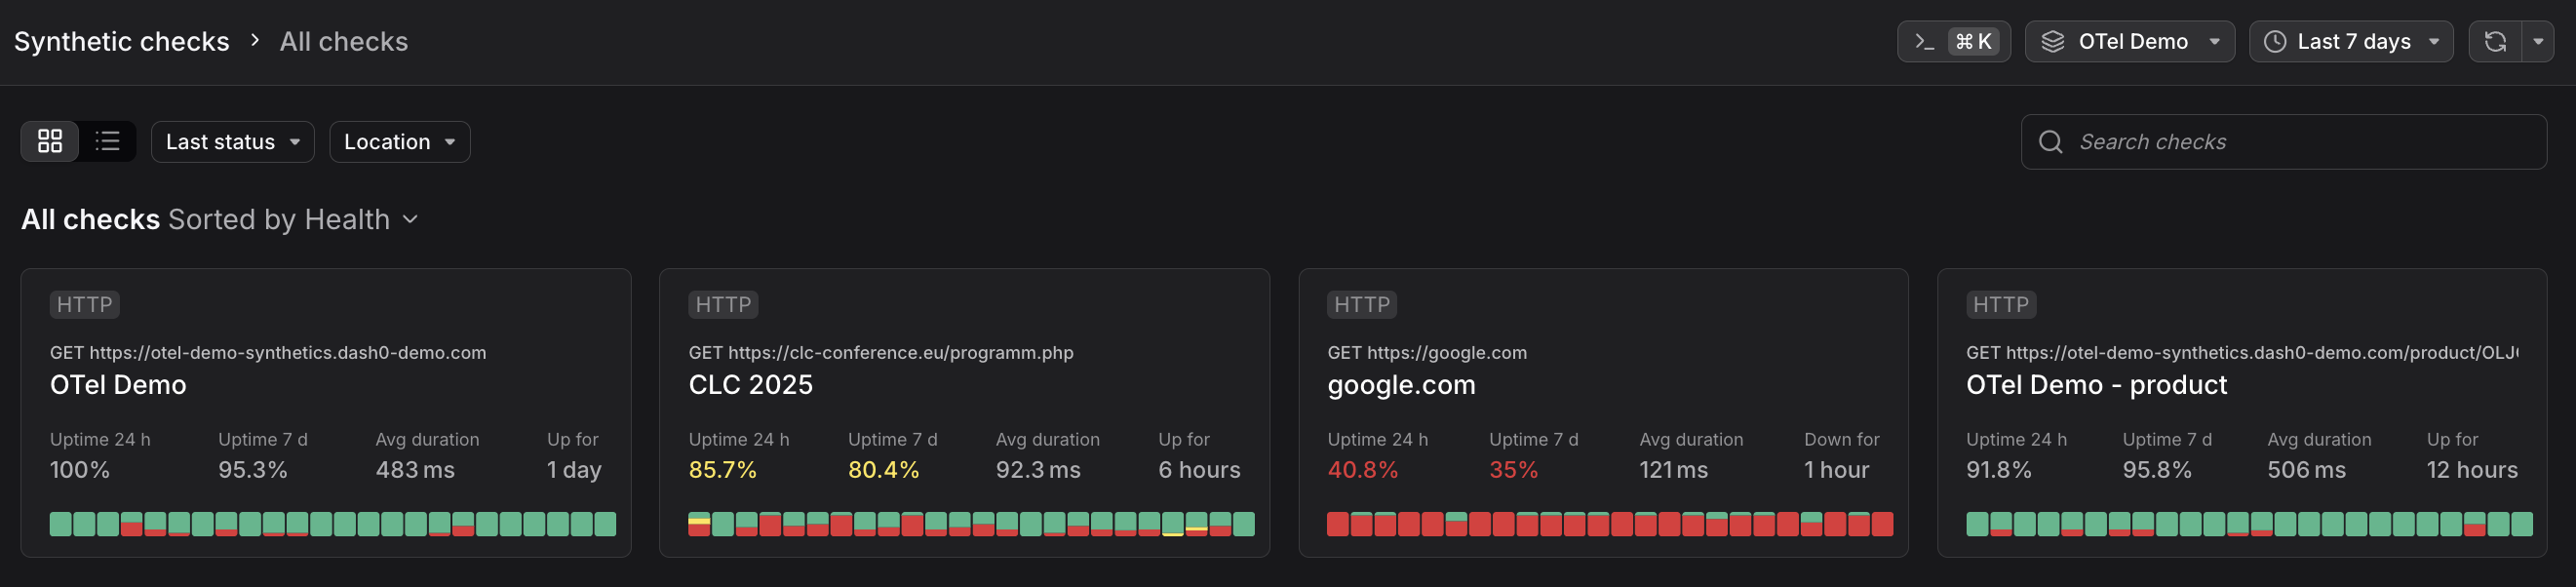
The Synthetic Checks View gives you insights into the availability and performance of your websites and APIs. By running synthetic checks at regular intervals from multiple global locations, Dash0 helps to ensure that outages, latency spikes, and functional regressions are caught before they affect real users.
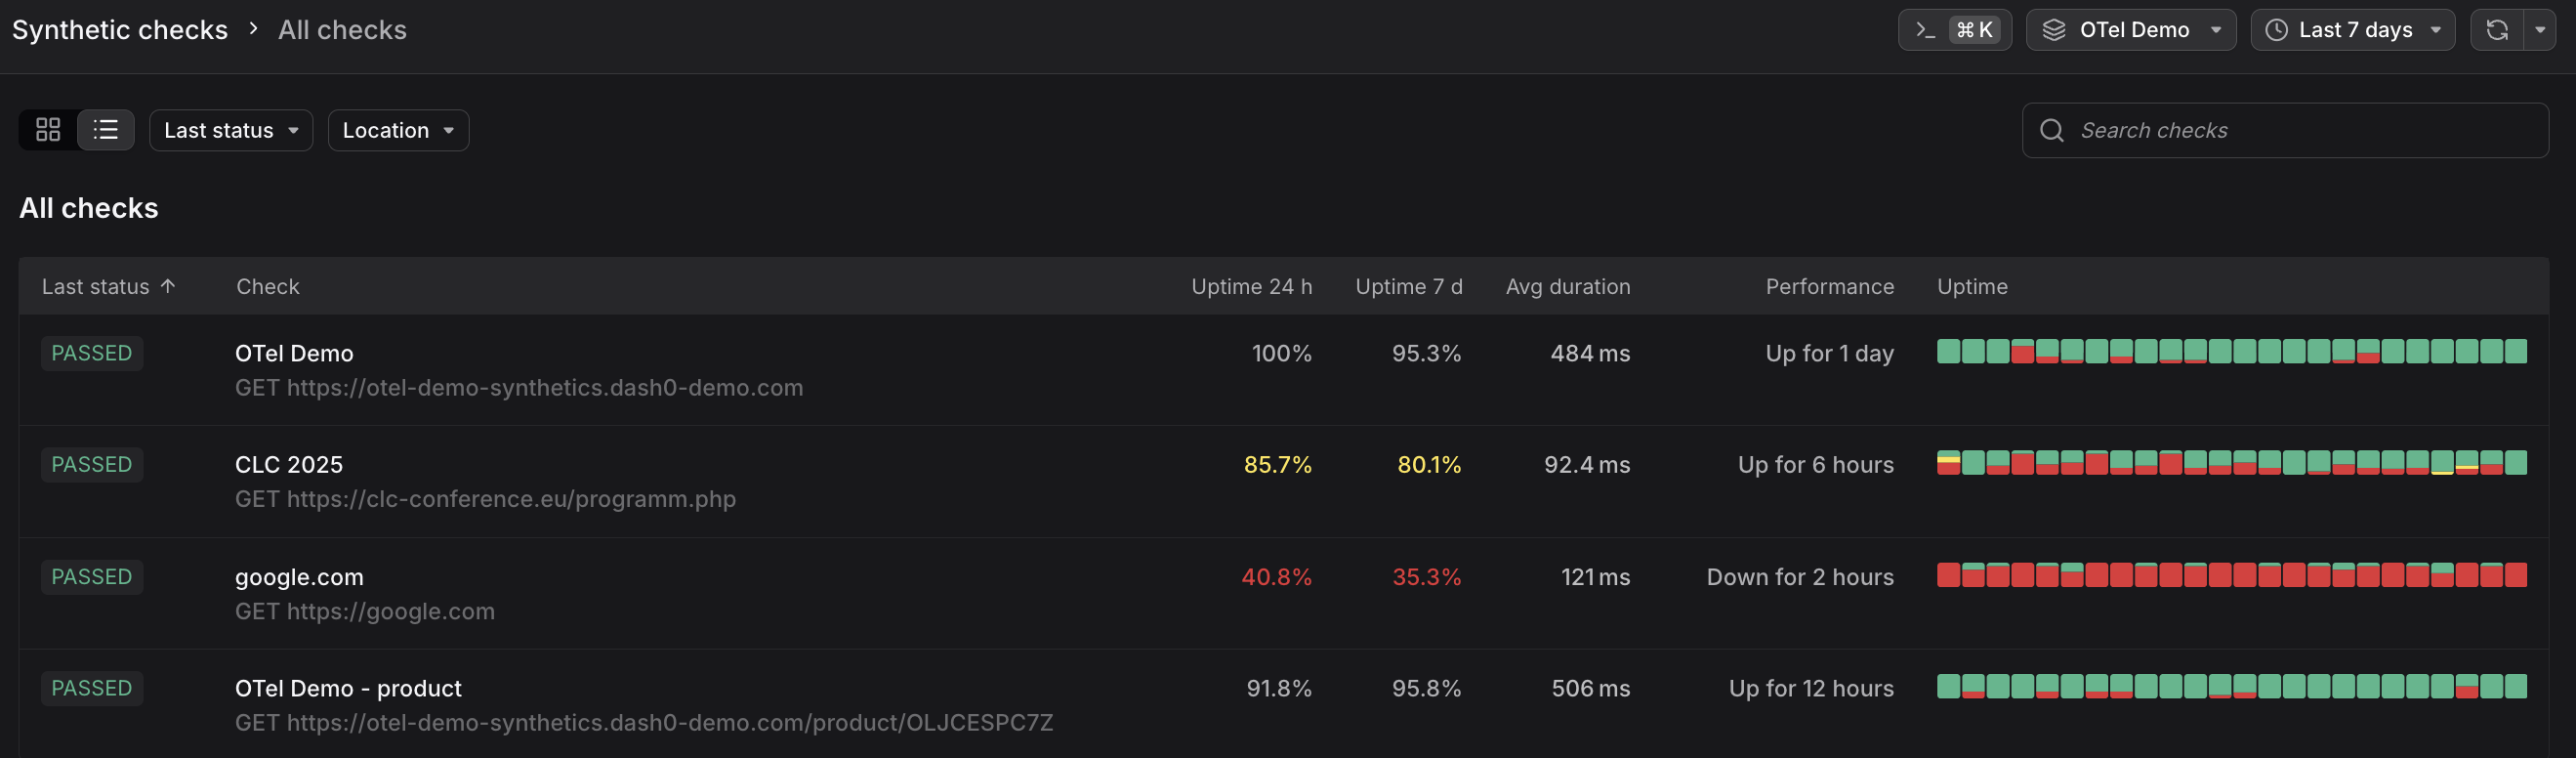
Alternatively, switch from grid to table view, and note that you can also switch the status and location settings:
The visualizations provide high-level overviews of uptime and response times, while detailed run data and error analysis help you quickly isolate root causes.
With synthetic monitoring, you can do the following:
- Run availability and performance checks on HTTP endpoints
- Collect latency, status code, and error on every run
- Execute tests from multiple global regions
- Provide historical trends and failure drill-downs
- Trigger alerts via Dash0's alerting system
Similar But Different: Synthetic Checks and Check Rules
Understand the difference between proactive endpoint testing and metric-based alerting.
Synthetic checks and check rules serve different purposes:
-
Synthetic checks actively test your HTTP endpoints from multiple global locations by making real requests at regular intervals. Each check validates a specific endpoint's availability, response time, and correctness through assertions. Notifications fire automatically when any assertion fails.
-
Check rules monitor aggregated telemetry data (metrics, logs, spans) using PromQL queries. They evaluate data against thresholds and fire when conditions are met across your entire system.
You can combine both: synthetic checks generate metrics (dash0.synthetic_check.*) that check rules can query.
For example, create a synthetic check to test your API endpoint every minute, then create a check rule to notify you if the aggregated P95 latency across all synthetic check locations exceeds 500ms for 5 consecutive minutes.