
Last updated: October 11, 2026
Explore Synthetic Checks
A Synthetic Check in Dash0 defines the rules for monitoring an endpoint or workflow.
Checks combine a target, assertions, and scheduling to continuously validate the availability and performance of your system.
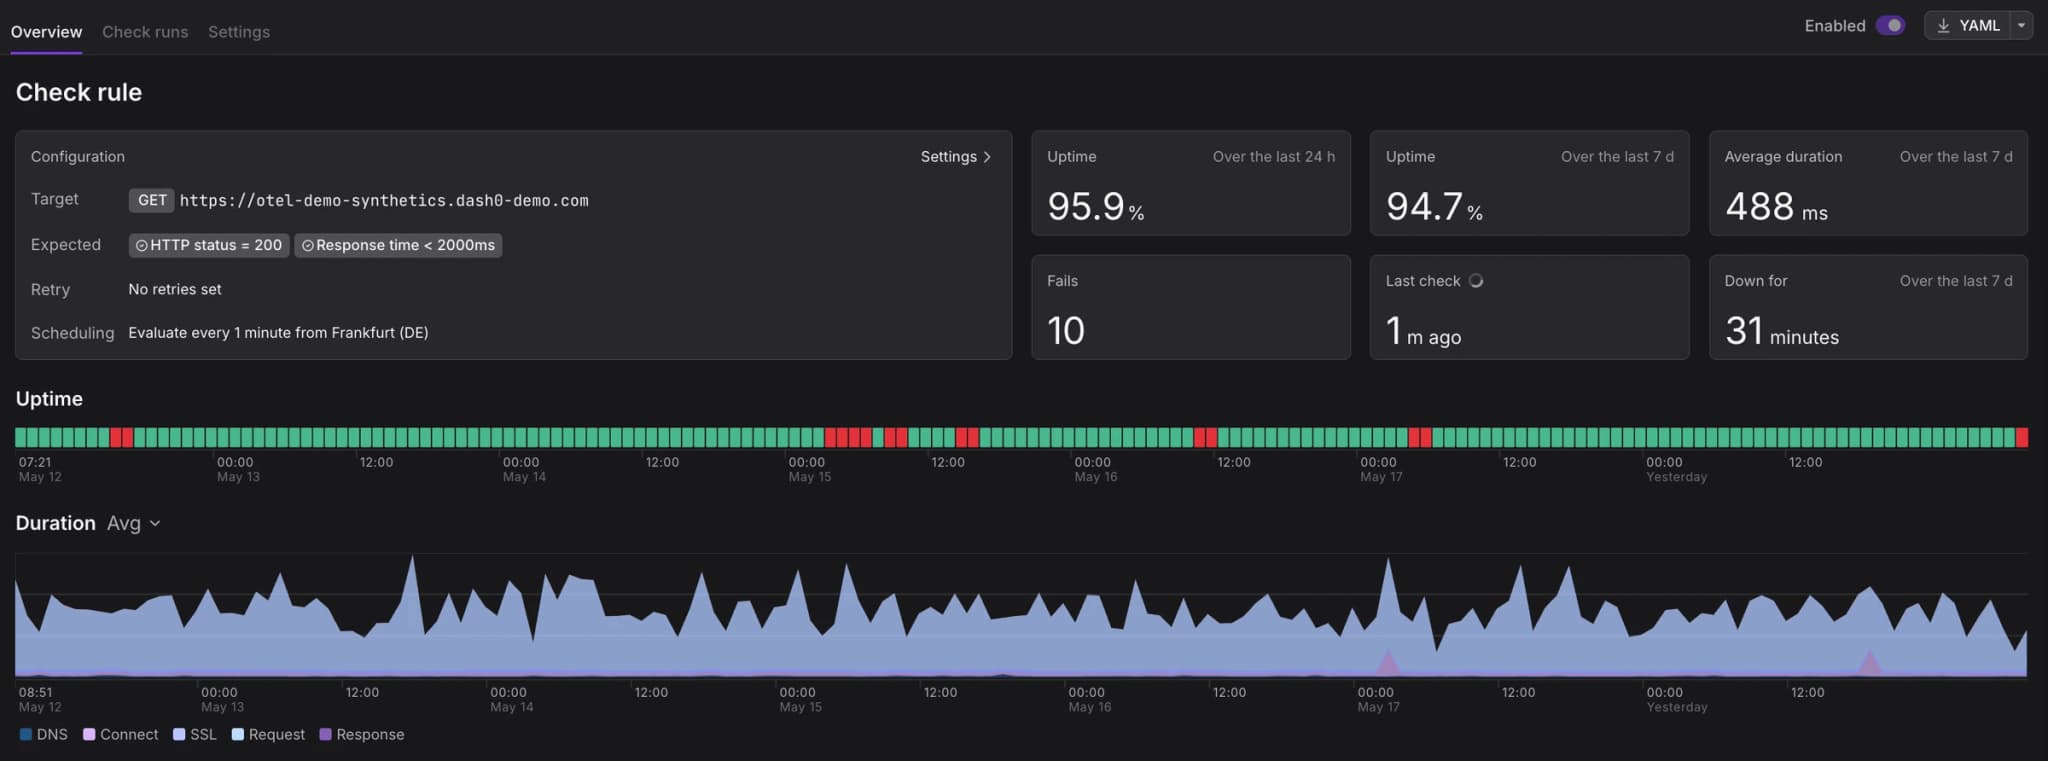
Each check includes the following elements:
Configuration
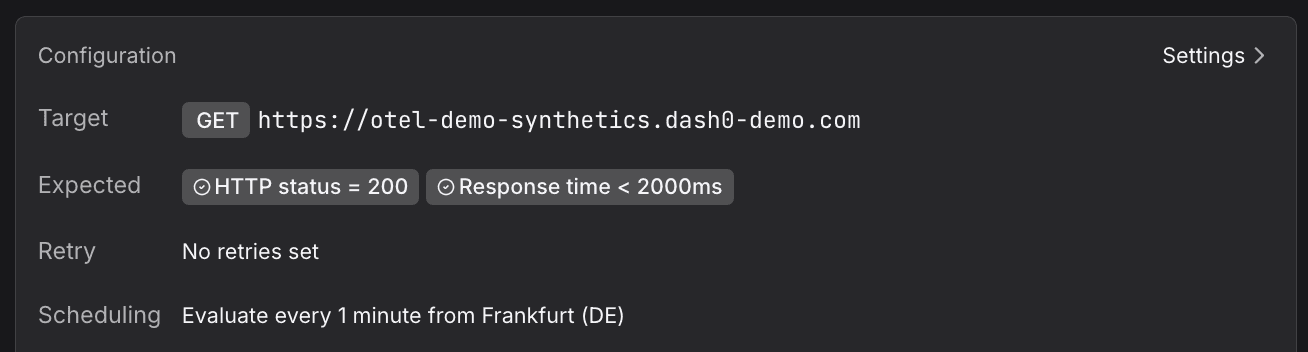
Each check is composed of several key configuration elements that control its behavior.
Target
The endpoint under test. For HTTP checks this includes the method (GET, POST, etc.) and full URL.
Example: GET https://app.dash0.com
Expected
Assertion conditions that must hold true for the check to be considered successful. Typical assertions include:
- HTTP status = 200
- Timing response < 5000ms
- Timing response < 2000ms
Assertions can be critical (hard failures) or degraded (warnings).
Retry
The retry policy for transient failures.
If retries are not set, the first failure marks the run as failed.
Scheduling
Defines how often and from which locations the check runs. Select public regions to measure performance globally, or private locations to reach internal endpoints.
Example: Every 1 minute from Brussels (BE) and Melbourne (AU).
Supported locations:
| Location ID | Region |
|---|---|
be-brussels | Brussels (BE) |
uk-london | London (UK) |
de-frankfurt | Frankfurt (DE) |
us-oregon | Oregon (US) |
us-north-virginia | North Virginia (US) |
au-melbourne | Melbourne (AU) |
Status Indicators
Track key metrics that summarize check health and performance.
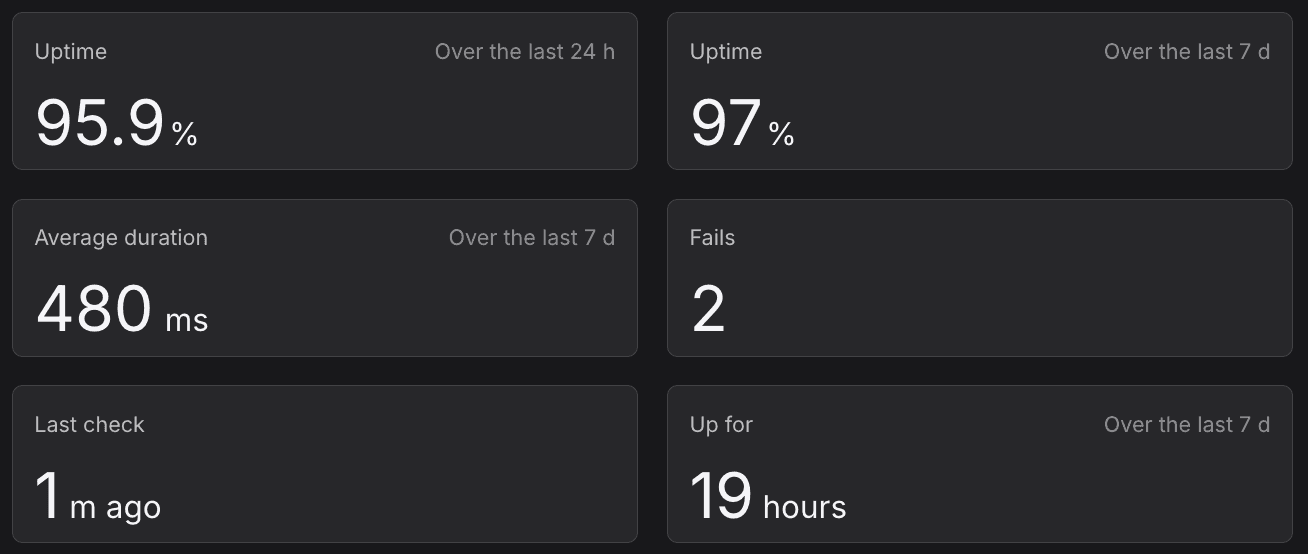
The check overview shows:
- Uptime over the selected time window (e.g., 7 days).
- Average Duration (latency across successful runs).
- Last Check (time since last execution).
- Up for (continuous uptime streak).
Uptime Bar
Visualize check success and failure patterns over time at a glance.

The uptime bar shows a pass/fail result for each run over time. A green segment indicates success, while red segments indicate failed assertions. This gives an immediate sense of stability and outage windows.
Duration Breakdown
Identify where time is spent during each check execution to diagnose latency issues.

The duration graph decomposes the total request time into its network phases:
- DNS: Time to resolve hostname
- Connect: TCP connection setup time
- SSL: TLS handshake duration
- Request: Time to first byte (TTFB)
- Response: Response body transfer time
This breakdown highlights bottlenecks (e.g., high SSL times due to certificate negotiation, or slow backend response times).