
Last updated: October 11, 2026
Explore Run Details
The Check Run Detail view provides a breakdown of all relevant information.
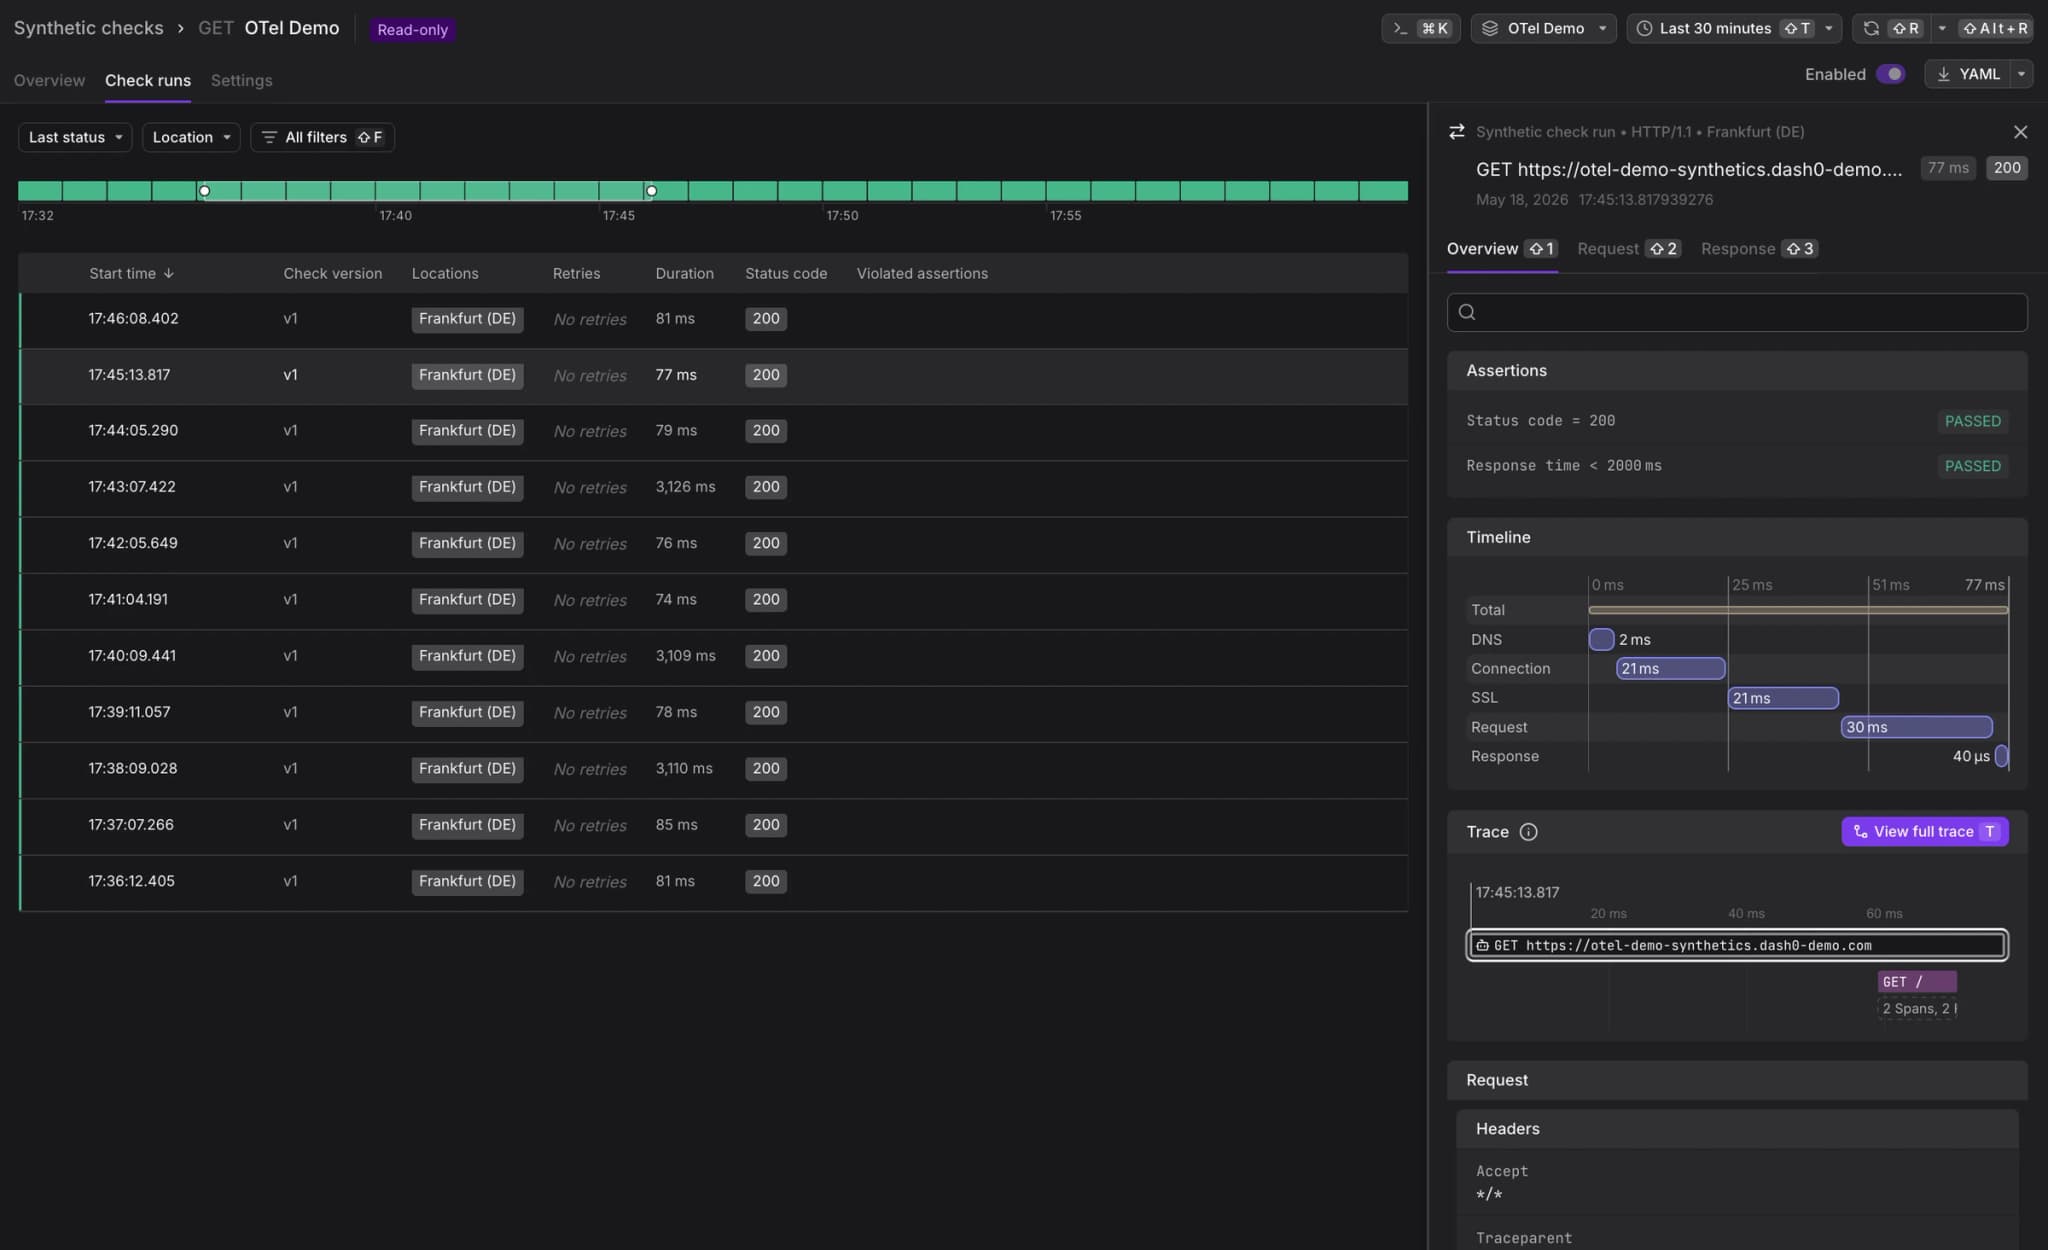
Assertions
Review which assertions passed, degraded, or failed for this specific check run.
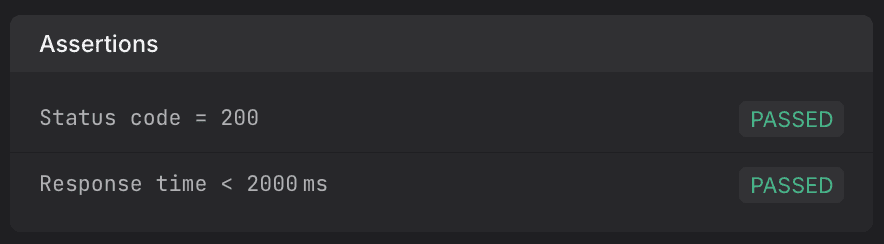
Assertions show the configured conditions for the check (e.g., status code = 200, response time < 300 ms).
Each assertion is marked as:
- PASSED: The condition of the assertion was met.
- DEGRADED: The latency exceeded the degraded threshold, but not the failed threshold. (The only assertion that can be degraded is the latency one.)
- FAILED: The condition of the assertion was not met.
If a check run has more than one non-passed assertion, the outcome of the run is failed.
Timeline
See a waterfall breakdown of each network phase to pinpoint latency bottlenecks.
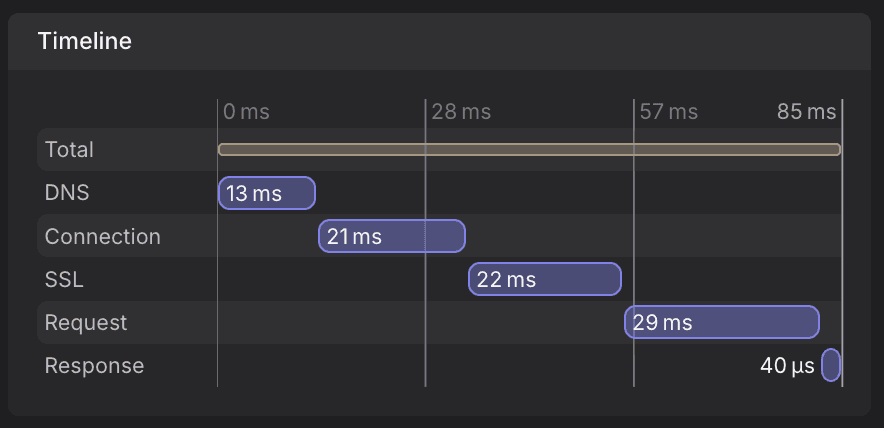
Displays a waterfall visualization of how the latency of the HTTP request breaks down:
- DNS resolution
- TCP connection establishment
- SSL/TLS handshake
- Request send time
- Response wait time (time to first byte)
- Download of the response
Request Details
Inspect the exact request sent by the synthetic check, including headers and payload.
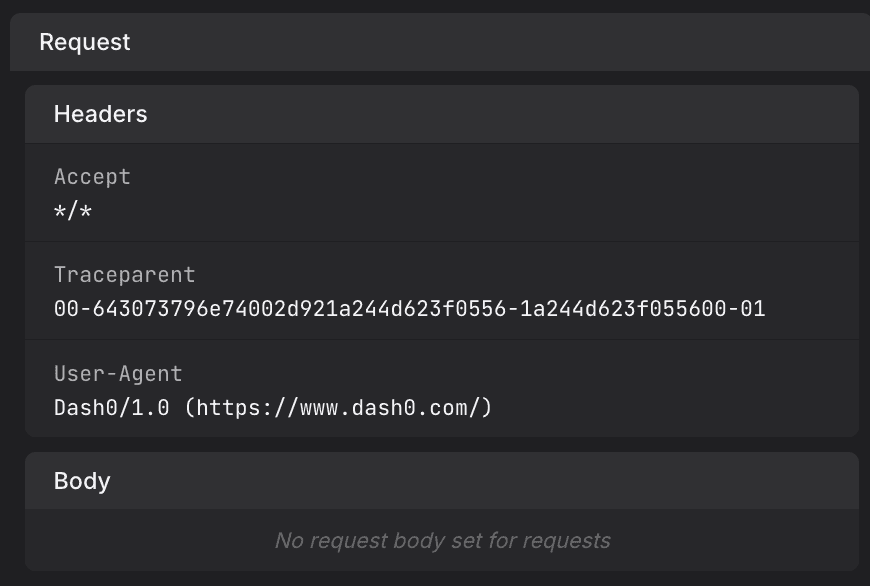
- Headers: Lists all request headers sent (e.g., User-Agent, Accept, Authorization).
- Method & URL: The exact HTTP method and endpoint being tested.
- Payload: For POST and PUT requests, the body content is available for inspection.
Response Details
View the full response received from the target endpoint, including status, headers, and body.
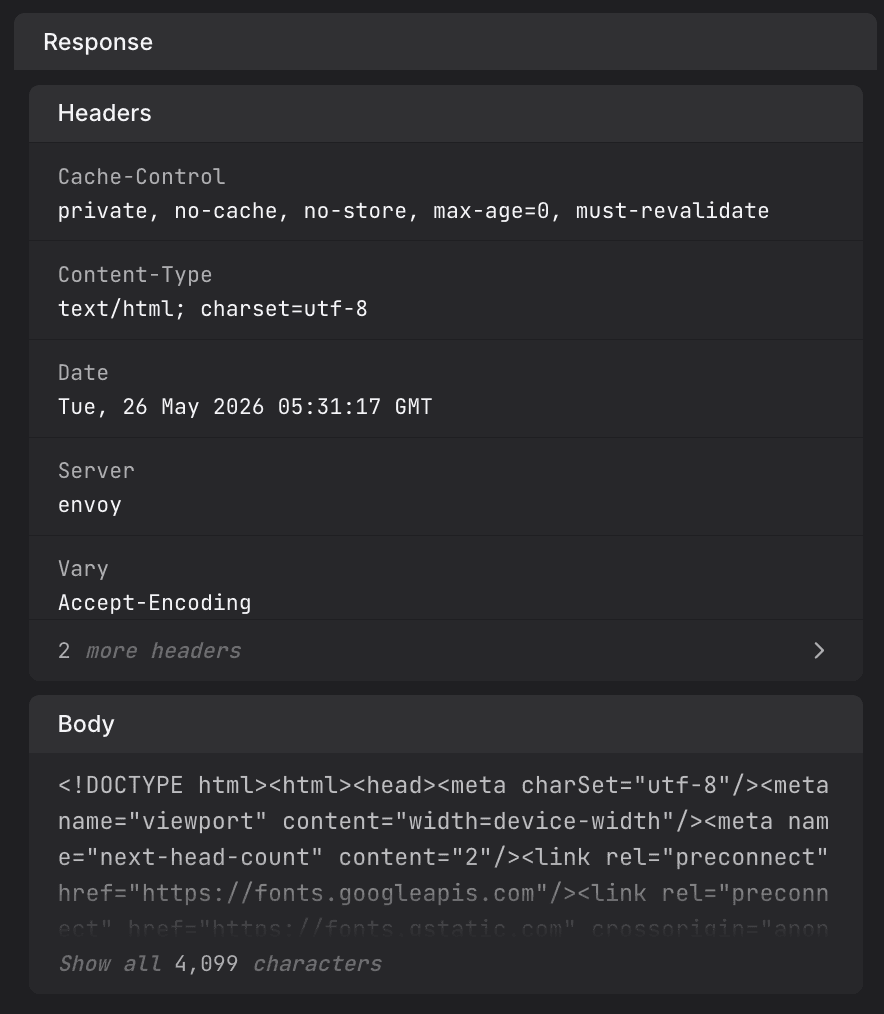
- Status code: Returned by the server (e.g., 200, 500).
- Headers: Key response headers like
cache-control,server, andcontent-type. - Body: The raw payload returned, where available.
Error Information
When a check fails, view structured error details to diagnose the root cause.
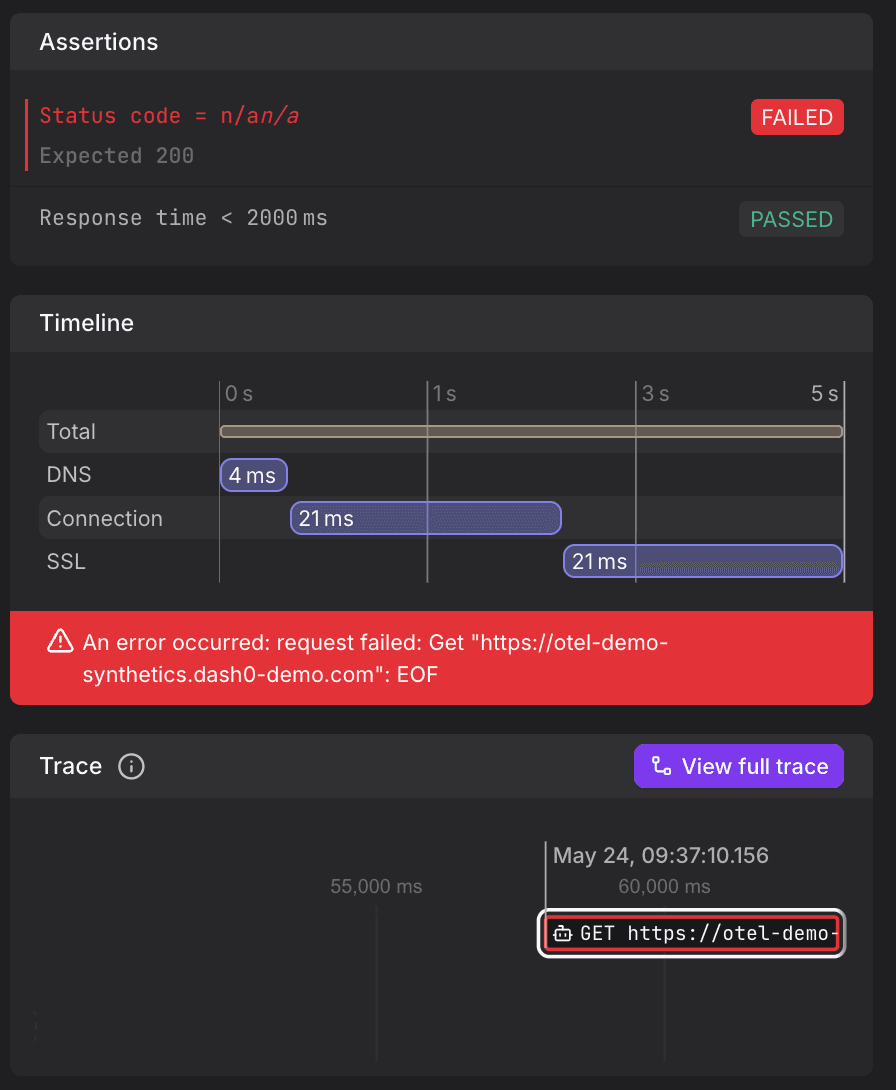
If the check fails, error attributes like error.type and error.message are displayed, which highlight network errors like timeout or TLS errors, or application-level failures (e.g., the response has HTTP status code 500).
Correlation with Backend Spans
Follow synthetic requests through your backend services using distributed tracing.
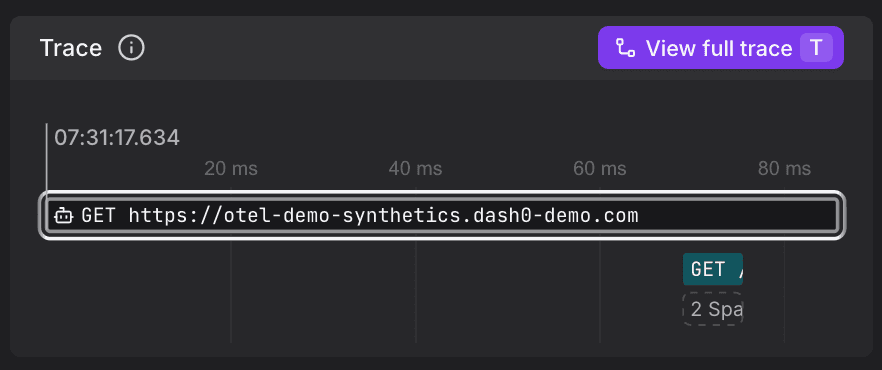
Synthetic Monitoring runs are automatically linked to backend telemetry via Dash0's tracing system. Each synthetic request generates spans that can be correlated with downstream service spans.
This allows you to, among other things:
- Filter all spans originating from Synthetic Checks by using
dash0.trace.origin.type = SYNTHETIC_CHECK.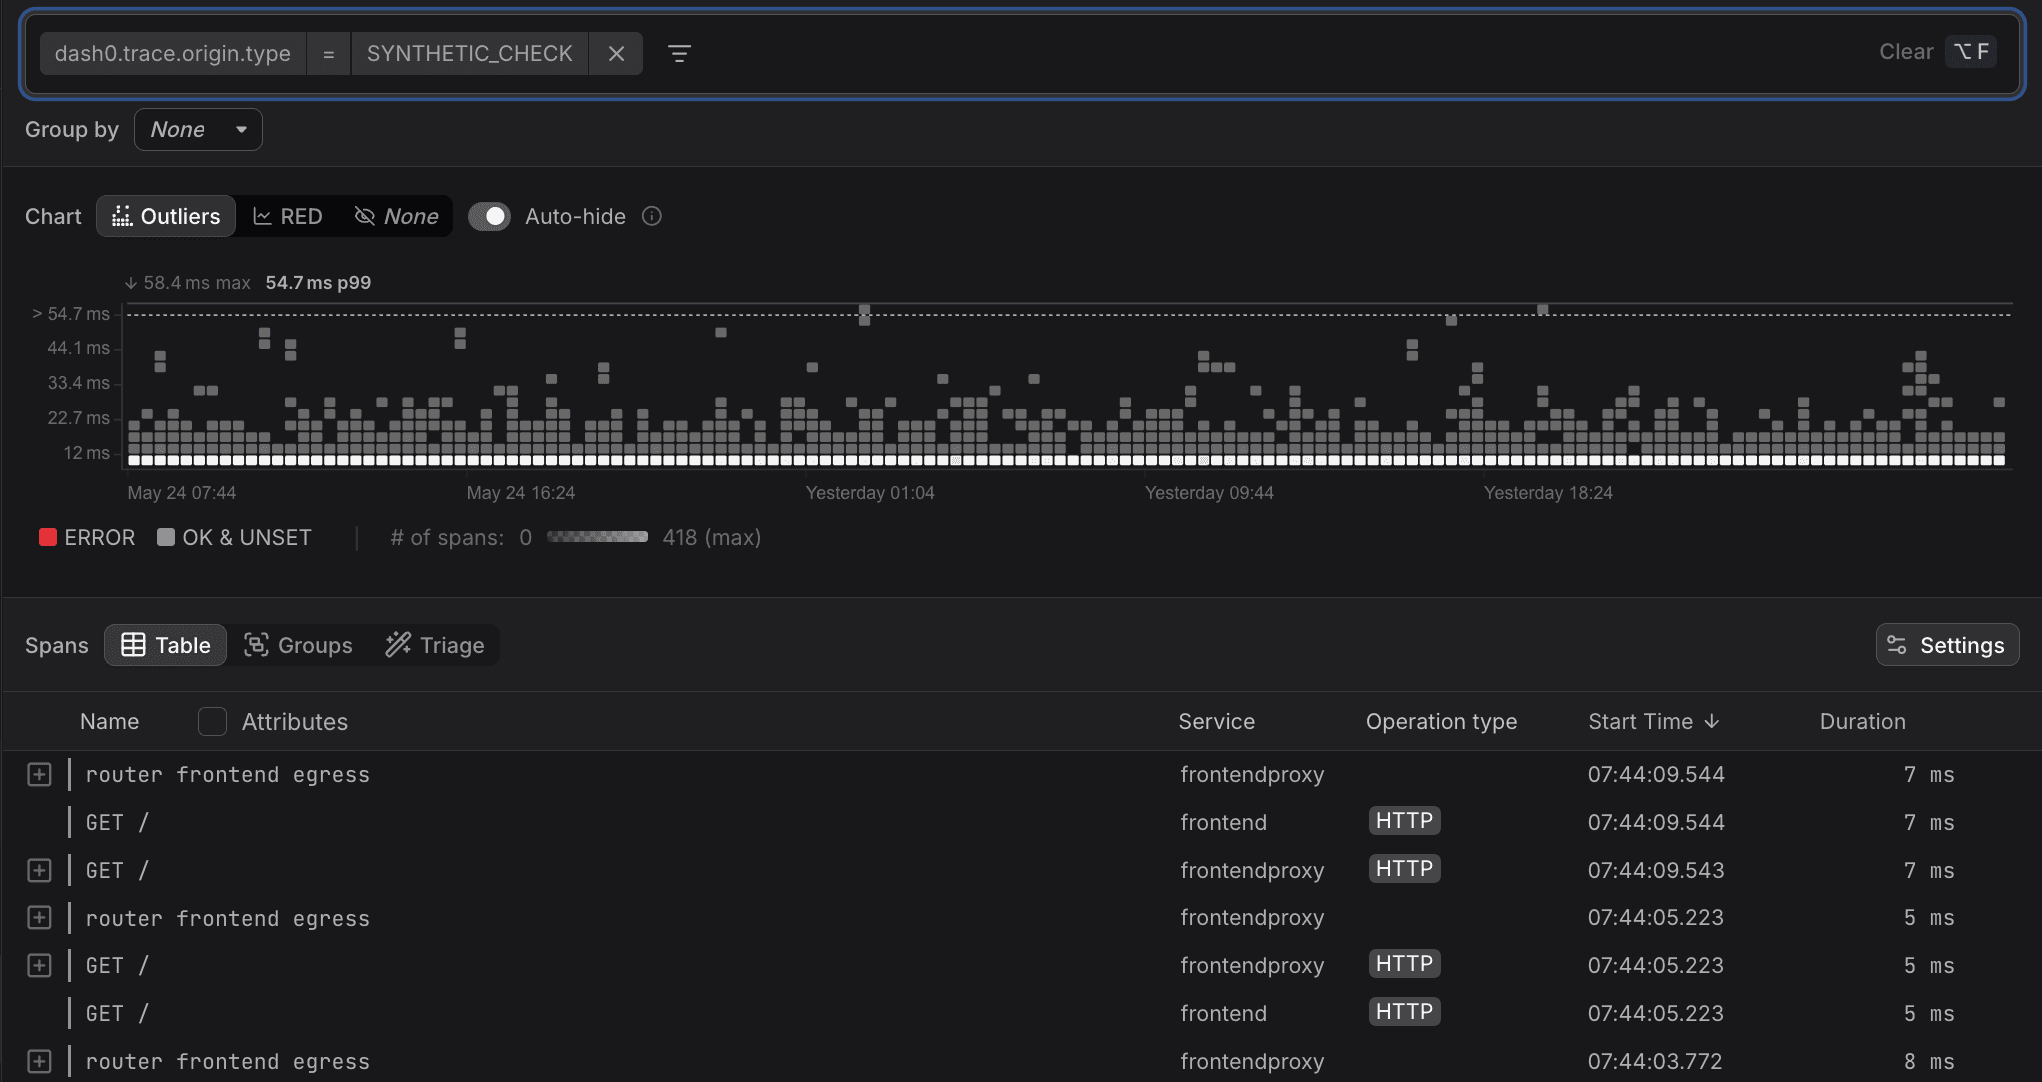
- View end-to-end traces: from the synthetic probe through the API gateway, into backend services, and down to database queries, by clicking View full trace above.
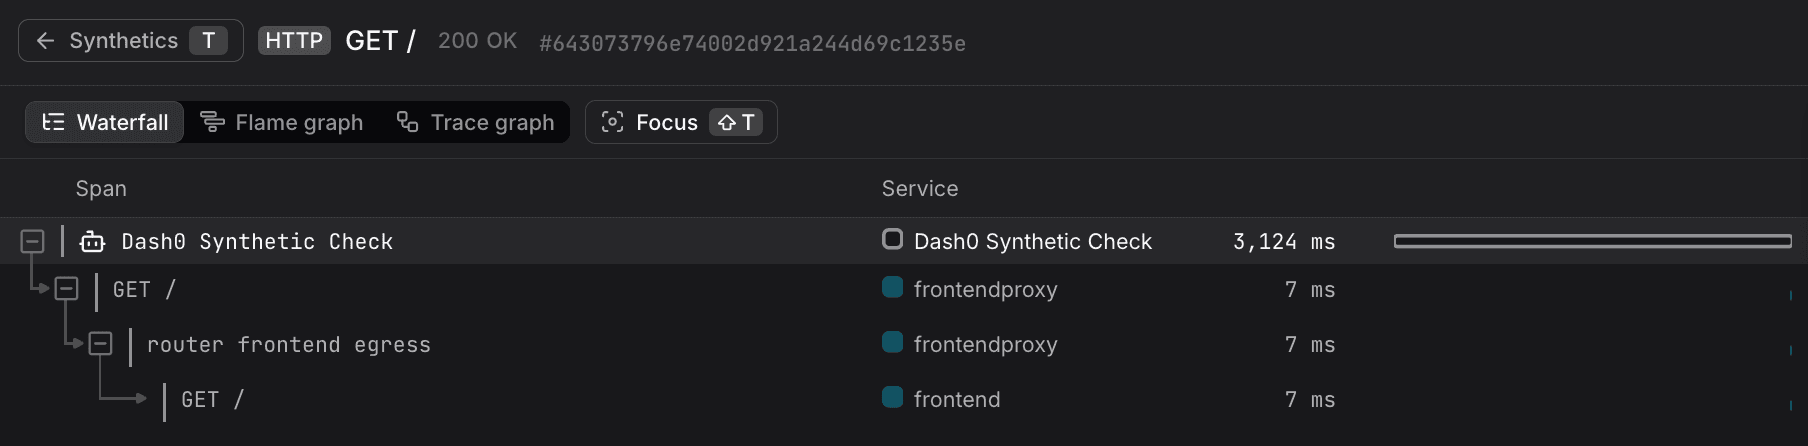
- Determine whether slowness comes from the network, the API layer, or a specific backend dependency.