Last updated: May 31, 2026
Integrated Experience
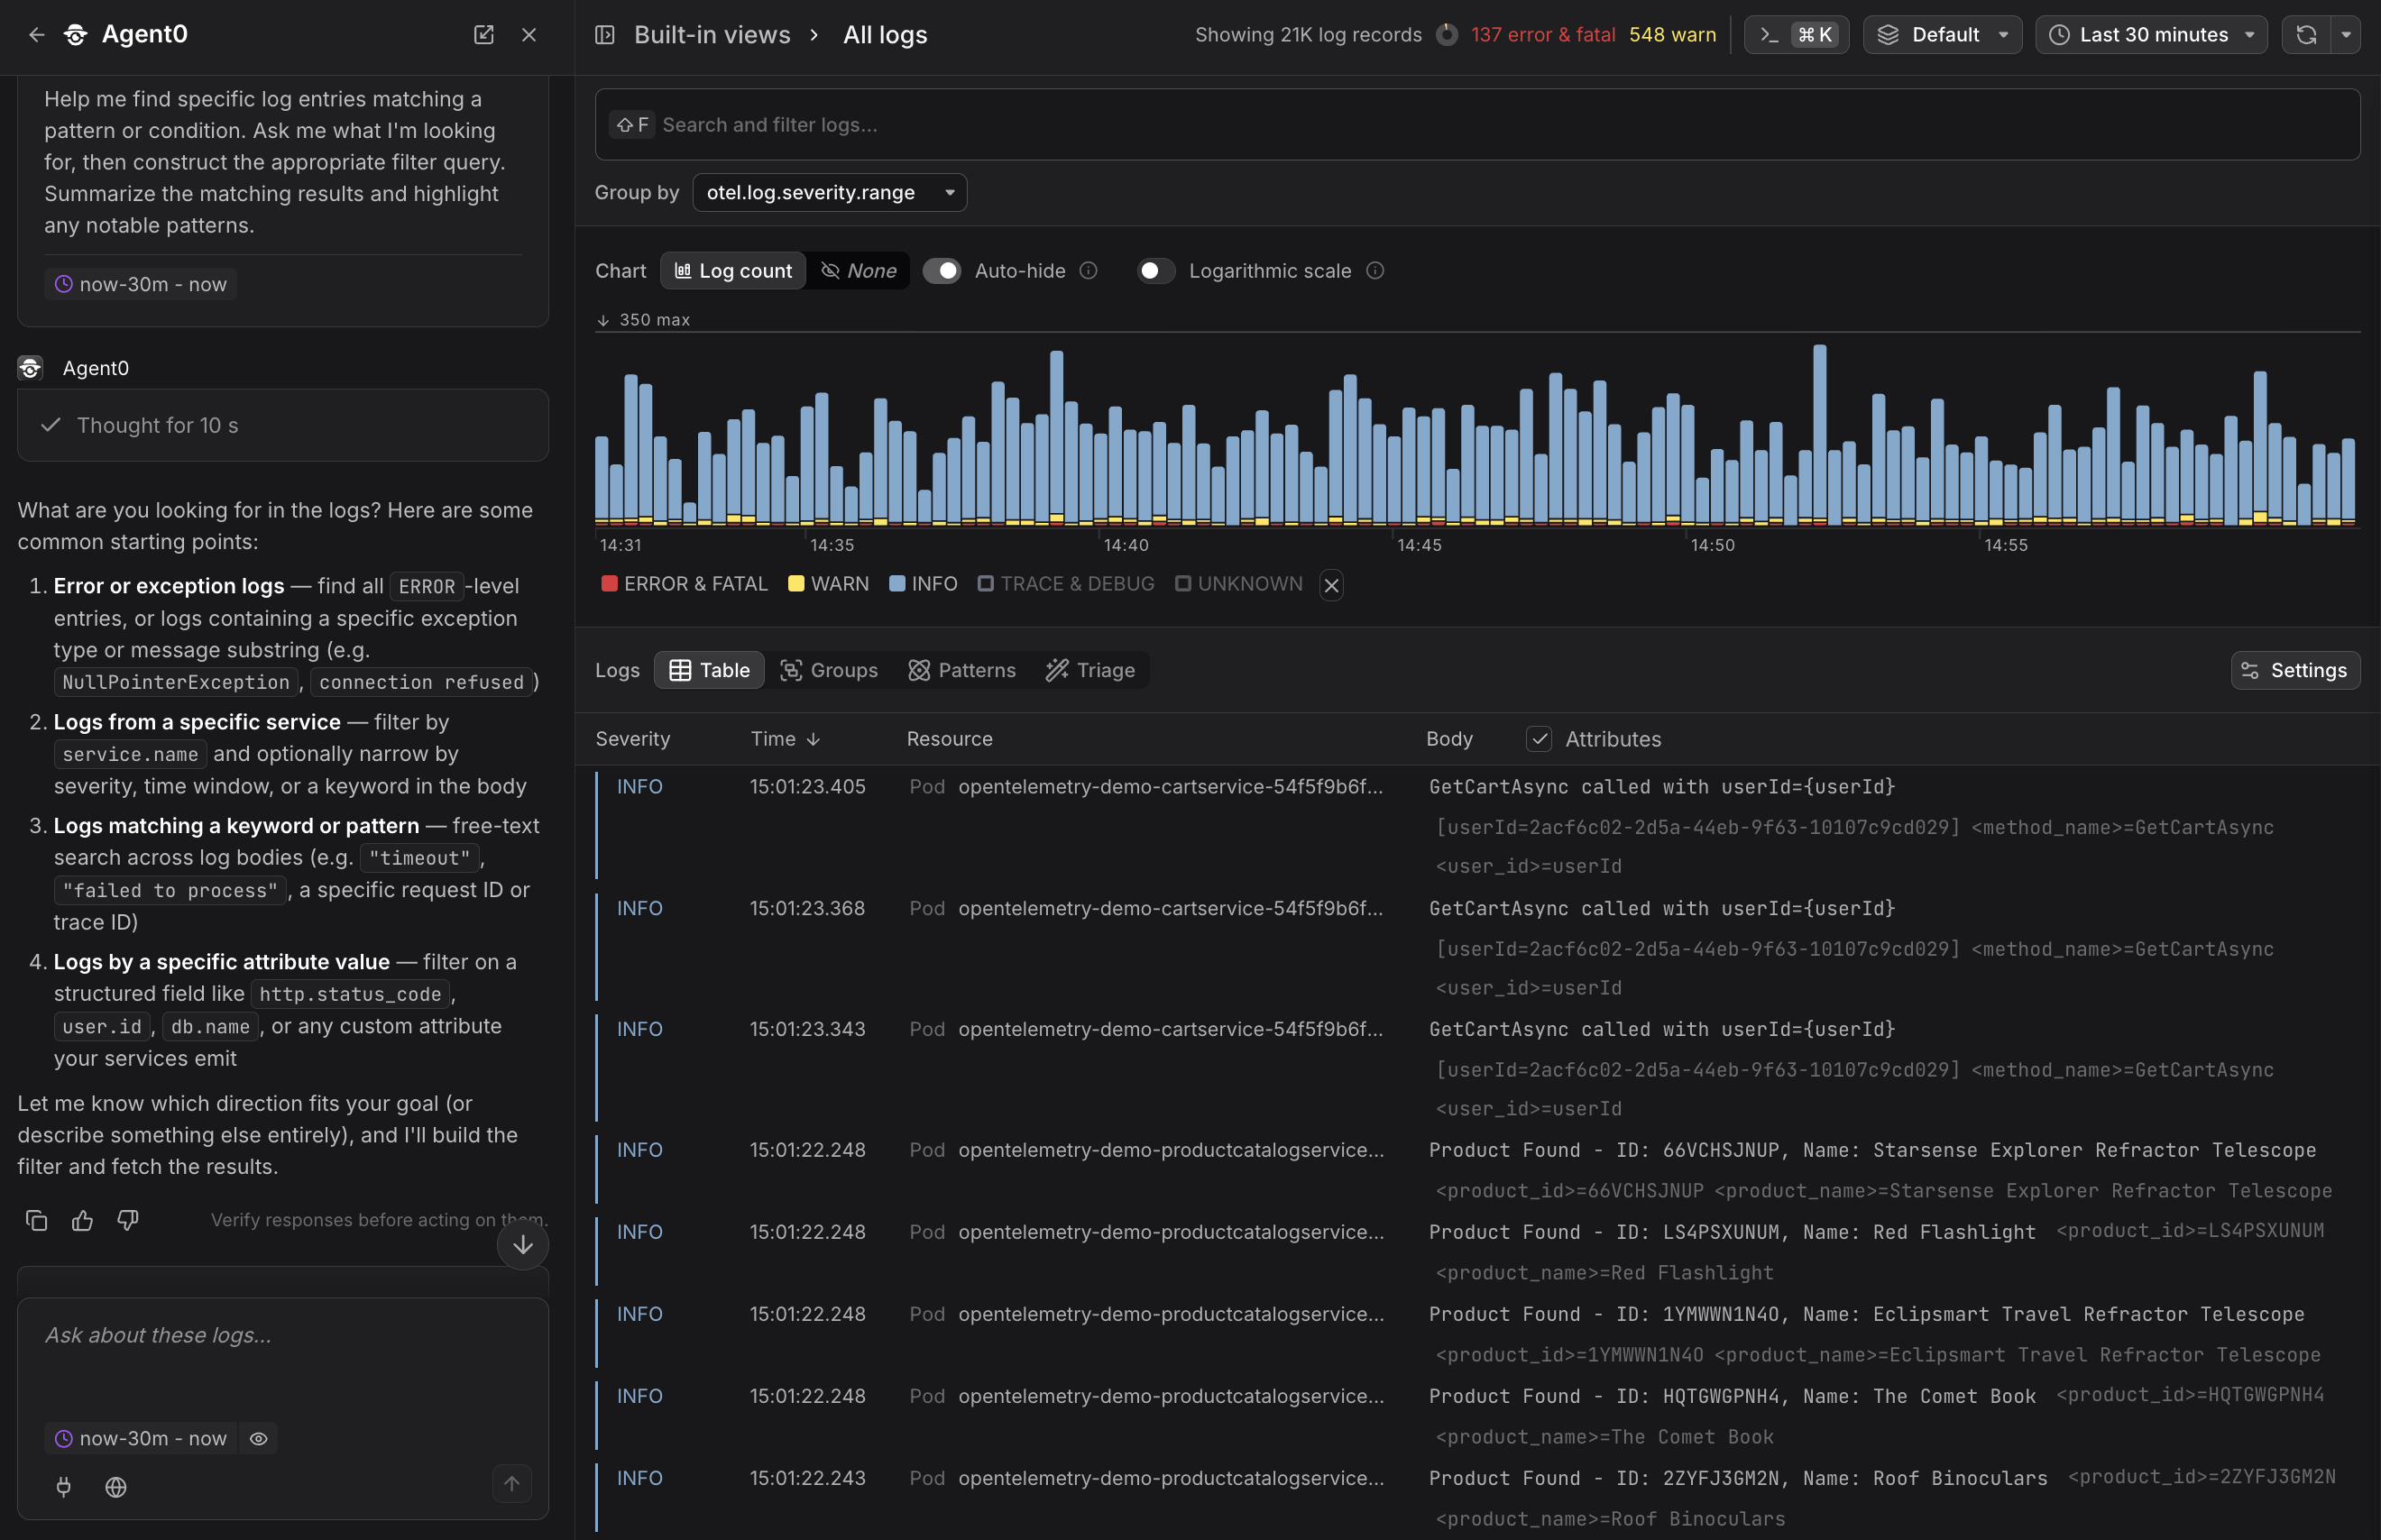
Agent0 appears contextually throughout Dash0, with prompts that adapt to what you're viewing. Agent0 is present on every relevant page of Dash0. The prompts you see change based on what you are looking at: a selected span, a failed check, a metric, a dashboard panel, a log row.
Three types of prompts
-
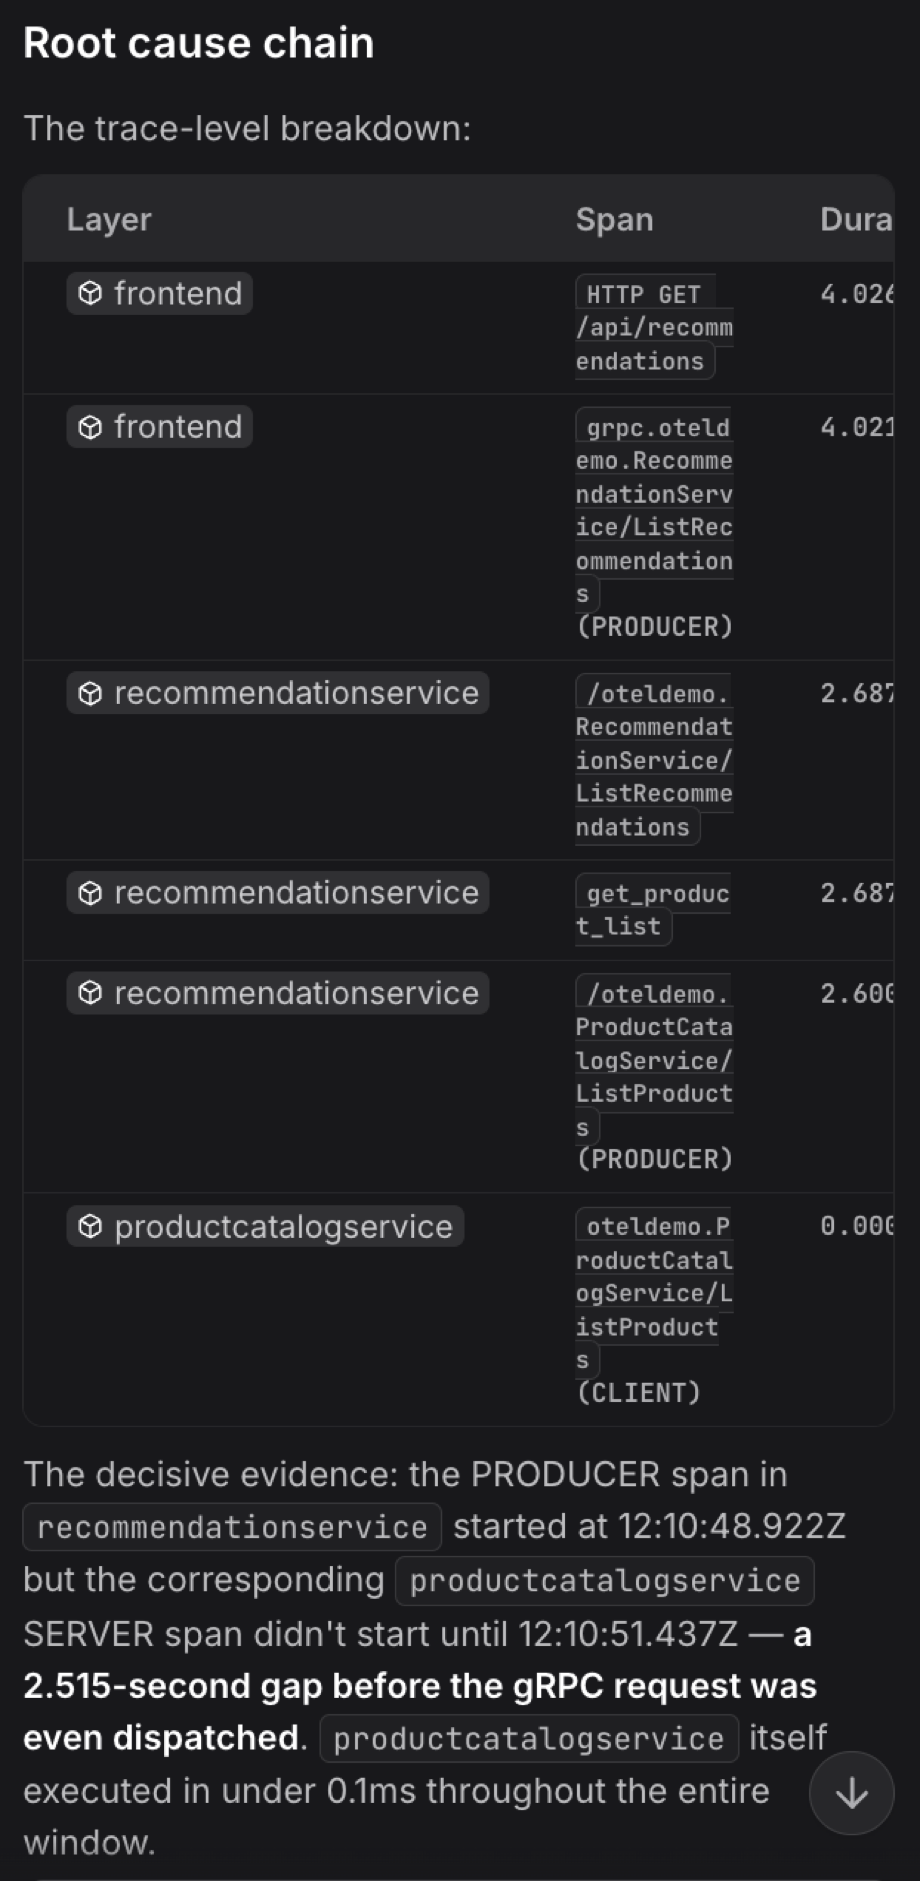
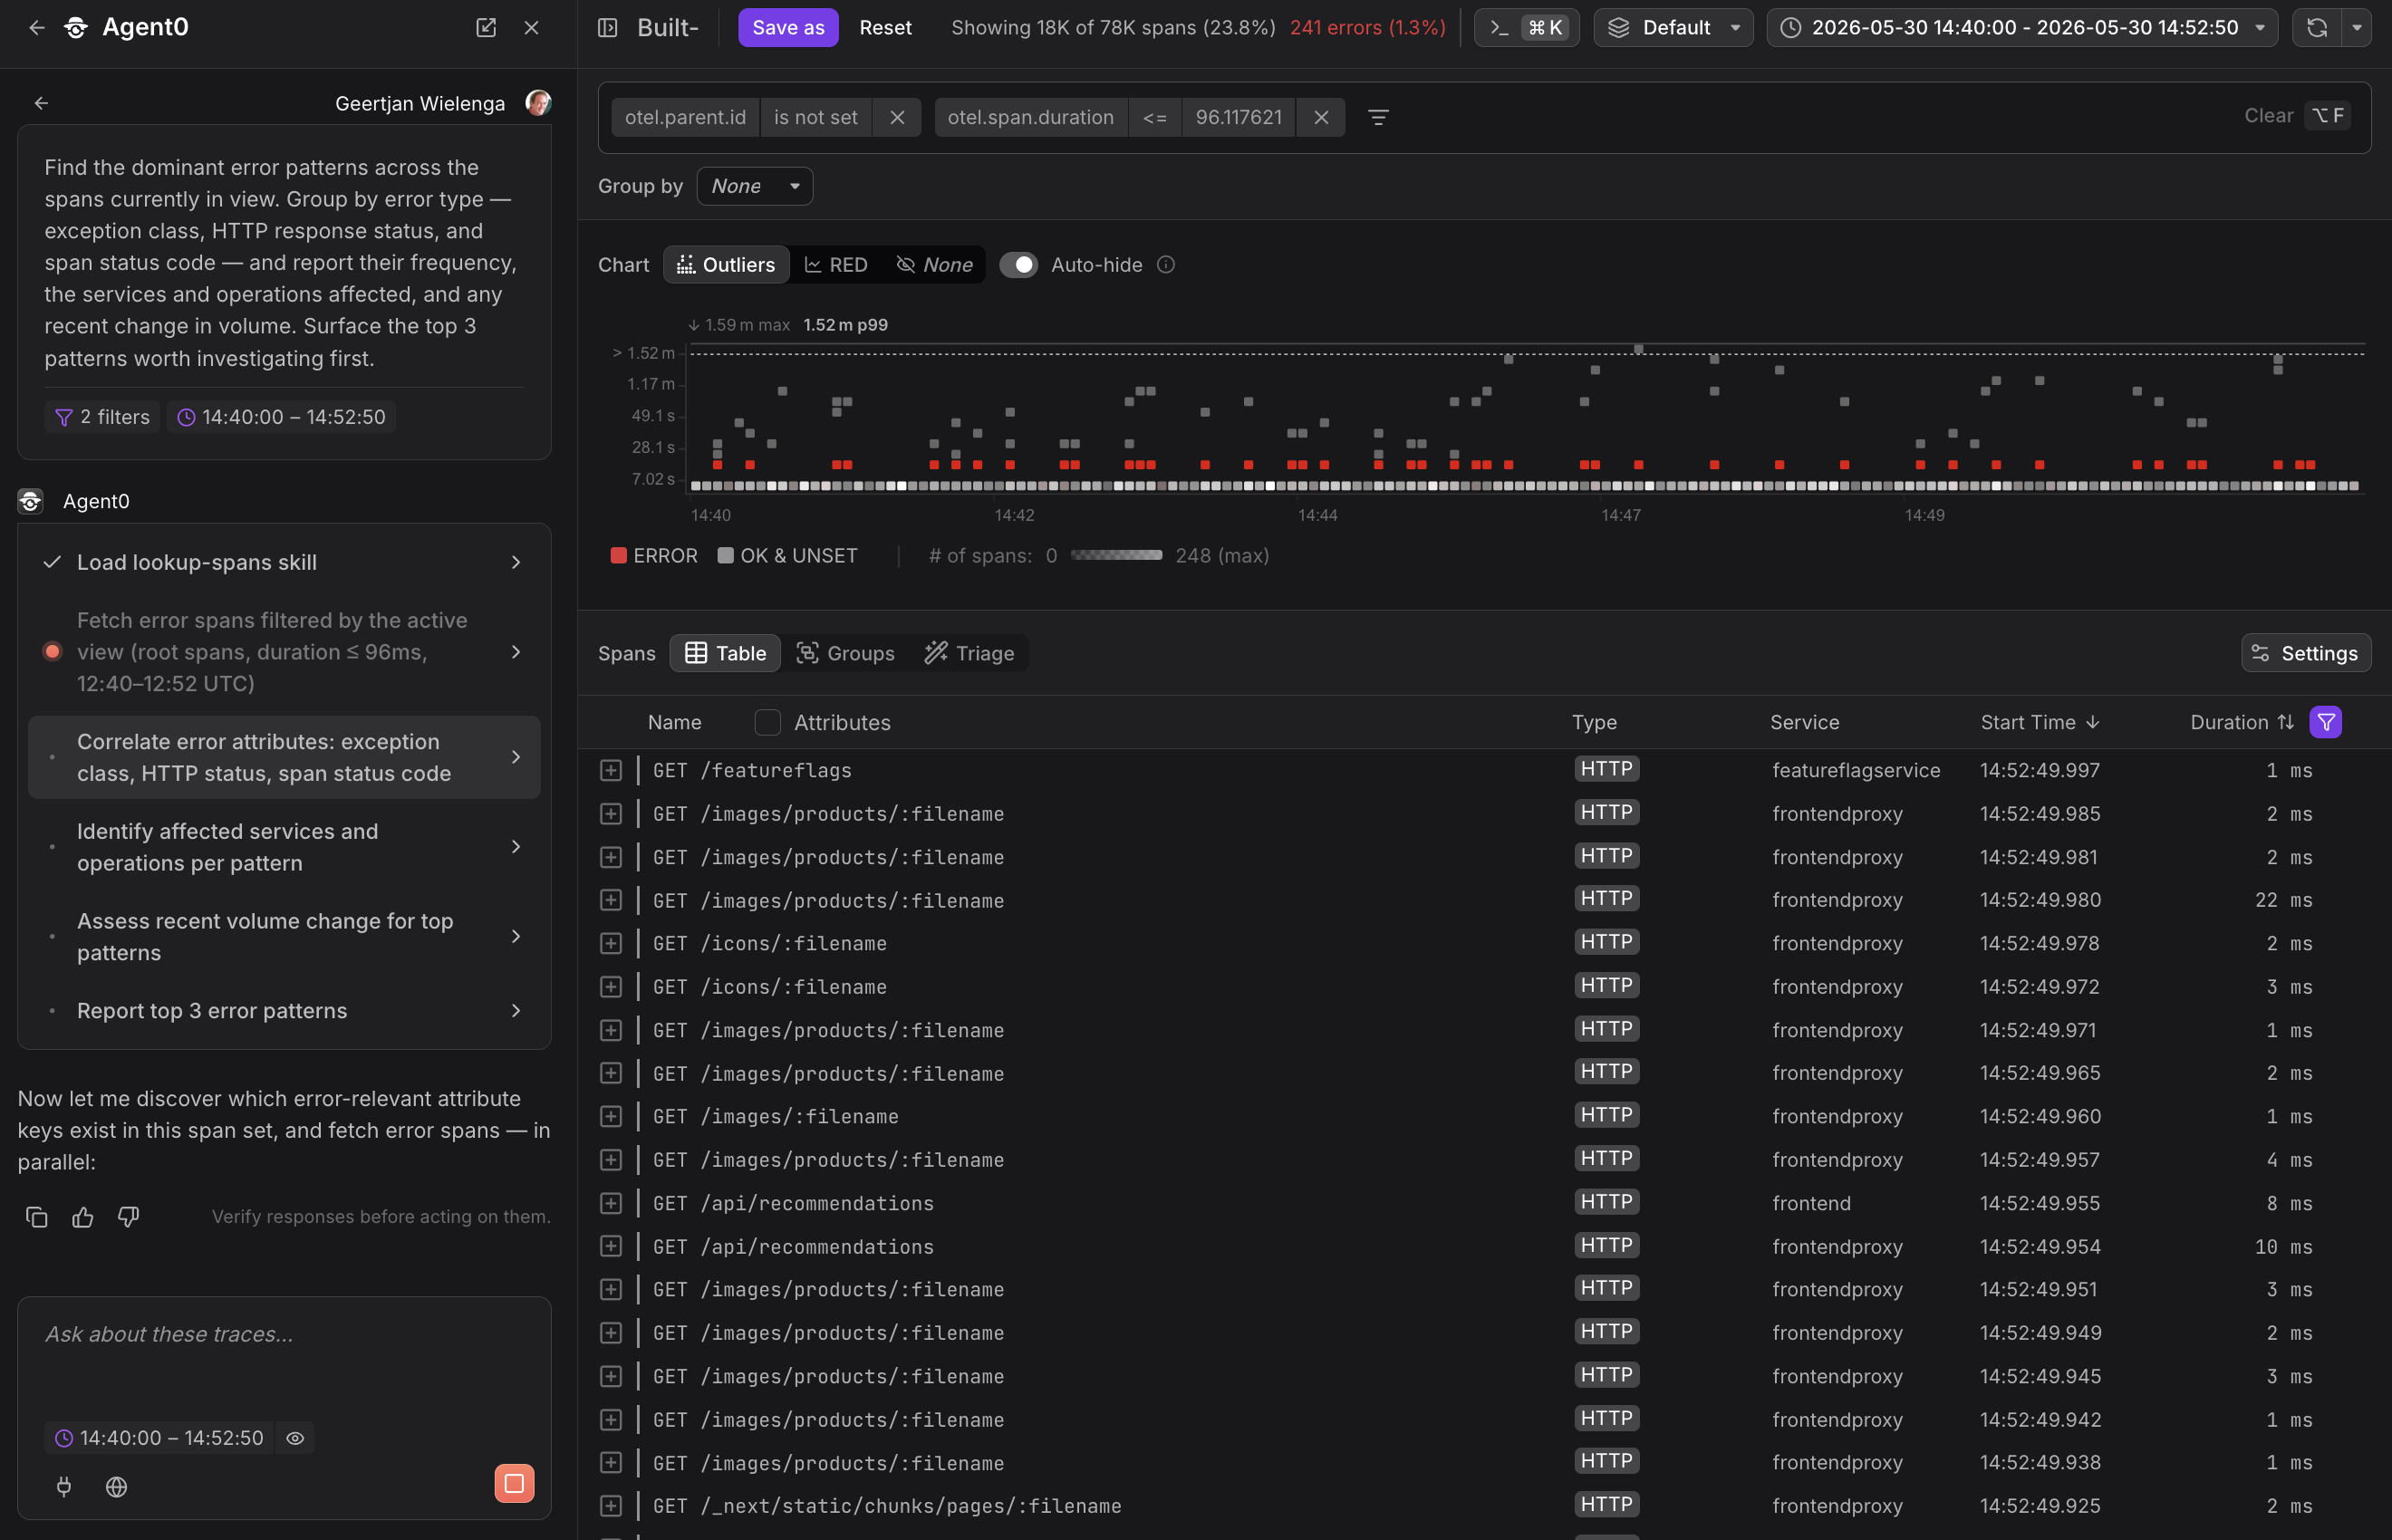
Context prompts — appear when a specific element is selected (a log row, a span, a failed check, a metric). Example: "Find root cause across trace" when a span is open.
-
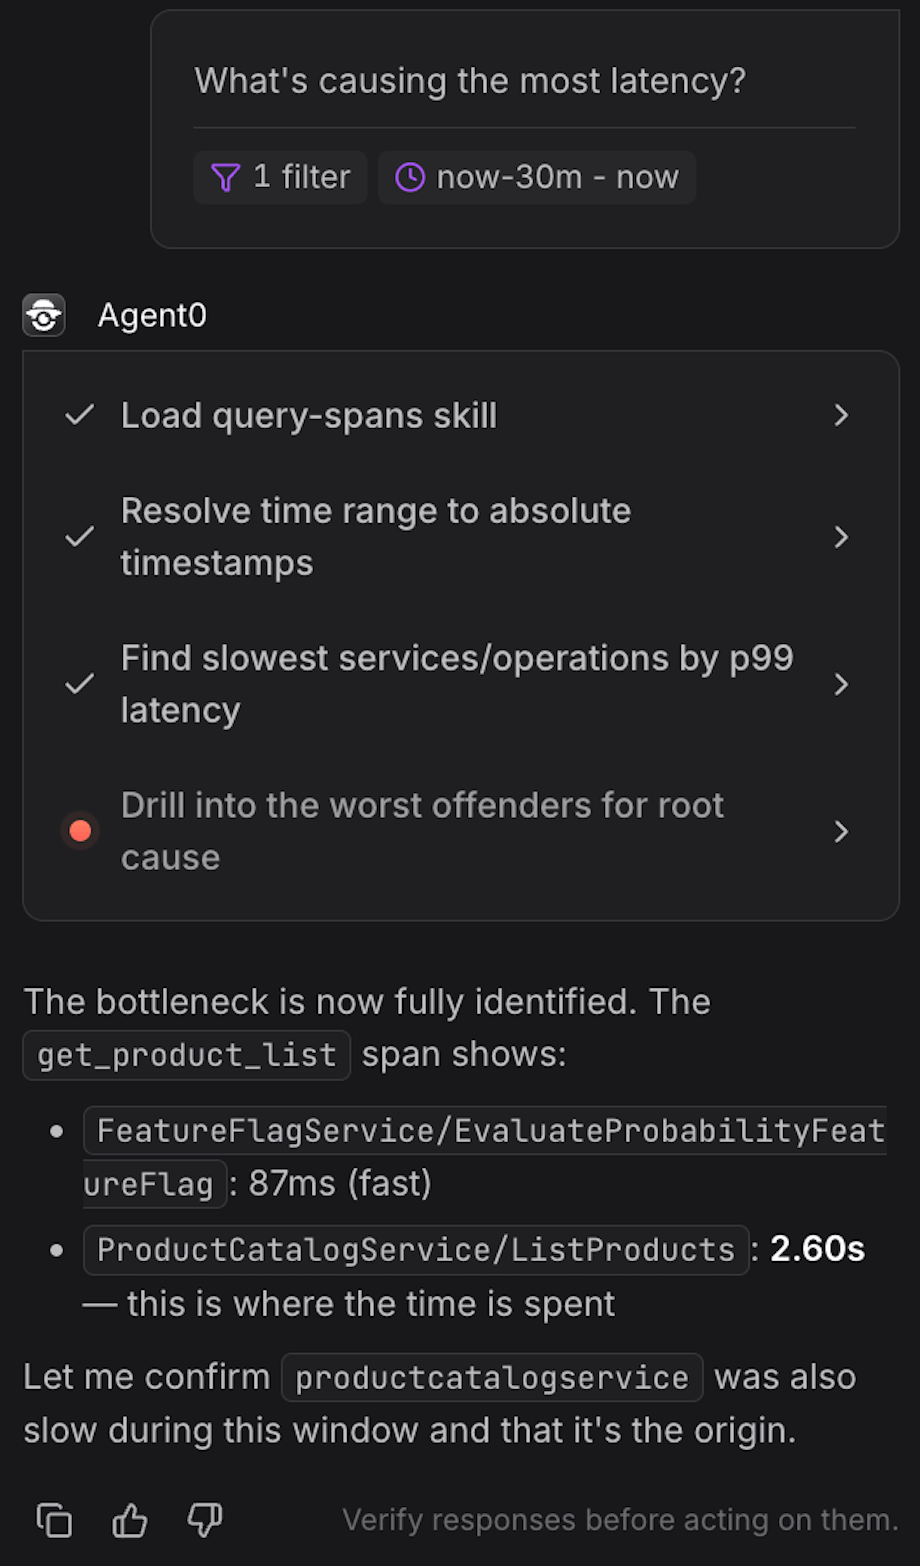
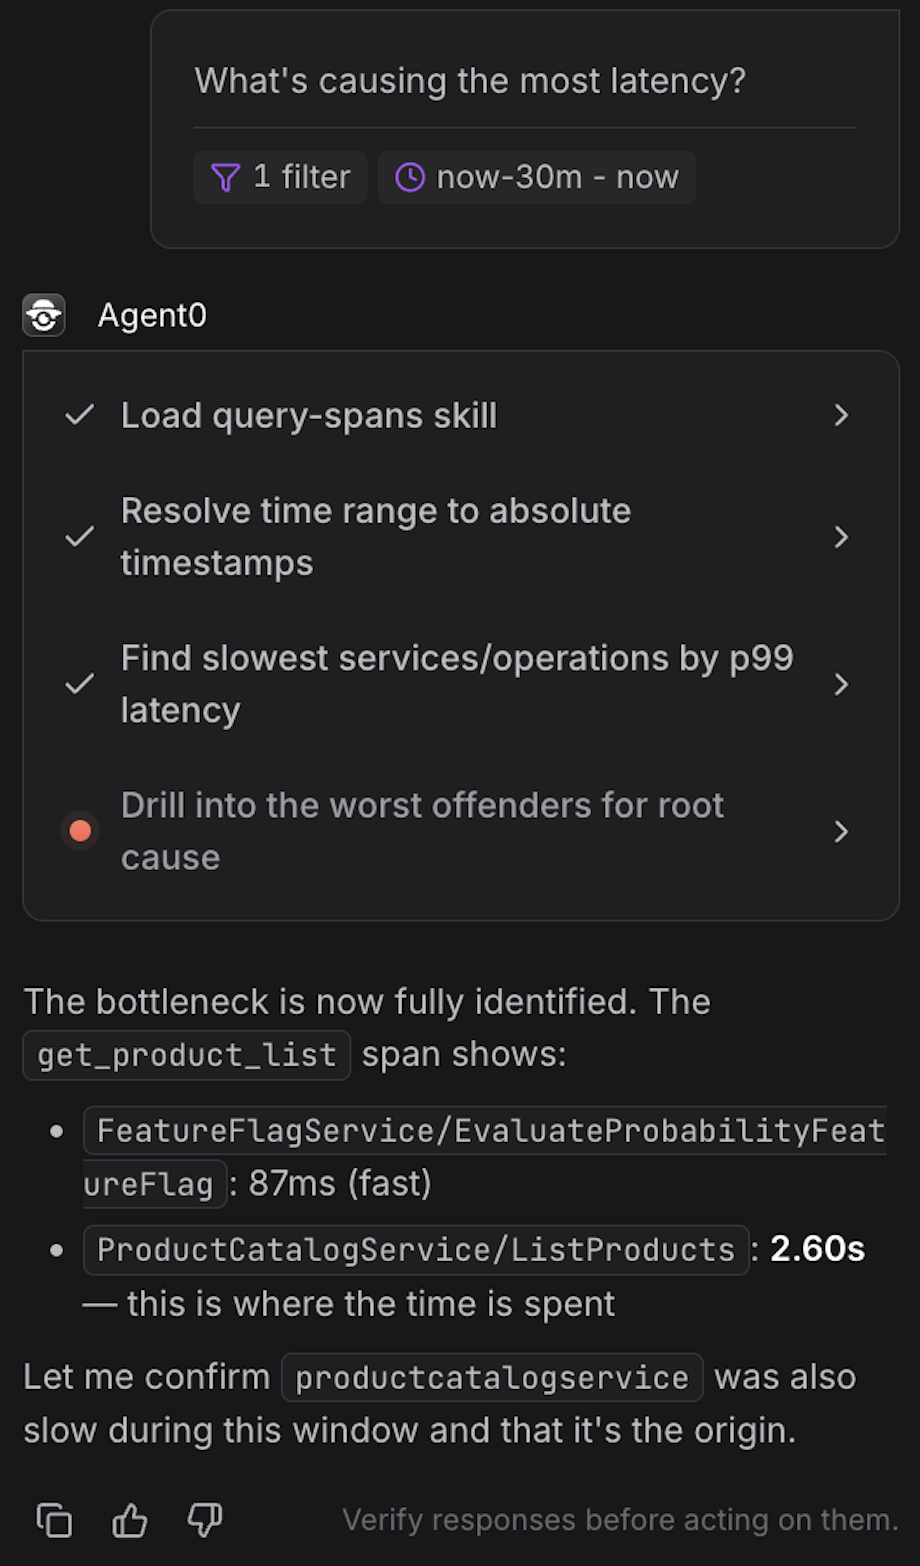
Page prompts — always available on a particular page. Example: "What's causing the most latency?" on the traces explorer.
-
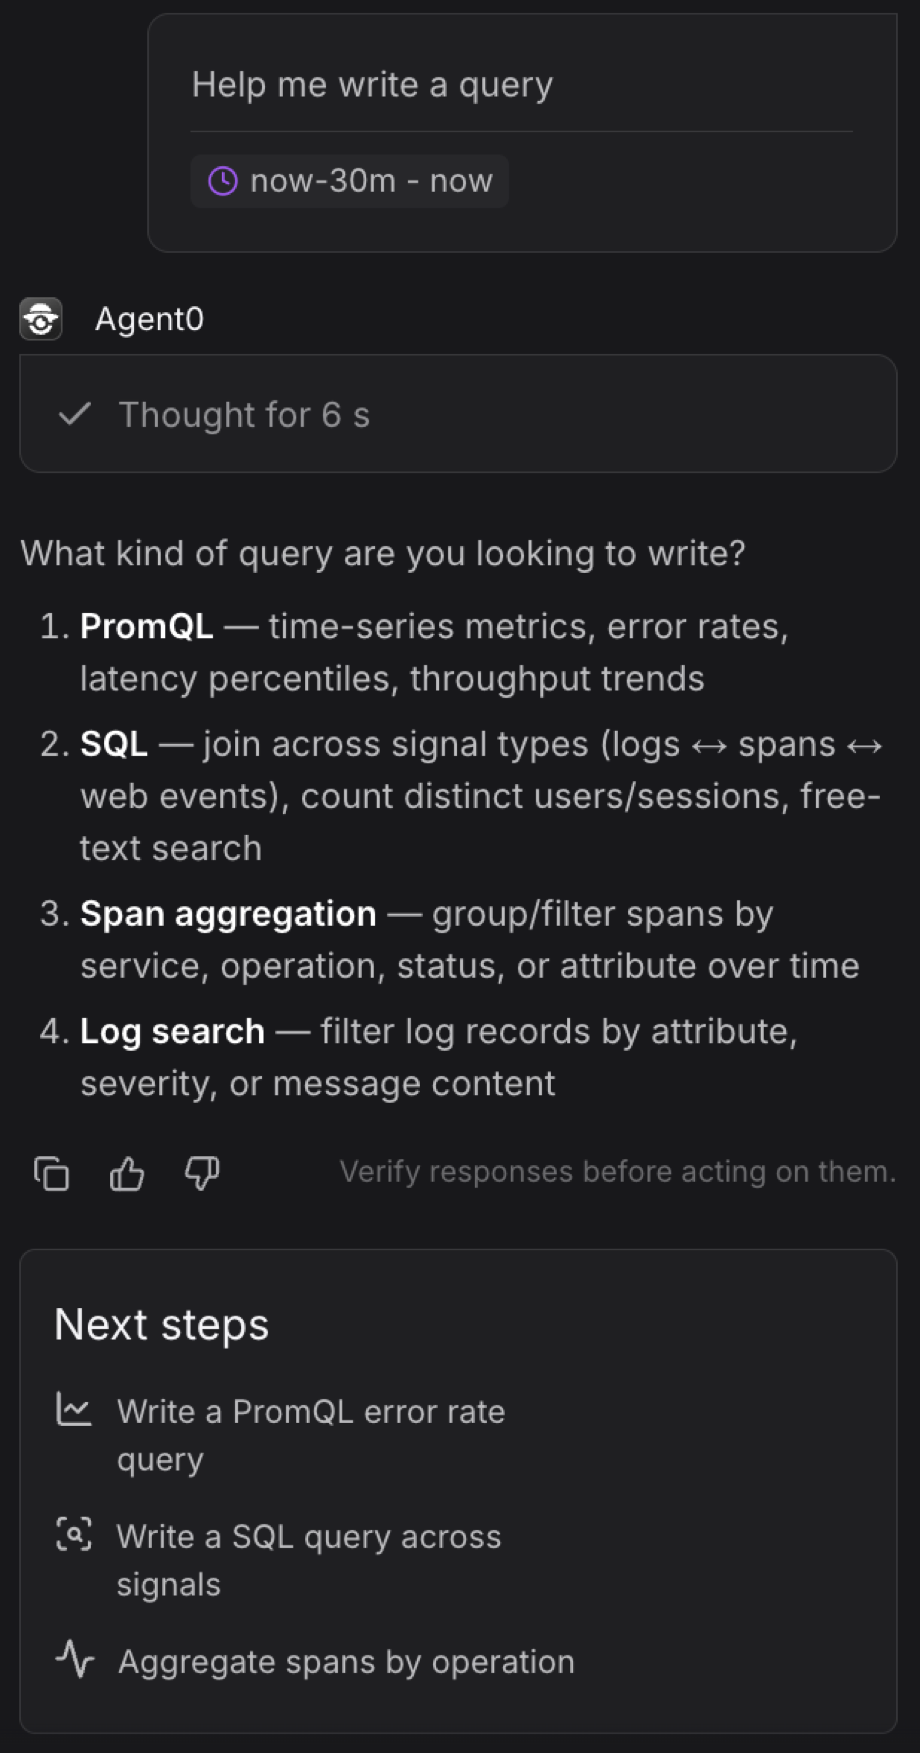
General prompts — low-priority prompts available everywhere on a path. Example: "Help me write a query."


Where it works
Logs, traces, alerts (failed checks and check rules), metrics, dashboards, services (catalog, detail, map), web monitoring, profiling, query builder, SQL editor, infrastructure pages, integrations, and settings.
Side-panel mode
Open the Agent0 panel as a side panel and the conversation continues while you navigate.
Your investigation context stays with you across pages.
Further Reading
- About Exploring Agent0 — Overview of Agent0's capabilities
- Asset Creation — Create artifacts from context
- Investigation & Analysis — Natural-language queries and root cause analysis
- Live Insights — Surface active problems automatically