
Last updated: September 23, 2026
Forecast Your Spend
The Forecast tab on the Billing & Plans page estimates your total spend for a full billing cycle, based on your recent usage rate. Access it at Settings → Billing & Plans → Forecast.
How the forecast works
- Choose an observation window: 30 minutes, 1 hour, 24 hours, or 7 days.
- Dash0 measures your usage rate over that window, then scales it to the length of a full billing cycle, as if that rate held for the entire period.
- The scaled usage is priced against your organization's actual pricing tiers and any custom prices, the same way your invoice is calculated.
Pick a shorter window to reflect a recent change in usage, or a longer window to smooth out short-term spikes.
This is a projection based on your recent usage rate. It doesn't account for usage already recorded this period, traffic spikes or drops, active spend limits, or invoice reconciliation, so actual charges may differ.
Reading the breakdown
The forecast breaks down projected volume and cost per SKU, alongside your observed usage, price, and tier limit for the period. A total projected cost for the full billing cycle is shown at the bottom.
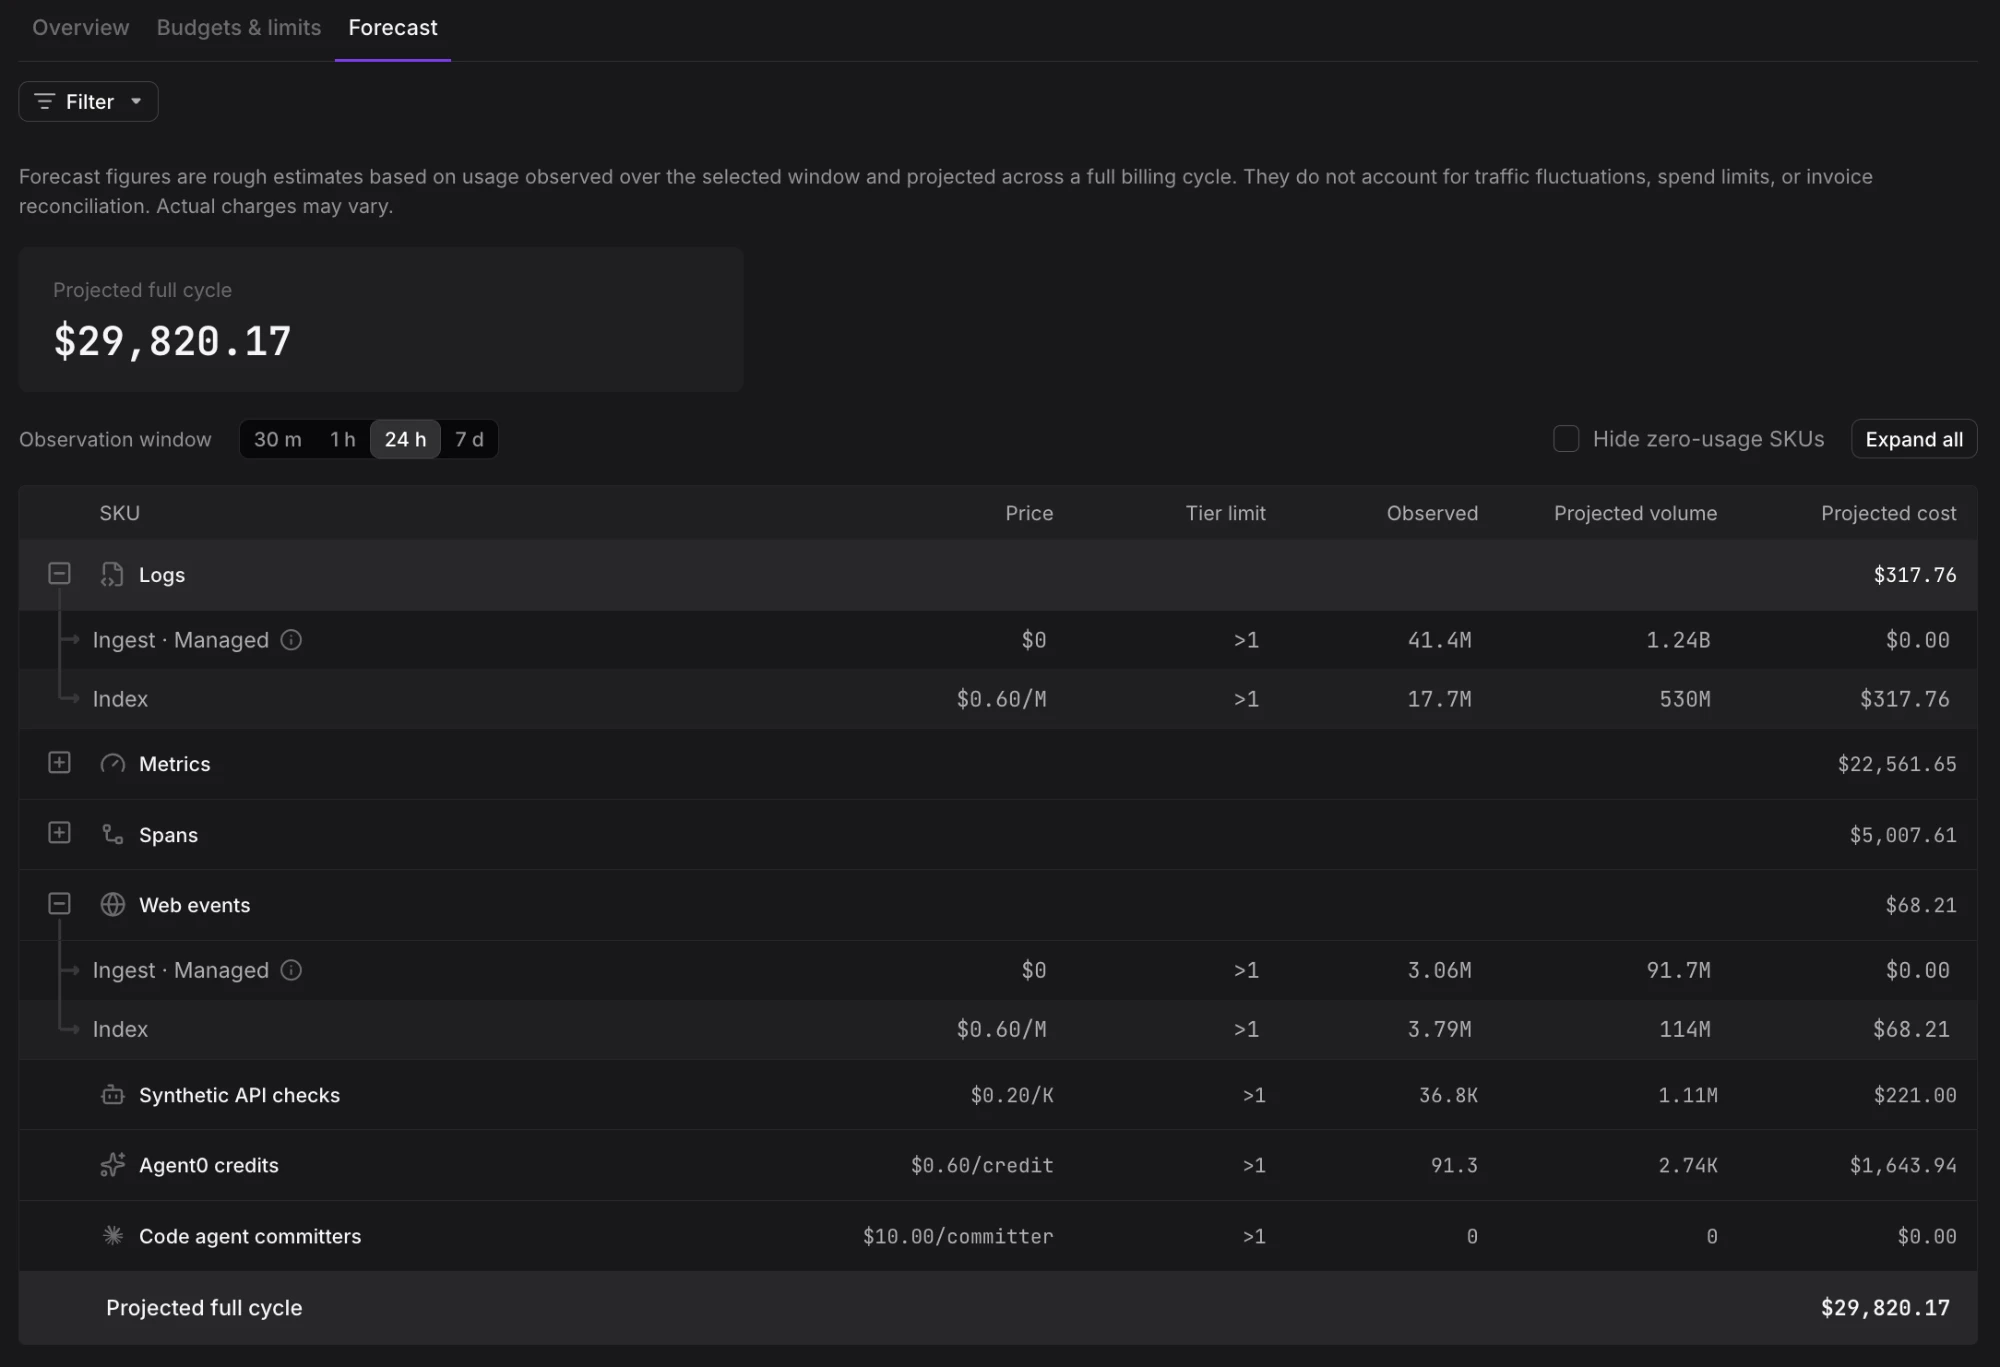
You can filter the forecast to a specific dataset, or leave it set to all datasets for an org-wide projection.
Further Reading
- About Billing & Cost Control — Overview of Dash0's cost control features.
- Set a Monthly Budget — Configure a hard spending cap, and set up alerts for when you're on track to exceed it.