Every AWS account ships with CloudWatch already collecting data. Every observability shortlist has Datadog on it. So the real question isn’t really "which one," it's more likely "why would I pay Datadog for something CloudWatch is half doing for free?"
And Datadog's position in this question got harder to justify in 2026. Why? It’s pretty simple really: AWS spent the year turning CloudWatch into an OpenTelemetry backend: native OTLP metrics ingestion with PromQL querying, per-GB pricing, and 15 months of storage included, on top of OTLP endpoints that already accepted traces and logs. At the same time, the X-Ray SDKs and daemon entered maintenance mode on February 25, 2026; AWS now limits releases to security fixes and recommends OpenTelemetry for new instrumentation. The old rule of thumb, CloudWatch for AWS infrastructure and a real platform for applications, doesn't survive contact with the 2026 product.
So, what still separates them might now be closer to: how much of your stack each one can see, what happens when your workloads aren't all in AWS, how the two bills behave under load, and what each does to your OpenTelemetry data after it arrives.
The short version
| Datadog | Amazon CloudWatch | |
|---|---|---|
| Scope | Cross-cloud, hybrid, on-prem | AWS-first, agent-based elsewhere |
| Signals | Metrics, logs, traces, profiles, RUM, synthetics, security | Metrics, logs, traces (X-Ray), RUM, synthetics |
| AWS service coverage | Via API polling and integrations | Native, zero setup, over 70 services |
| Billing unit | Per host, per module, plus per-GB and per-event | Per meter: per metric, per GB, per alarm, per query |
| OTel posture | OTLP accepted, translated to Datadog's model | OTLP accepted natively, queried with PromQL |
| Query language | Proprietary | PromQL for OTel metrics, Logs Insights for logs |
What each one is actually for
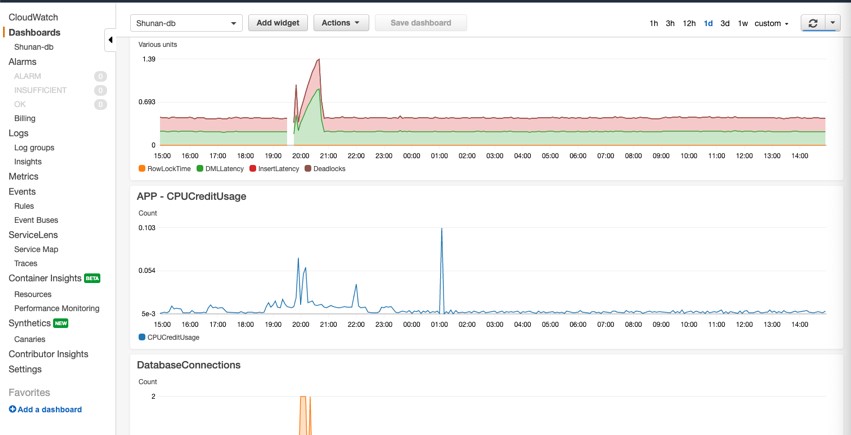
CloudWatch is AWS's operational data plane. Its strength is that it's already there. Most AWS services send metrics to CloudWatch automatically at no cost, with no agent and no configuration, across more than 70 services. So if you want to know why your ALB is returning 5xx or whether your RDS instance is CPU-bound, CloudWatch already has you covered.
On the other hand, Datadog is a monitoring product you buy. It has to earn its place, and it does that through sheer breadth: over a thousand integrations, one correlation model across infrastructure, applications, logs, front-end sessions, and security, and a UI built for people who spend their working day in it. That last part is underrated. In fairness, CloudWatch has improved a lot, but Datadog is still the tool where an engineer who has never seen your system can pivot from a latency spike to the offending service to the log line without stopping to think about which console to open.
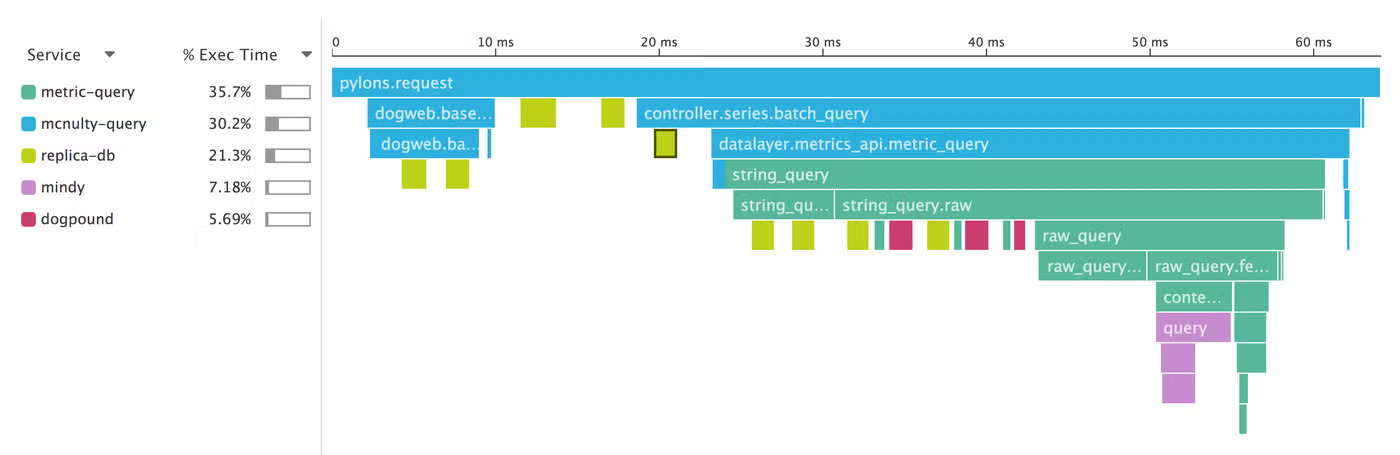
Scoring these differences as a feature list wouldn’t really do justice to either side, because this is an architecture argument: where your data lives and who can read it.
Telemetry coverage
CloudWatch has strong native coverage of AWS services because many publish metrics directly to it. Datadog's AWS integration polls AWS APIs or consumes metric streams, which means you're paying twice for the same numbers: once to AWS to produce them, once to Datadog to store them. CloudWatch Metric Streams bill at $0.003 per 1,000 metric updates plus Amazon Data Firehose charges on top, so the pipe itself is a line item.
Where Datadog pulls ahead is everything that isn't an AWS service. Continuous profiling, distributed tracing with database query-level detail, session replay, CI pipeline visibility, and cloud security posture all live in one product with one tag model. CloudWatch has analogs for some of this (Database Insights, RUM, Synthetics, Container Insights), but they are separate meters with separate mental models, so correlation across them is not as clean as it is in Datadog.
While both do logs, Datadog's log pipeline is more capable. It boasts out-of-the-box parsing for 200+ log sources and processing rules you configure once. CloudWatch Logs is a storage layer with a query engine bolted on. Which is fine. It works, and the Infrequent Access log class cuts ingestion to $0.25 per GB against the standard $0.50, which makes it a reasonable place to park audit and compliance logs you rarely touch.
Cross-cloud is the hard line
This is where a decision usually gets made, and it isn't close. If you run on AWS and Azure, or AWS and GCP, or AWS plus a rack of machines in a colo, CloudWatch will cover one of those properly and the rest badly. You can install the CloudWatch agent on non-AWS hosts, and the metrics and logs endpoints accept bearer token authentication for workloads running outside AWS that can't use the AWS SDK. But you're paying AWS to store telemetry about infrastructure AWS knows nothing about, with little of the resource enrichment that makes CloudWatch useful in the first place and none of the service integrations.
In this respect, Datadog has no such seam. And in many cases that is most of what you're buying.
If you're single-cloud on AWS, this whole section is a non-issue and you should weight it at zero. In fact, plenty of teams have no cross-cloud requirement at all, just a vague fear of one.
Pricing: per host versus per meter
When it comes to the bills, as it inevitably will, Datadog and CloudWatch have different breaking points, which is why cost comparisons between them are sometimes wrong, or at least missing part of the full picture. For the full CloudWatch side, we have a breakdown of every meter; what follows is the part that matters against Datadog.
Datadog charges per host, per product. Infrastructure Pro is $15 per host per month billed annually or $18 month-to-month/on-demand, Enterprise is $23 or $27, and base APM is $31 billed annually or $36 month-to-month/on-demand. Logs ingest at $0.10 per GB, with standard indexing at $1.70 per million log events at 15-day retention. The bill is predictable until it isn't: Pro includes 100 custom metrics per host and 5 containers per host, with additional containers at $0.002 per container-hour. Blow past either allotment and the shape of your bill changes.
CloudWatch charges per meter with no floor. Custom metrics are $0.30 each per month for the first 10,000, dropping to $0.10 from 10,001 to 250,000 and $0.05 above that. Logs ingest at $0.50 per GB with storage at $0.03 per GB-month. Standard alarms are $0.10 each, composite alarms $0.50, and you get three custom dashboards free before dashboards start costing money. Nothing is expensive on its own. The total is death by a thousand meters, and nobody owns it.
A directional model
Take 50 EKS nodes running 40 services, 300 GB of logs a month at roughly 2 KB per event, 10,000 metric series at one-minute resolution, and 500 GB of spans. List prices, annual commitment, US East.
Datadog lands around $2,600 a month before custom-metric overages: $750 for Infrastructure, $1,550 for APM, and roughly $285 for logs once you index 150 million events. Span ingestion is covered, since each APM host includes 150 GB of ingested spans and 1 million indexed spans, summed across all APM hosts. Custom metrics are the wildcard. You get 5,000 included and need 10,000. At current list prices, 5,000 indexed custom metrics plus their ingestion above the allotment would add roughly $255 per month, bringing this model to about $2,850; actual billing depends on hourly usage and the distinction between ingested and indexed metrics.
CloudWatch lands a little over $400 before alarms, dashboards, and query charges, and the interesting part is where the money isn't. Logs run about $150. Spans through Application Signals cost about $175 at $0.35 per GB for the first 10 TB. And those 10,000 metric series cost roughly $97, because OTLP metrics are charged at $0.50 per GB ingested with no separate charges for API calls, storage, or number of unique series, where a typical data point with 10 to 15 attributes runs 300 to 600 bytes.
Send the same 10,000 series as classic custom metrics and you'd pay $3,000. Same data, same account, thirty times the price. That gap is the single most consequential thing in CloudWatch pricing right now, and native OpenTelemetry metrics only reached general availability in June 2026, so most teams have never modeled it.
Treat these numbers as a model, not a quote. They assume a log event size, a data point size, and a metric resolution, and all three move the answer. Both bills also move hard with retention and cardinality, and CloudWatch's per-byte metric pricing means sampling every 15 seconds instead of every 60 multiplies that $97 by four.
Setup and daily operation
Setup is a big word when it comes to CloudWatch. I mean, you basically turn on a service and metrics appear. That’s about it. No agent, no instrumentation, no rollout. For infrastructure telemetry, nothing else comes close to this essentially plug-and-play model.
But don’t celebrate yet, because for application telemetry the gap closes and reverses. Datadog's agent handles host metrics, container discovery, log tailing, and APM from a single deployment, and its auto-instrumentation covers Java, Python, Ruby, Go, Node, .NET, and PHP without code changes. CloudWatch asks you to assemble Container Insights, Application Signals, X-Ray, and log groups separately, each with its own enablement path and its own bill.
For run-of-the-mill, day-to-day work, the difference shows up in queries. Datadog's query builder is consistent across every signal. CloudWatch makes you switch languages depending on what you're looking at: Logs Insights syntax for logs, metric math for classic metrics, and now PromQL for OTel metrics. Three query models in one console is a real tax on the person holding the pager when alarms start firing.
OpenTelemetry workflows
OpenTelemetry is where the two products have quietly swapped positions over time, and it deserves some extra attention.
CloudWatch now accepts OTLP directly on regional endpoints, one per signal. Metrics go to https://monitoring.<region>.amazonaws.com/v1/metrics, traces to https://xray.<region>.amazonaws.com/v1/traces, and logs to https://logs.<region>.amazonaws.com/v1/logs. CloudWatch retains OpenTelemetry metric types, including counters, histograms, gauges, and up-down counters, without conversion, and supports up to 150 labels against the 30-dimension limit of classic custom metrics. It also enriches every ingested metric with account ID, Region, cluster ARN, and resource tags from AWS Resource Explorer, with no additional instrumentation.
The collector config is straightforward, with one required extension. This exports metrics from a standard OTel Collector to the CloudWatch metrics endpoint:
12345678910111213141516171819extensions:sigv4auth:service: monitoringregion: us-west-2exporters:otlphttp/cloudwatch:metrics_endpoint: https://monitoring.us-west-2.amazonaws.com/v1/metricsauth:authenticator: sigv4authcompression: gzipservice:extensions: [sigv4auth]pipelines:metrics:receivers: [otlp]processors: [resourcedetection, batch]exporters: [otlphttp/cloudwatch]
The region and signing service in the sigv4auth extension must match the endpoint you're targeting, so check the AWS OTLP endpoint reference for the current values rather than copying them from a blog post.
Read the constraints before you commit to this. The endpoints are HTTP only and do not support gRPC, they require the sigv4authextension from the Collector contrib distribution, and they accept gzip or no compression. The metrics endpoint caps requests at 1,000 datapoints and 1 MB, and rejects timestamps more than 10 minutes in the future or 14 days in the past. Logs require x-aws-log-group and x-aws-log-stream HTTP headers on every request, which drags an AWS-specific concept into a pipeline you built to be vendor-neutral. None of this is a dealbreaker by itself, but all of it is friction you should know about.
Datadog also accepts OTLP, through the Agent's OTLP receiver or the DDOT Collector, Datadog's own distribution:
12345678910111213receivers:otlp:protocols:grpc:endpoint: 0.0.0.0:4317http:endpoint: 0.0.0.0:4318exporters:datadog:api:key: ${env:DD_API_KEY}site: ${env:DD_SITE}
It works. It's well documented. But the data gets translated into Datadog's model on arrival, and that translation has a price attached. OTLP metrics land in the custom metrics bucket, and Datadog's own docs warn that custom metrics may impact billing when you start attaching pod labels as tags. Datadog also meters OpenTelemetry APM by reported hosts: its usage API exposes opentelemetry_apm_host_count for hosts reported by the Collector exporter. That means hostname and resource attribution in your Collector deployment can affect the bill. If you want the full path off Datadog's conventions, we wrote up the migration separately.
So: sending OTel metrics to CloudWatch moves you off per-series pricing onto per-byte pricing. Sending the same metrics to Datadog moves you toward per-series pricing. For a high-cardinality Kubernetes workload, that's the whole decision.
This is the structural point about Datadog worth sitting with. Its revenue is tied to the volume and cardinality of what you send it, which means every architectural decision that would reduce your data is a decision that reduces Datadog's revenue. That dynamic is not unique to Datadog, and it explains why observability bills get away from people more reliably than any individual line item does. Datadog is OpenTelemetry-compatible. It is not OpenTelemetry-native, and the difference is not marketing.
Which one should you pick
Pick CloudWatch if you're entirely on AWS, your team is small enough that the console's rough edges cost less than a second vendor's invoice, and you want your telemetry inside the same IAM boundary as everything else. The 2026 OpenTelemetry work makes this a far better answer than it was a year ago, especially if your instrumentation is already OTLP.
Pick Datadog if you're multi-cloud or hybrid, if enough engineers touch observability that UI quality compounds into real time saved, or if you need profiling, session replay, and security posture from one vendor with one tag model. Just go in with a plan for custom metric cardinality, because that's the bill that surprises people.
Run both, which many teams do, if you want CloudWatch for AWS service metrics and alarms while Datadog handles applications. It's defensible. It also means two bills, two alerting systems, and the correlation problem you bought Datadog to avoid.
Where Dash0 fits
Dash0 is an AI control plane for production, built OpenTelemetry-native rather than OpenTelemetry-compatible, and the difference between those two is architectural rather than semantic. Telemetry arrives as OTLP and stays in the OpenTelemetry data model: resource attributes, semantic conventions, and all. Queries are PromQL, dashboards are Perses, and the Dash0 Operator for Kubernetes handles collection and auto-instrumentation without a proprietary agent. Nothing is translated on the way in, so nothing has to be untranslated if you leave.
Agent0 sits on top of that as its own product rather than a platform feature. It investigates issues, works back to root cause, and drafts fixes, with autonomy that steps up as you trust it: proposing actions you approve, then acting while you review, then running unattended on the workflows you've signed off.
The billing structure differs from both tools above in a way that matters here. Dash0 counts signals rather than bytes, so a span carrying twenty attributes costs the same as one carrying four, there's no per-seat charge, and there's no reason to strip metadata to save money. Charges split in two: ingestion applies to everything you send, storage applies only to what you keep. SignalControl filters, samples, and aggregates telemetry the moment it arrives, so the noise you drop never reaches the storage line. SignalControl Edge runs the same rules inside your own Kubernetes cluster before telemetry leaves your network, which takes ingestion and egress out of it too. That is a hard architecture to justify for a vendor whose revenue depends on you sending more.
If you're weighing CloudWatch's AWS depth against Datadog's breadth and finding both answers unsatisfying, that third shape is worth a look. If you're single-cloud on AWS with modest volume, CloudWatch is genuinely fine and you should keep your money.
Final thoughts
The honest summary: CloudWatch closed a lot of the gap in 2026, mostly by adopting OpenTelemetry rather than by out-building Datadog. If your instrumentation already speaks OTLP and your workloads live in AWS, the case for a second vendor is weaker than it was. If you run anywhere else, or you have engineers whose time is worth more than the license, Datadog still earns its price.
Whatever you choose, instrument with OpenTelemetry first and decide on the backend second. AWS itself is transitioning X-Ray to OpenTelemetry as its primary instrumentation standard. Both vendors accept OTLP today. That's the one decision you can make now that won't need unmaking.
Worth reading next: how AWS CloudWatch pricing works, what OpenTelemetry-native actually means, and why vendor lock-in is still a problem in 2026.