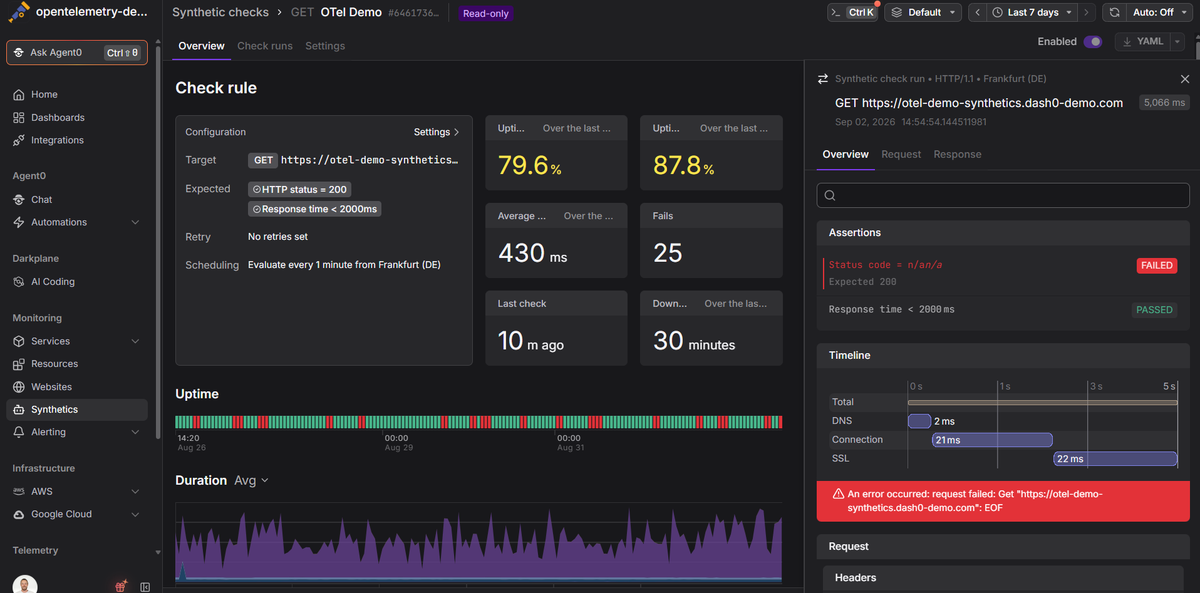
UptimeRobot is a hosted uptime-monitoring service for websites, APIs, ports, DNS, SSL certificates, and scheduled jobs. Small SaaS teams, agencies, and independent developers use it because monitors are quick to create, public status pages are built in, and its free plan is unusually generous. Its paid tiers remain easy to understand: your monitor count and check interval do most of the pricing work.
The best UptimeRobot alternative depends on what you have outgrown. Some teams need real-browser transactions rather than endpoint checks. Others want monitors defined in code, private probes for internal services, on-call rotations, or a direct path from a failed check to logs and traces. Those capabilities move you away from a lightweight uptime tool and toward developer-focused synthetic monitoring or a broader observability platform, usually with a more complicated bill.
Quick picks
| Tool | Best fit |
|---|---|
| Better Stack | Teams that want uptime, on-call, incident response, and status pages in one workflow |
| Checkly | Developer teams that want API and Playwright checks managed as code |
| Pingdom | Organizations focused on established website, transaction, and real-user monitoring |
| Dash0 | OpenTelemetry-first teams that want API uptime checks beside logs, metrics, and traces |
| StatusCake | Agencies and small teams that need broad website checks at predictable plan tiers |
| Site24x7 | IT teams monitoring websites alongside servers, networks, cloud services, and applications |
| Datadog Synthetic Monitoring | Existing Datadog customers that want synthetic failures correlated with full-stack telemetry |
| Grafana Cloud Synthetic Monitoring | Grafana and k6 users that want scriptable checks and private probes |
What to look for in an UptimeRobot alternative
-
Check depth: Decide whether HTTP, keyword, ping, port, DNS, SSL, and heartbeat checks are enough. Authenticated API sequences or browser journeys require a synthetic-testing product, not just a faster uptime monitor.
-
Execution model: Compare check intervals, retry behavior, location selection, and whether one schedule runs from every location or rotates between them. Private probes matter when the target is not publicly reachable.
-
Dashboard-created checks work fine for a handful of monitors. Once the list grows, Terraform, an API, or a monitoring-as-code workflow keeps checks reviewable and synchronized with deployments instead of drifting from what production actually runs.
-
Alerting and response: Notification contacts are not the same as on-call schedules, escalation policies, incident timelines, and subscriber communications. Buy the workflow your responders actually need.
-
A failed check proves that something is wrong; it rarely explains why. Ask whether the platform can connect that failure to application traces, logs, infrastructure metrics, or real-user data, or whether you will be left opening a second tool to find out.
-
Status pages: Check whether public and private pages, custom domains, branding, subscribers, and automated incident updates are included or separately priced.
-
Monitor-count plans are predictable until you need more checks or seats. Run-based pricing grows with frequency, locations, retries, steps, and browser duration, and observability suites add telemetry meters on top of that.
1. Better Stack
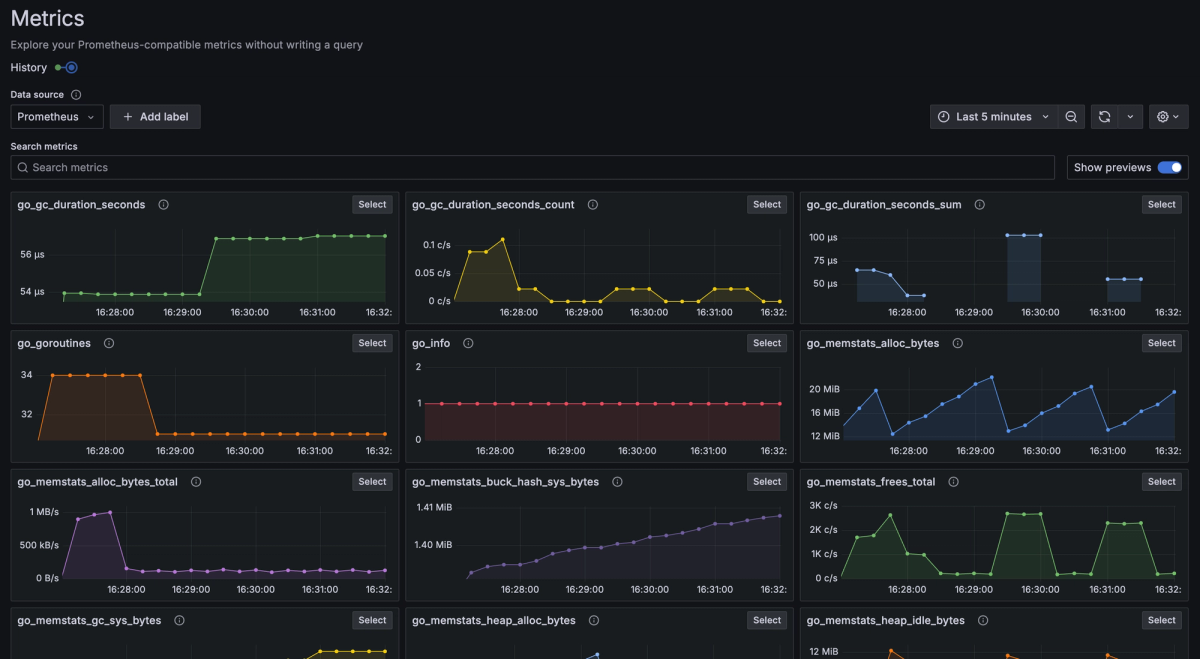
Best for: Teams that want monitoring, on-call, and status communication under one vendor
Better Stack is the most direct upgrade when UptimeRobot's checks are adequate but its response workflow is not. It combines external uptime monitoring, cron heartbeats, Playwright transaction checks, on-call schedules, incident management, and status pages. Failed checks can include screenshots, error output, and network diagnostics, giving responders more evidence before they open another tool.
The practical advantage is consolidation. A monitor can wake the scheduled responder, open an incident, and feed customer communication without stitching together separate uptime, paging, and status-page products. Better Stack also offers logs, metrics, traces, error tracking, and Real User Monitoring (RUM); if those are in scope, use the Better Stack alternatives comparison rather than treating this as a simple uptime migration.
Pricing combines responder licenses with included monitors, paid monitor packs, Playwright minutes, heartbeat packs, and optional status-page or enterprise add-ons. That is easy to model when on-call is the reason you are buying it, but inefficient for a large monitor inventory with few incidents or no rotation.
Worth exploring if: You want external monitoring to trigger a complete incident-response workflow.
Give it a pass if: You only need inexpensive high-volume checks and would not use the responder, telemetry, or status-page layers.
2. Checkly
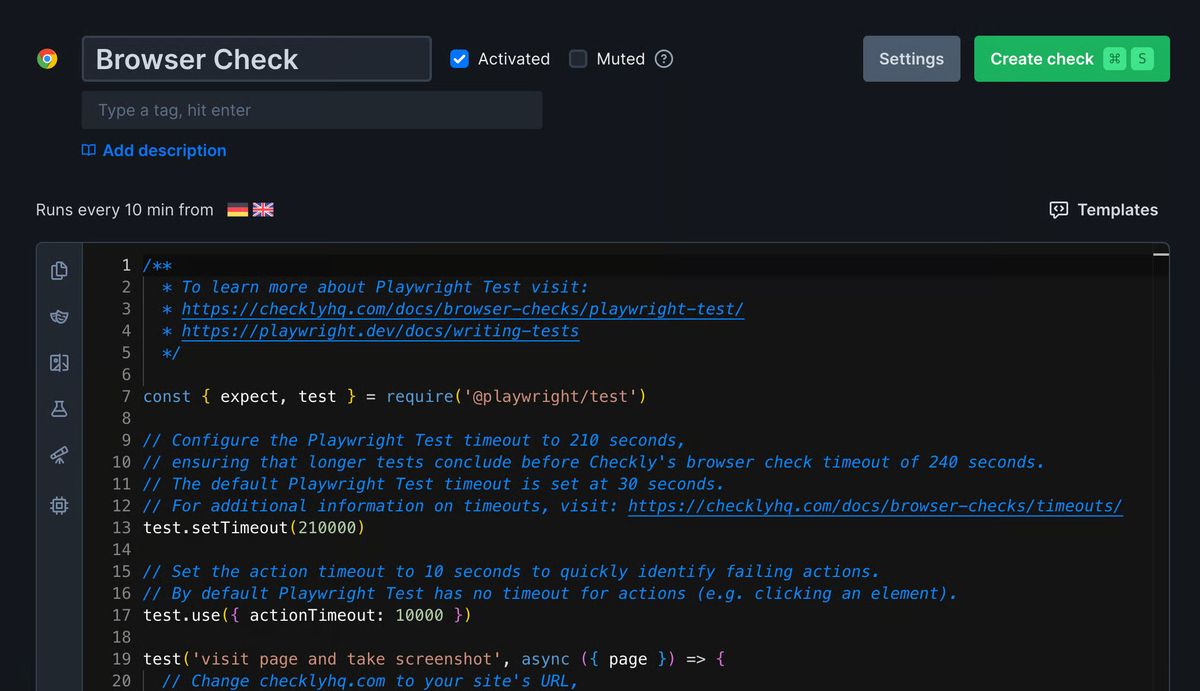
Best for: Developer-owned API and browser monitoring managed through code
Checkly treats synthetic monitoring as an engineering artifact. It supports simple uptime monitors, API and multistep checks, Playwright-powered browser checks, and full Playwright suites. The stronger distinction is its monitoring-as-code workflow: JavaScript or TypeScript constructs, a CLI, Terraform, Pulumi, and an API let teams review and deploy checks alongside the application.
That model is a good fit when UptimeRobot's dashboard-created checks drift from production behavior. Developers can reuse test logic, run checks in CI, and validate authenticated user journeys rather than only checking whether a URL returns the expected status. The tradeoff is ownership: browser scripts and multistep flows are code, so someone must maintain them when the application changes.
Pricing separates monitor inventory from API and browser execution allowances. Frequency, parallel locations, retries, multistep requests, and long-running Playwright suites all increase consumption; paid self-serve plans continue running checks at overage rates. A free plan is available for smaller workloads.
Worth exploring if: Your developers already use Playwright and want monitoring changes to follow the same review and deployment process as code.
Give it a pass if: You want a set-and-forget dashboard with minimal test maintenance or need deep infrastructure observability in the same purchase.
3. Pingdom
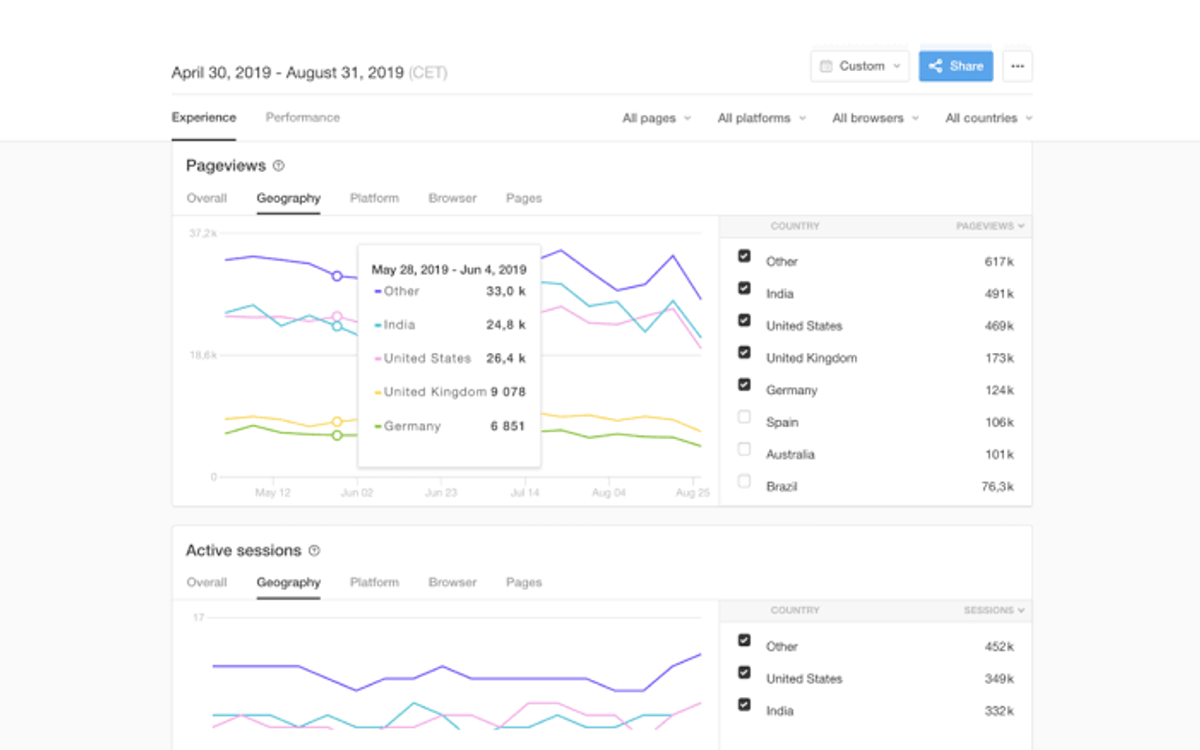
Best for: Established website monitoring with transaction and real-user performance data
Pingdom remains a credible UptimeRobot alternative for teams centered on websites rather than distributed-service telemetry. Its synthetic product covers uptime, page-speed, and transaction checks, while RUM shows how actual visitors experience load time and page behavior. That combination is useful when the question is not only “Is the site reachable?” but also “Is it slow, and where?”
Pingdom's maturity is the appeal. It provides global polling, alerting, downloadable availability reports, and a familiar model for web operations and customer-facing Service Level Agreement (SLA) reporting. It is less compelling as a developer-native testing platform: Checkly and the k6-based Grafana workflow are better starting points when version-controlled scripts and CI execution drive the decision.
Synthetic pricing scales by the number of uptime checks and “advanced” checks, where page-speed and transaction monitors share an allowance. Public plans include a 14-day trial rather than a permanent free tier, so compare the inventory you need, not only the entry price.
Worth exploring if: Website availability, transactions, performance reporting, and RUM belong in the same operational view.
Give it a pass if: A permanent free tier, monitoring-as-code, or a bill independent of check inventory is a hard requirement.
4. Dash0
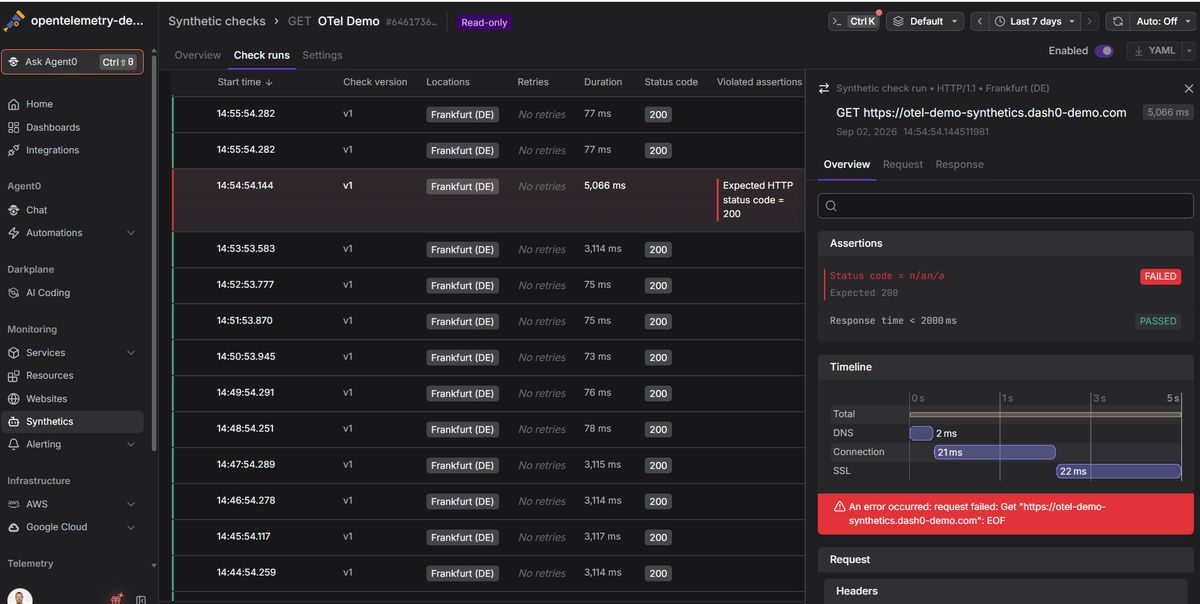
Best for: OpenTelemetry-first teams that want API uptime data in the same investigation as application telemetry
Dash0 is an OpenTelemetry-native observability platform that now includes synthetic HTTP checks. Checks run from managed global locations, support request configuration and assertions, and expose retry and round-robin or all-location execution strategies. They can be managed through the Kubernetes Operator, Terraform provider, or CLI. Run details and the metrics each check produces sit beside logs, metrics, and traces, so a failed endpoint can become the start of an application-level investigation.
This is a stronger replacement when UptimeRobot has become an isolated signal than when all you need is a public status page. Dash0's current synthetic workflow and pricing center on HTTP/API checks, not scripted browser journeys. It also does not provide native on-call rotations or a customer status-page product, so those functions require separate tools. The differentiator is not check variety: it is that the failing check and the telemetry that explains it live in the same OpenTelemetry-native store, so you are not passing a URL and a timestamp to a second vendor's proprietary agent to start the investigation.
Pricing bills synthetic API checks at $0.20 per thousand runs, without a base platform charge or seat fee. The metrics a check produces are billed as standard metric data points, the same meter that applies to any logs, spans, or web events you ingest; only Dash0's on-demand synthetic metrics, computed at query time from telemetry you already store rather than kept as their own time series, come at no extra charge. A 14-day free trial with no credit card required is available.
Worth exploring if: You want portable OpenTelemetry instrumentation and direct correlation between API failures and backend telemetry.
Give it a pass if: Browser transactions, built-in on-call scheduling, or public status pages are mandatory.
5. StatusCake
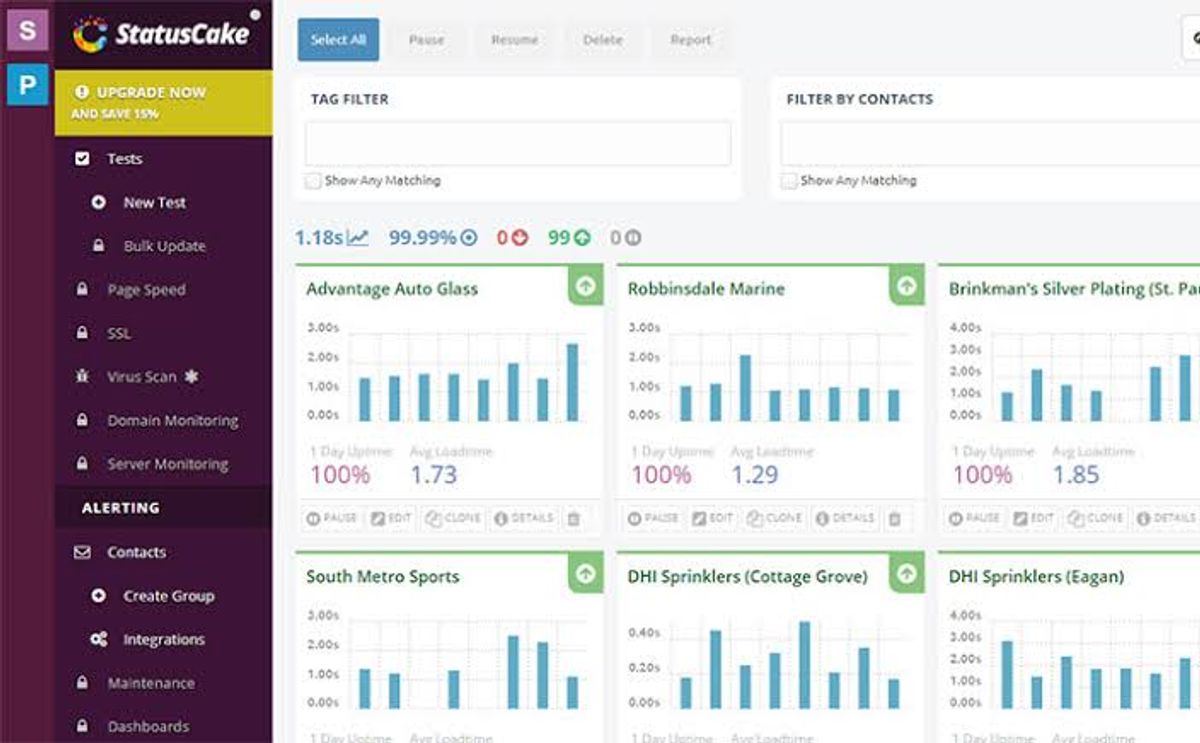
Best for: Agencies and small teams that want classic website monitoring without an observability suite
StatusCake stays close to UptimeRobot's point-tool model while widening website coverage. Its uptime tests include HTTP, TCP, SSH, DNS, SMTP, ping, and push checks; separate products cover page speed, SSL certificates, domain changes, and server resources. Paid accounts can choose relevant monitoring regions, and confirmation checks reduce alerts caused by a single transient failure.
The product is easy to shortlist for agencies managing many public sites. It provides reporting, integrations, and team features without requiring the telemetry architecture or query languages of a full observability platform. The flip side is depth: if your critical path is a multi-page checkout or login flow, a browser-first tool such as Checkly, Datadog, or Grafana Cloud is the stronger fit.
Pricing uses plan tiers that bundle monitor counts, test intervals, page-speed checks, domain checks, SSL checks, server monitors, and team access. There is a free plan and trials for paid tiers. Forecasting is straightforward if the bundle matches your mix, but unused allowances do not transfer between monitor types.
Worth exploring if: You need affordable uptime, page-speed, SSL, and domain monitoring across a portfolio of websites.
Give it a pass if: Scripted browser journeys or correlation with application telemetry is the reason you are leaving UptimeRobot.
6. Site24x7
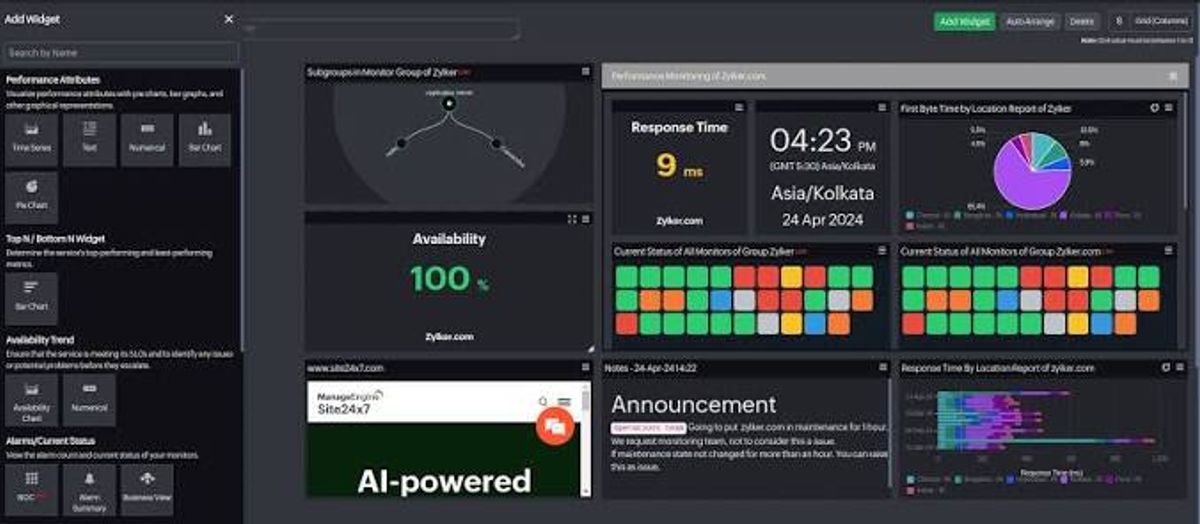
Best for: Mixed IT estates that need website monitoring plus infrastructure and network coverage
Site24x7 is the broad IT-operations choice. Alongside website uptime, it offers real-browser synthetic transactions, RUM, server and network monitoring, Application Performance Monitoring (APM), Kubernetes and cloud monitoring, logs, and cloud-cost tooling. That breadth makes it more plausible than a point tool when the same team owns public websites, branch networks, virtual machines, and business applications.
Its entry website plans include multiple sites, one-minute polling, global locations, users, integrations, and status pages. Synthetic transactions can validate real user workflows, while the surrounding platform provides more root-cause context than UptimeRobot. The tradeoff is product surface: monitor licenses, advanced monitors, transaction allowances, RUM page views, logs, and add-ons take more effort to evaluate than a single monitor-count tier.
Pricing is plan-and-pack based, with separate units for uptime monitors, synthetic transactions, RUM, and other modules. Public entry pricing and a 30-day trial make evaluation accessible, but model the full target estate before comparing headline prices.
Worth exploring if: One operations team needs to monitor websites, networks, servers, and applications from the same platform.
Give it a pass if: You value UptimeRobot chiefly for its narrow scope and want an equally simple replacement.
7. Datadog Synthetic Monitoring
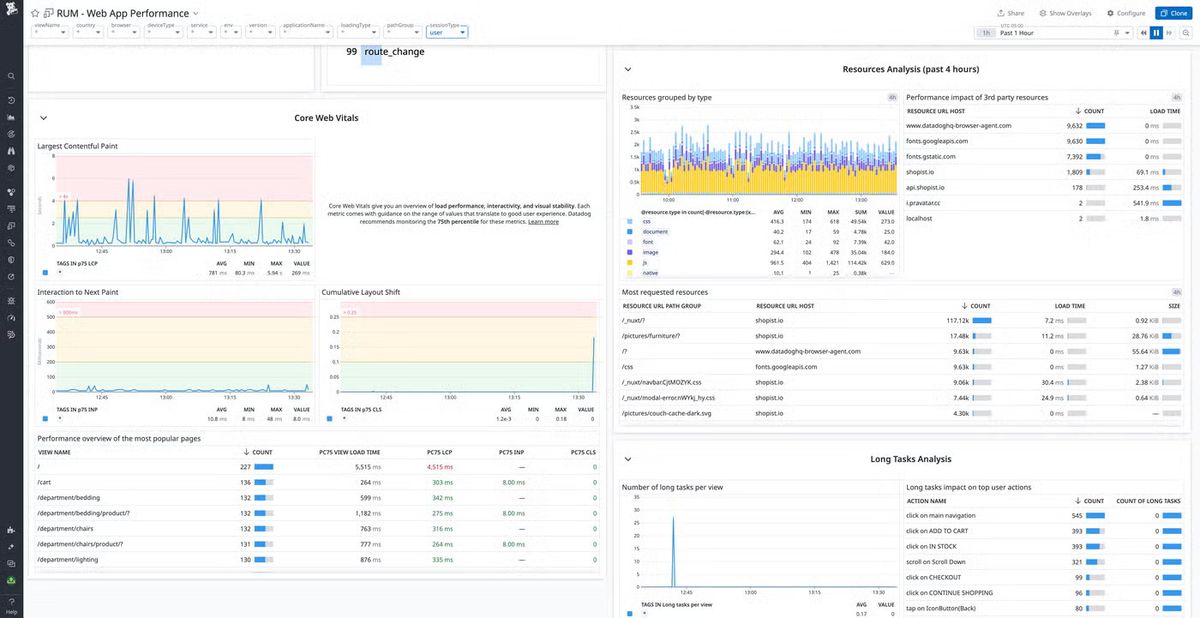
Best for: Datadog customers that want synthetic failures connected to APM, logs, infrastructure, and RUM
Datadog Synthetic Monitoring covers API, multistep API, browser, mobile, and network-layer tests. Its codeless browser recorder is useful for operations teams that need realistic user journeys without owning a Playwright codebase. Managed global locations handle public services, while deployable private-location workers can test internal endpoints.
The strongest reason to choose Datadog is correlation, not uptime checking in isolation. When the rest of your telemetry is already in Datadog, a failed synthetic test can lead into traces, logs, Session Replay, and infrastructure metrics without a second vendor. If you are not already standardizing on Datadog, that advantage weakens and a dedicated synthetic tool will usually be easier to scope.
Datadog bills API tests per 10,000 runs and browser tests per 1,000 runs; locations, frequency, multistep API requests, and long browser scenarios increase usage. Public pricing and a 14-day platform trial are available, but the total cost grows further when investigation requires separately metered APM, logs, RUM, or infrastructure products.
Worth exploring if: Datadog already holds the telemetry needed to explain a failed customer journey.
Give it a pass if: You only want low-cost uptime checks and do not plan to adopt the surrounding Datadog platform.
8. Grafana Cloud Synthetic Monitoring
Best for: Grafana and k6 users that need flexible scripted checks and private probes
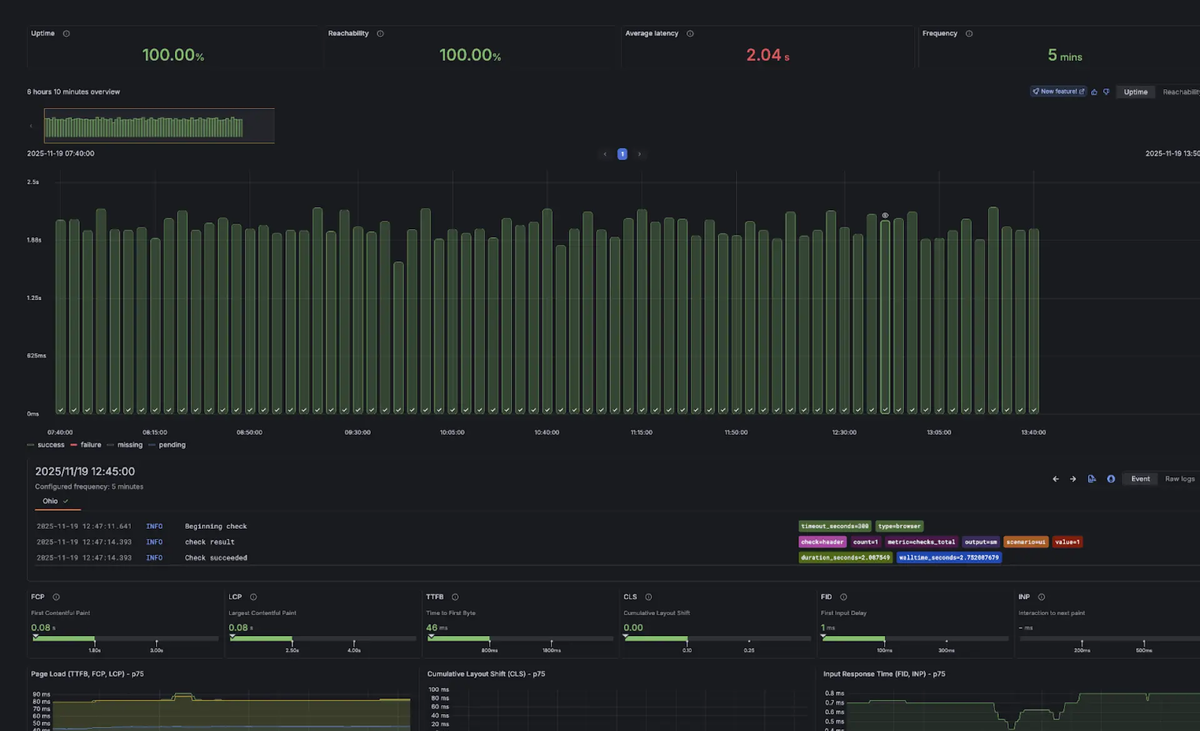
Grafana Cloud Synthetic Monitoring spans HTTP, ping, DNS, TCP, traceroute, multistep, scripted, and browser checks. The browser workflow uses k6 scripts, which suits teams already using k6 for performance testing or JavaScript-based test automation. Public probes cover external services, and private probes extend the same execution model to internal endpoints.
Its main advantage is the surrounding Grafana workflow. Synthetic results become metrics and logs that can feed dashboards and alerts beside Prometheus-style infrastructure data. That flexibility is valuable, but it asks buyers to understand checks, generated telemetry, dashboards, alerting, and the relevant query patterns. It is more of a monitoring platform than an UptimeRobot-style appliance, and it does not replace a dedicated public status-page product.
Grafana's billing documentation separates API and browser test executions. Frequency, location count, and test duration determine executions, while checks also generate metrics and logs. A free allowance exists; paid use sits inside Grafana Cloud's broader pricing structure.
Worth exploring if: Your team already operates Grafana and k6 and wants synthetics to use the same dashboards and alerting stack.
Give it a pass if: You want a lightweight monitor-and-status-page service with minimal query and telemetry management.
Comparison table
| Tool | Best fit | Browser checks | Response and status | Pricing model | Main tradeoff |
|---|---|---|---|---|---|
| Better Stack | Monitoring plus incident response | Playwright transactions | Native on-call and status pages | Responders, monitor packs, Playwright minutes, add-ons | Poor value if you do not use the response layer |
| Checkly | Monitoring as code | Playwright checks and suites | Alerts, integrations, and status pages | Monitor count plus API/browser runs | Tests require engineering ownership |
| Pingdom | Website performance operations | Transaction checks | Alerts and availability reporting | Uptime and advanced-check inventory | No permanent free tier; less code-centric |
| Dash0 | OTel-native API observability | HTTP/API checks are the current focus | Alerting integrations; no on-call or status page | API check runs plus telemetry consumption | Not a browser-journey or incident-comms suite |
| StatusCake | Multi-site website portfolios | Not its core workflow | Integrations, reporting, and team tools | Bundled plan tiers by test type | Limited application-level context |
| Site24x7 | Broad IT monitoring | Real-browser transactions | Alerts and included status pages | Plans, monitor packs, runs, and module add-ons | Larger product and pricing surface |
| Datadog | Existing Datadog estates | Codeless browser and mobile tests | Datadog monitors and incident integrations | API and browser runs plus telemetry products | Best value depends on broader Datadog adoption |
| Grafana Cloud | Grafana and k6 estates | k6 browser checks | Grafana alerting; no native status page | API/browser executions plus generated telemetry | More query and telemetry discipline required |
Read the "Browser checks" and "Response and status" columns as platform breadth, not as a ranking. Site24x7, Datadog, and Grafana Cloud win there because they bundle a synthetic product into a larger suite. Dash0's column reflects a narrower synthetic feature set today; its case rests on the "Pricing model" and "Main tradeoff" columns instead, where a failed check resolves against the same OpenTelemetry data your services already emit, with no second platform to correlate against.
Final thoughts
UptimeRobot alternatives fall into three useful groups. StatusCake and Pingdom stay close to website operations, with more performance or reporting depth. Better Stack and Checkly expand the workflow in opposite directions: Better Stack toward on-call and incident communication, Checkly toward developer-owned synthetic tests. Site24x7, Datadog, Grafana Cloud, and Dash0 make sense when a failed check needs to live inside a broader monitoring or observability system, but each adds operational and pricing dimensions that a point tool avoids.
Before migrating, inventory your monitor types, check intervals, locations, alert contacts, status-page subscribers, and retention needs. Then test the hard cases: authenticated APIs, multi-region failures, private services, browser journeys, alert escalation, and the path from a failed check to root cause. Finally, model cost using actual frequency, locations, retries, steps, browser duration, seats, and adjacent telemetry, not the smallest advertised plan. If browser journeys or incident communications dominate that list, Checkly or Better Stack is the more direct shortlist.
If the real gap is that a failed check tells you something is down without telling you why, and your services already emit OpenTelemetry data, that's the specific problem Dash0's synthetic monitoring is built to close. Start a 14-day Dash0 free trial, no credit card required, and point a check at an endpoint you already instrument. You'll see the failure land next to its own traces and logs instead of opening a second tool to find out what happened.