Rollbar watches your web, server, and mobile applications for exceptions. It groups occurrences into issues, ties them to deployments, and can attach a session replay to a JavaScript error. Its plans meter occurrences and let in as many users as you want, which is why it appeals to teams who want an error inbox and nothing more.
You usually start shopping when Rollbar stops covering one specific thing: mobile release health, wider application observability, self-hosting, Sentry SDK compatibility, or OpenTelemetry-native investigation. Billing can shorten the list too. Rollbar meters occurrences, replays, and AI credits, while the alternatives below charge for events, spans, sessions, hosts, seats, or raw telemetry volume, and those units behave very differently during an incident. So the right replacement depends on which part of Rollbar you actually use.
Quick picks
| Tool | Best fit |
|---|---|
| Sentry | Web teams that live in stack traces and want replay and release context |
| BugSnag | Mobile teams that decide rollouts by stability and adoption numbers |
| Dash0 | OpenTelemetry teams that debug errors inside the surrounding telemetry |
| Honeybadger | Small web teams that want errors, uptime, and cron checks on one bill |
| Raygun | Frontend and mobile crash diagnostics with user impact attached |
| GlitchTip | Anyone who wants Sentry SDKs pointed at their own servers |
| Datadog | Enterprises folding error tracking into a platform they already run |
What to look for in a Rollbar alternative
Feature matrices will not settle this. What follows is what I have seen actually change the answer once a candidate is running against real traffic.
-
Grouping comes first. Throw your noisiest exceptions at it and look at the inbox afterward. Then check ownership, regression detection, bulk actions, deploy correlation, and how much control you get over alerts. A long feature list matters less than whether the inbox is still usable on a bad day.
-
Count the instrumentation work. Moving to a proprietary SDK means touching every service. Sentry-compatible backends and OpenTelemetry cut that down, though your saved queries, dashboards, alerts, and on-call habits still have to move by hand.
-
Frontend and mobile need separate proof: source maps, native symbols, release health, affected users, breadcrumbs, replay. If you ship apps, test the release adoption and stability workflow yourself. A web-focused tracker rarely translates cleanly.
-
Decide whether you want a dedicated tracker or errors sitting next to traces, logs, real user monitoring (RUM), and infrastructure data. Broader platforms make investigation easier and configuration and billing worse.
-
SaaS costs the least operationally. Self-hosting buys you data residency and control, and hands you upgrades, retention, backups, and a database to keep alive.
-
Model two months, a boring one and one with an error storm. Look past the base tier at event and span quotas, overages, sampling, retention, seat costs, rate limits, and whether you can throttle ingestion before a spike turns into an invoice.
1. Sentry
Best for: Web and product teams that want the closest thing to Rollbar with more depth behind it
Sentry is the obvious first stop. You keep the dedicated issue workflow and get tracing, release health, user feedback, profiling, and session replay on top of it. Grouping runs on default algorithms you can override with custom fingerprints, and an issue can link straight to a replay of the session that broke and to the suspect commit. That combination is hard to beat when you are reproducing a frontend failure or working out which change caused a regression.
The cost is breadth, in the product and on the invoice. Sentry pricing splits errors, logs, application metrics, spans, replays, monitors, profiling, and its AI debugger into separate quotas or add-ons. Users are unlimited, pricing is public, and the free developer plan makes a proof of concept painless. Forecasting gets harder once four or five of those meters start growing at different rates.
Worth exploring if: You want Rollbar-style triage with better frontend debugging, replay, and release context behind it.
Give it a pass if: One occurrence meter is exactly what you like about Rollbar, and you have no use for the adjacent products.
2. BugSnag
Best for: Mobile and client application teams that ship by stability numbers
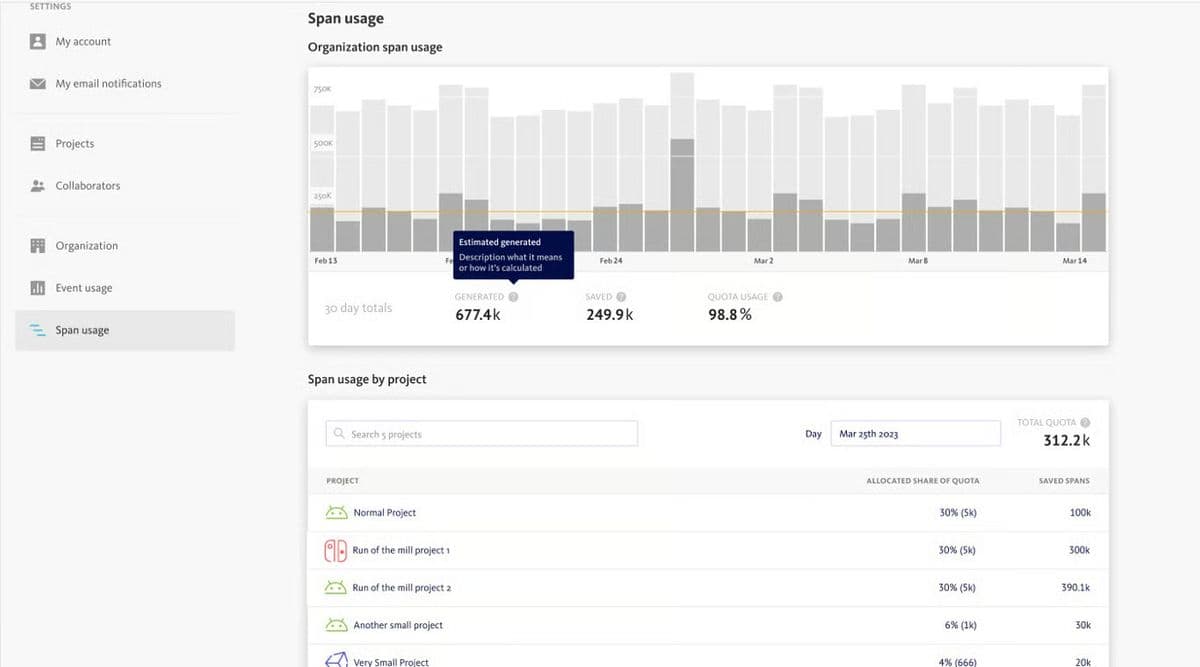
If most of your errors come from phones, start here. The inbox groups crashes and exceptions like everything else here, but the release workflow is what sets it apart: compare versions, watch adoption, set a stability target, and slice errors by device or customer. Its public feature and pricing matrix also spells out source map and symbol file handling per platform, which saves you a sales call.
Error events and performance spans are metered separately. There is a free plan and a 14-day trial, paid plans include unlimited users, and automatic prioritization, advanced segmentation, SAML, and some stability capabilities live on higher tiers. Event bursts and span sampling are what you need to model. On-premises exists for enterprise buyers, but you will not find it in the self-serve plans.
Worth exploring if: Crash-free sessions, release adoption, and stability targets matter more to you than adding an infrastructure monitoring platform.
Give it a pass if: Session replay is where you spend your debugging time, or you want the easiest path to self-hosting.
3. Dash0
Best for: OpenTelemetry teams that want errors investigated next to logs, traces, metrics, and web events
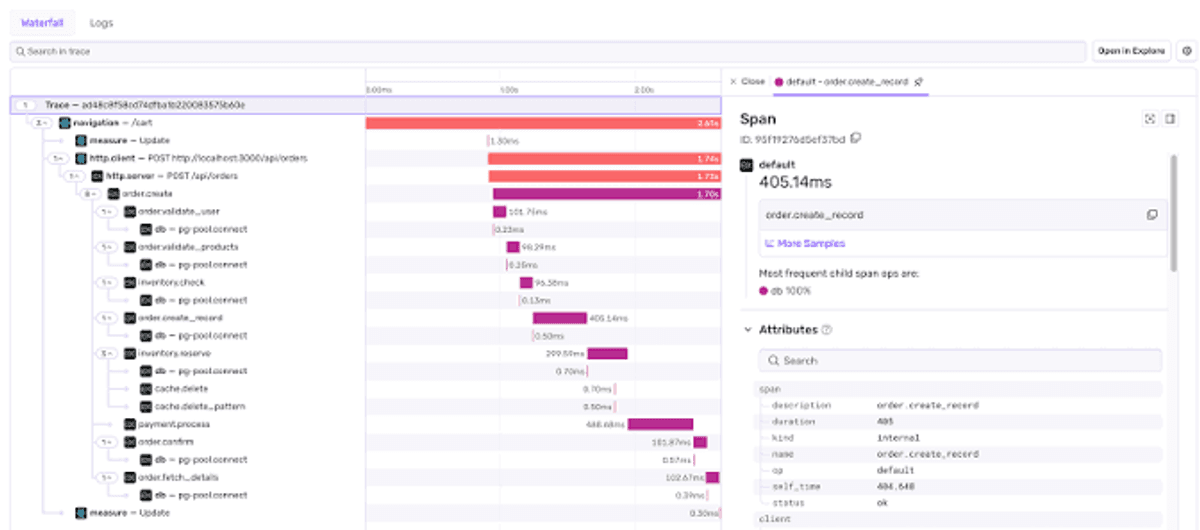
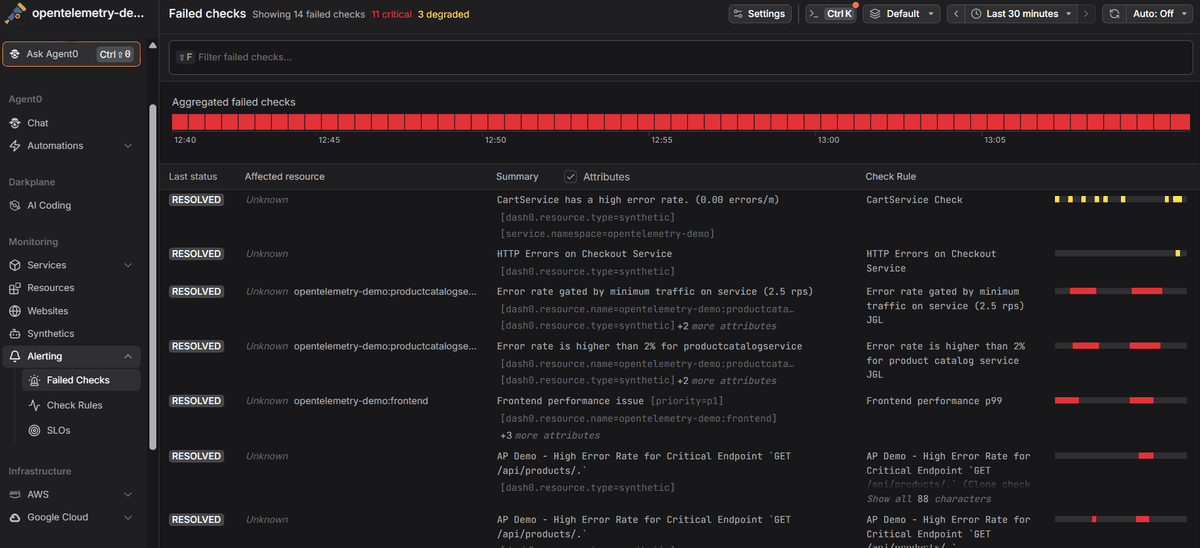
Dash0 is here for teams rethinking the standalone inbox altogether. OpenTelemetry exceptions arrive as span events attached to the trace that produced them, and you can convert those events into logs you can query on their own. The Web SDK picks up unhandled JavaScript exceptions and promise rejections, and the Web Events workflow adds filtering, grouping, attribute-based triage, and source map translation. Alerting runs on PromQL, so an error spike can be a check against spans, logs, metrics, or web events.
Pricing is consumption-based: metric data points, spans and span events, log records, web events. Rates are published, the 14-day trial is unlimited, and there are no host or seat meters on the rate card. Ingestion filters drop low-value telemetry before it reaches storage or your bill. If you know your event volumes, the math is straightforward. Verbose logs and unsampled traces will still cost you.
Worth exploring if: You are standardizing on OTLP and want portable instrumentation with one place to investigate.
Give it a pass if: You need a prescriptive issue inbox, a mature ownership workflow, or session replay. Sentry or BugSnag will suit you better.
4. Honeybadger
Best for: Small and midsize web teams tired of paying four vendors
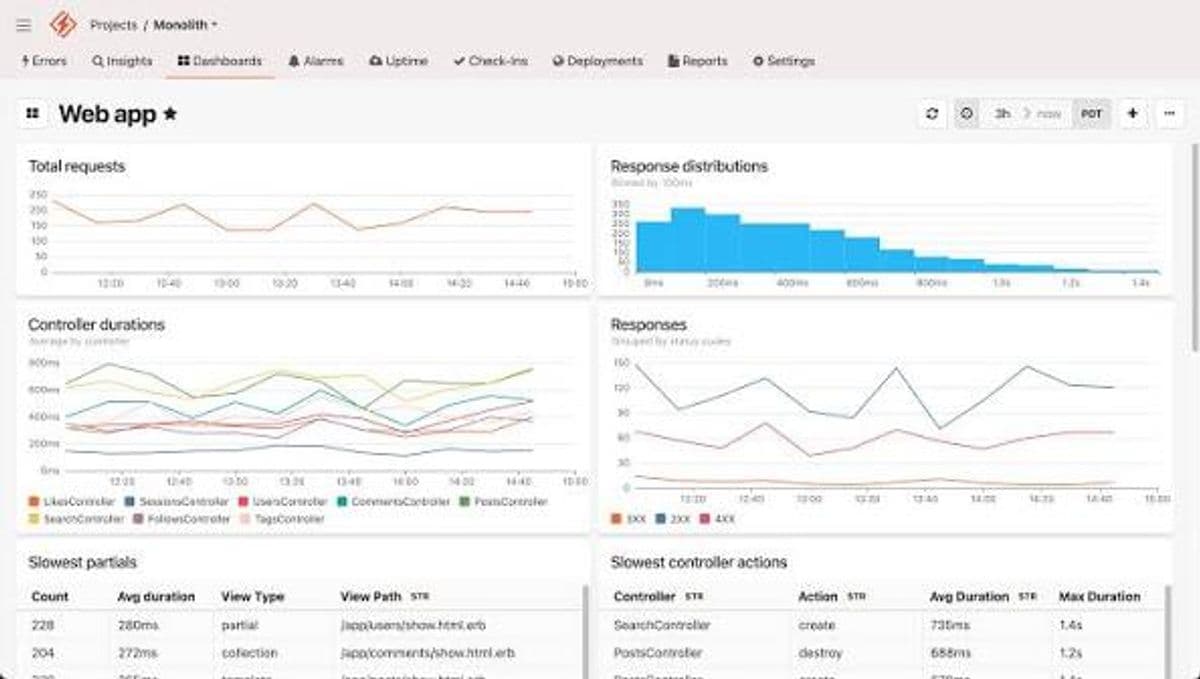
Honeybadger bundles error tracking with just enough operations tooling to retire a few small subscriptions. The documentation covers application errors, logs and APM, uptime checks, scheduled task check-ins, deployments, and status pages. Error reports carry stack traces and breadcrumbs, and you can tell it to resolve an issue on your next deploy. For a web application that needs exception triage plus basic production monitoring, that is a sensible amount of product.
Plans bundle a monthly error allowance, daily logging and performance ingest, uptime monitors, status pages, retention, and unlimited users on team tiers. Pricing is public, there is a free developer plan, and team plans get 30 days to prove themselves. Costs climb through error volume, daily ingest, and extra monitoring capacity. Three meters instead of twelve.
Worth exploring if: You want errors, uptime, cron monitoring, deploy context, and a public status page on one account.
Give it a pass if: Mobile release stability, native crash analytics, or session replay is the center of your workflow.
5. Raygun
Best for: Frontend and mobile teams that need to know which users hit the crash
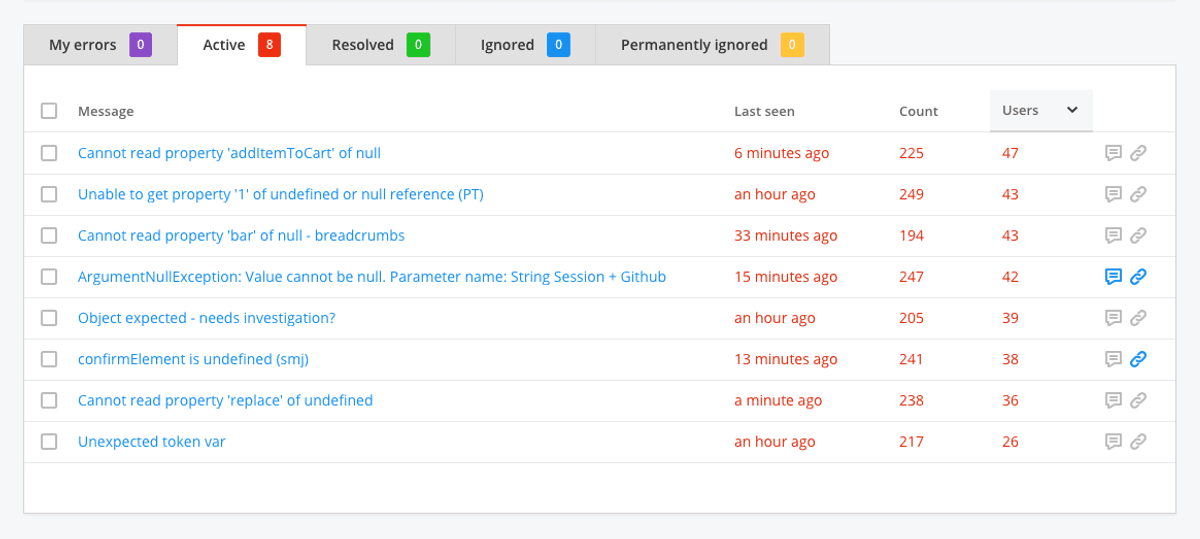
Raygun Crash Reporting is a dedicated error tracker for client and server applications, built around impact. It groups crashes, exposes diagnostic context, and tells you who was affected. Deployment Tracking ties error groups to versions and commits so new and regressed errors surface after a release, and source map support gives you readable JavaScript stack traces back.
The commercial model is modular. Crash Reporting is priced on reserved monthly errors with on-demand overage, and real user monitoring is billed separately by session. Applications and team members are unlimited, and annual reserved capacity can carry events across a seasonal dip. The forecasting risk is running two or three Raygun products at once, or blowing past your reserved error volume. There is a 14-day trial and no permanent free tier on the published Crash Reporting plan.
Worth exploring if: Customer impact, frontend diagnostics, and tying errors back to a release decide it for you.
Give it a pass if: You would rather have errors, traces, logs, and infrastructure signals under one consumption model than separate product meters.
6. GlitchTip
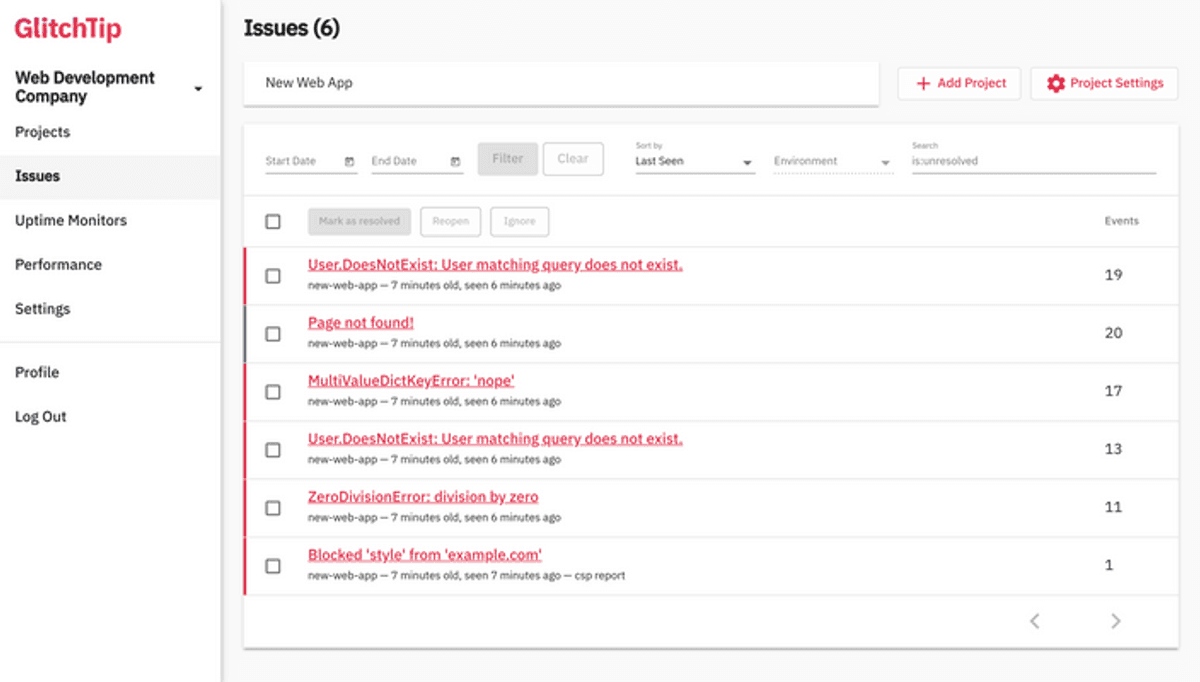
Best for: Teams that want Sentry SDK compatibility, open source code, or their own servers
Of everything on this list, GlitchTip changes the most while still leaving you with a familiar error inbox. It accepts events from Sentry SDKs, groups them into issues, handles alerts and source maps, and adds performance, logs, and uptime monitoring. Its integration documentation targets Sentry API compatibility on purpose, so if you already run Sentry SDKs you can usually change the DSN and be done instead of re-instrumenting every service.
Use the hosted service or run GlitchTip yourself on PostgreSQL with optional Valkey. Hosted pricing works from a shared event allowance across errors, uptime checks, performance transactions, and release file storage, with a free tier and public fixed plans. Self-hosting swaps the subscription for infrastructure and someone's time. One caveat worth knowing early: the SDK guidance says session tracking is not supported, so this is not a replacement for Rollbar's replay workflow.
Worth exploring if: Data control or an easy exit from Sentry SDKs matters more to you than the deepest commercial feature set.
Give it a pass if: You need session replay, serious mobile release health, or you have no appetite for owning a database and its upgrade path.
7. Datadog
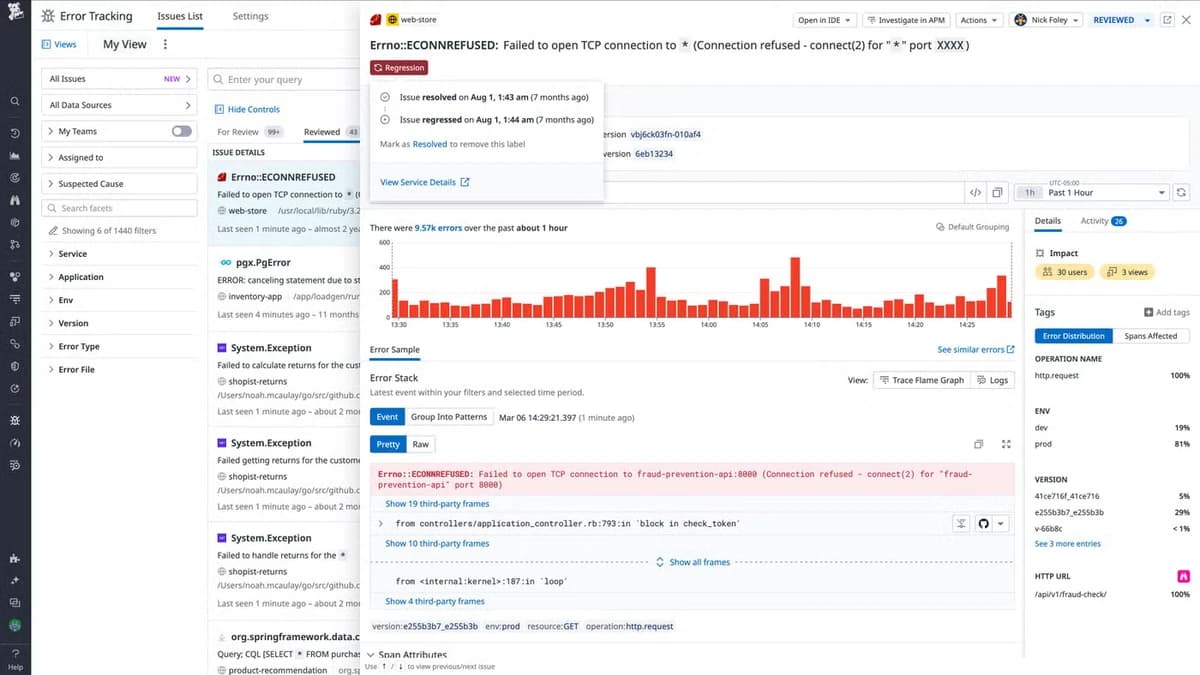
Best for: Organizations standardizing application, infrastructure, security, and incident telemetry in one place
Datadog is the broad platform option. Error Tracking groups exceptions from APM traces, RUM sessions, standalone frontend events, and logs into issues, and custom fingerprints let you override the default grouping on service, type, message, and stack. If the surrounding Datadog products are already running, you can pivot from an issue to the traces, logs, user sessions, hosts, and deployments around it without leaving the vendor. That is a genuine advantage, and nothing else here matches it. OpenTelemetry data comes in through the OTLP intake, but the deeper workflows still assume the Datadog Agent and Datadog's own data model, so OTLP ends up being a delivery mechanism into Datadog rather than the native format.
Breadth is also the bill. Datadog pricing meters standalone Error Tracking by monthly errors. Errors already collected through paid APM or RUM come included. Log-based tracking depends on how you index logs. APM hosts, ingested and indexed spans, RUM sessions, logs, custom metrics, and every other module keep their own meters. Public pricing, trials, inclusion and exclusion rules, and rate limits all help, but you are modeling the whole adopted surface, not just the error inbox.
Worth exploring if: You already run Datadog, or you want one vendor for errors and everything around them.
Give it a pass if: You want a light tracker with a small billing surface and no platform commitment.
Comparison table
| Tool | Best fit | Main strength | Main tradeoff | Pricing model | Deployment |
|---|---|---|---|---|---|
| Sentry | Web and product teams | Code, release, and replay context | Many quotas and add-ons | Base plan plus usage by signal | SaaS, self-hostable distribution |
| BugSnag | Mobile and client apps | Stability and release adoption | Advanced capabilities are tiered | Error events plus performance spans | SaaS, enterprise on-premises |
| Dash0 | OpenTelemetry stacks | Correlated OTLP telemetry, simple units | Less prescriptive than an inbox | Consumption by signal record | SaaS |
| Honeybadger | Small web teams | Errors plus uptime, cron, status pages | Weaker on mobile and replay | Tiered errors, ingest, monitors | SaaS, custom by inquiry |
| Raygun | Frontend and mobile | User impact and deploy context | Crash Reporting and RUM meter apart | Reserved errors, sessions separately | SaaS |
| GlitchTip | Self-hosting and data control | Sentry SDK compatibility | You run it, no session tracking | Hosted event tiers or your own infra | SaaS or self-hosted |
| Datadog | Enterprise consolidation | Cross-signal platform breadth | Large product and billing surface | Errors plus adopted product meters | SaaS |
Final thoughts
The alternatives split into three groups. Dedicated trackers keep the inbox and compete on what surrounds it: web debugging at Sentry, mobile stability at BugSnag, bundled uptime at Honeybadger, user impact at Raygun. GlitchTip gives up some commercial depth for Sentry SDK compatibility and data you host yourself. Datadog and Dash0 both treat an error as one signal in a larger investigation, from opposite directions: Datadog through enterprise standardization on its own model, Dash0 through OpenTelemetry collection and a smaller set of billing units.
Before you replace anything, run a proof of concept on the ugly stuff. Representative error storms, minified frontend builds, native crashes, a real deployment. Measure grouping quality, source map and symbol processing, alert noise, how cleanly ownership hands off, and how many clicks it takes to get from an alert to a plausible root cause. Then run that same traffic through every vendor's billing units, traces and logs and sessions and retention and overages included, not just the base plan. If OTLP portability and correlated investigation are what you are after, the Dash0 free trial will tell you quickly. Give it a go and decide for yourself. No credit-card required.