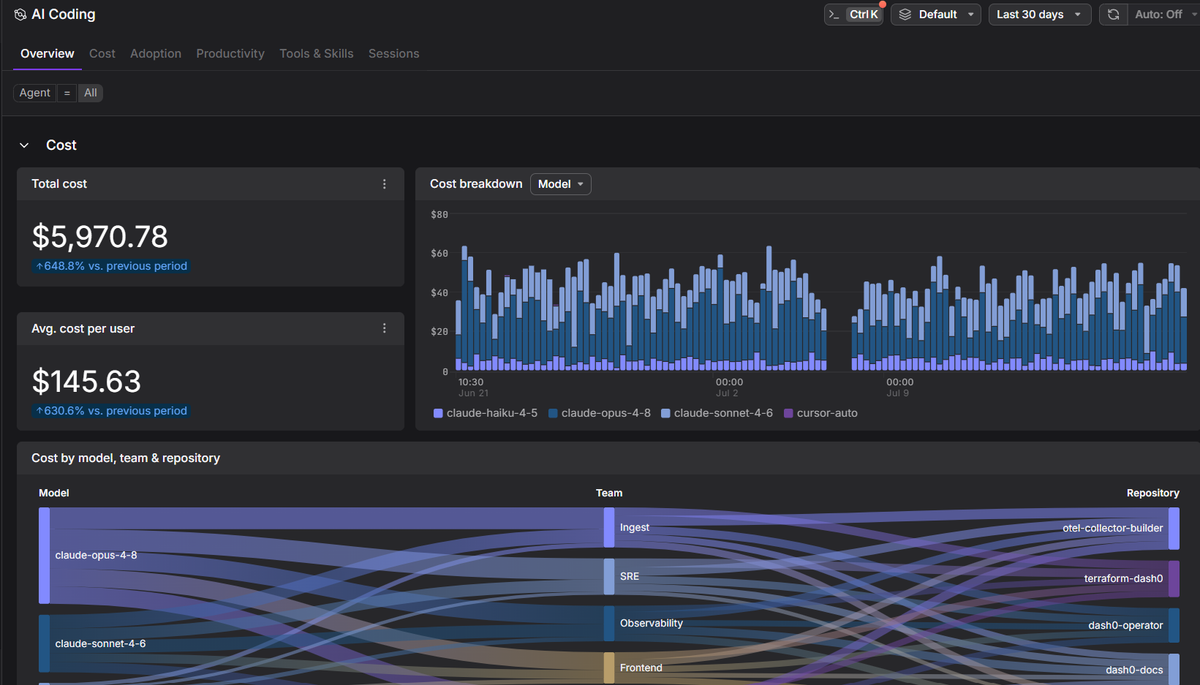
LogRocket is a frontend-first debugging platform. Its session replay pairs visual playback with console output, network activity, errors, performance data, and Redux state, giving web and mobile teams unusually strong evidence for reproducing client-side failures. It can connect a replay to backend tooling, but that workflow is integration-led: teams pass a session URL into backend logs or follow links between LogRocket and a separate tracing product.
The LogRocket alternatives in this guide are for teams that want a tighter path from a broken interaction to the service, query, or infrastructure dependency that caused it. Some preserve visual replay; others replace playback with structured browser events and distributed traces. That is the central tradeoff. If pixel-perfect replay is non-negotiable, the shortlist is small. If frontend-to-backend trace continuity matters more, full-stack observability platforms become credible alternatives even when they do not reproduce the screen.
Quick picks
| Tool | Best fit |
|---|---|
| Sentry | Developer teams that want error-first triage with replay, releases, and backend context |
| Datadog | Organizations standardizing RUM, replay, APM, logs, and infrastructure on one platform |
| Dash0 | OpenTelemetry teams that need session timelines and backend traces rather than visual playback |
| New Relic | Teams that want web replay and Browser-to-APM tracing under an ingest-based model |
| Dynatrace | Large enterprises that need governed web and native-mobile replay across complex estates |
| ClickStack (HyperDX) | OpenTelemetry teams that want open-source replay, logs, and traces in ClickHouse |
| Elastic Observability | Existing Elastic users prioritizing browser-to-service tracing and log search over replay |
What to look for in LogRocket alternatives for frontend-to-backend debugging
-
Verify whether "session" means DOM or video-like playback, a chronological event stream, or only an identifier attached to telemetry. These are different debugging experiences, and they answer different questions.
-
Trace continuity is the part teams underestimate. Test whether a browser request actually carries W3C trace context into every relevant backend hop. A replay link inside a log entry is convenient, but it's not the same as navigating a single distributed trace.
-
Look for source maps, issue grouping, release and commit data, request details, console logs, and ownership workflows. Replay shows the symptom; this is what shortens the path to the responsible code.
-
Proprietary browser and server agents can deliver deeper automation, while OpenTelemetry keeps more of the collection and transport work portable. Either way, dashboards, alerts, queries, replay data, and operating procedures create switching costs once you're in.
-
Review capture-time masking, payload filtering, consent, regional storage, RBAC, and self-hosting. Browser telemetry can expose DOM text, URLs, request content, and user identifiers if these controls are configured poorly.
-
Pricing unit matters more than headline price. Model sessions, replays, events, ingested bytes, hosts, seats, retention, and query compute against your real traffic. A platform can look inexpensive in RUM and still become hard to forecast once APM, logs, and infrastructure get added.
1. Sentry
Best for: Engineering teams that investigate from an error, release, or suspect commit
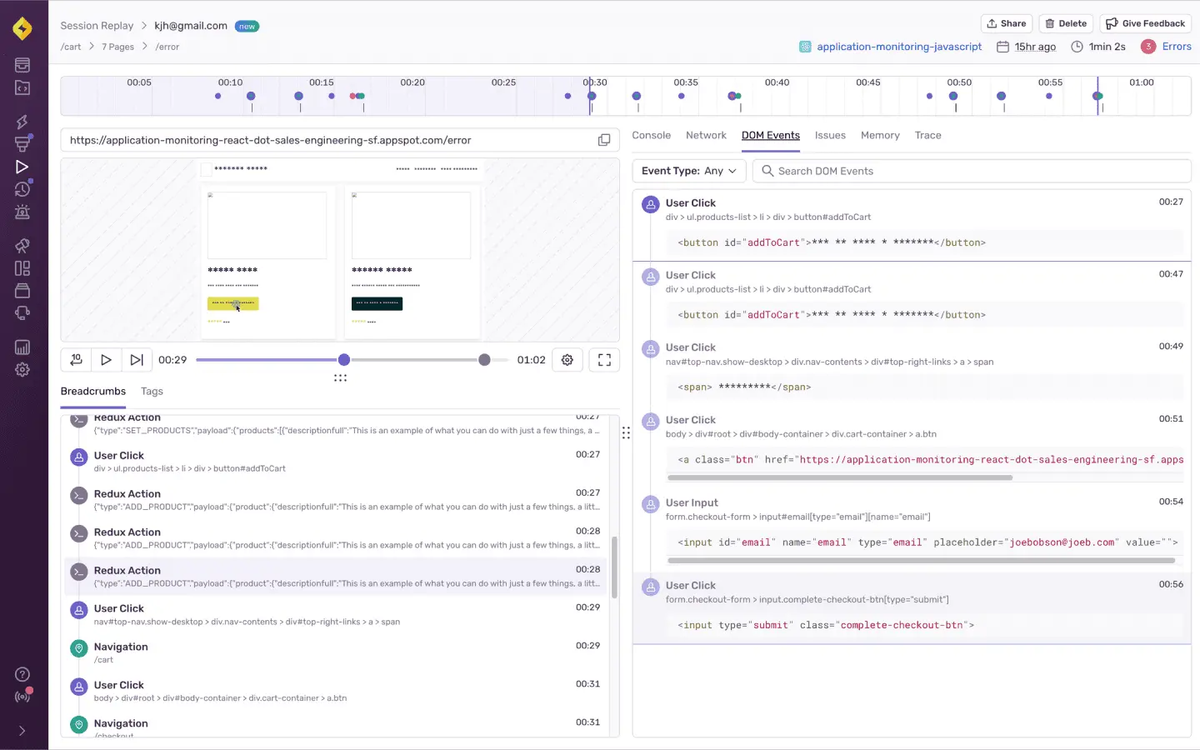
Sentry is the closest error-first replacement for LogRocket. It groups exceptions into issues, resolves source maps, tracks releases, and attaches browser or native-mobile replay to the failure context. Replays can also be associated with backend errors, allowing an engineer to move from what the user did to the service-side issue without manually matching timestamps.
Its strength is code ownership and triage rather than broad infrastructure operations or product analytics. Sentry tracing can connect frontend and backend spans, but teams seeking host, Kubernetes, database, security, and network monitoring under the same vendor will find Datadog or Dynatrace broader. Pricing is public and includes a free developer plan. Paid plans add separate quotas or usage meters for errors, replays, spans, logs, profiles, monitors, and AI features, so incident bursts and wider product adoption are the main forecasting variables.
Worth exploring if: You want LogRocket-style reproduction context inside a stronger issue, release, and code-triage workflow.
Give it a pass if: Your main goal is consolidating frontend, backend, infrastructure, and security operations into one platform.
2. Datadog
Best for: Teams that want the broadest managed path from session replay to production infrastructure
Datadog combines browser and mobile RUM with Session Replay, Error Tracking, APM, logs, profiles, and infrastructure monitoring. Its RUM workflow can connect a user session to the exact backend traces, logs, and service dependencies involved in a slow or failed request. For an existing Datadog customer, that native correlation is the strongest reason to replace LogRocket rather than integrate it.
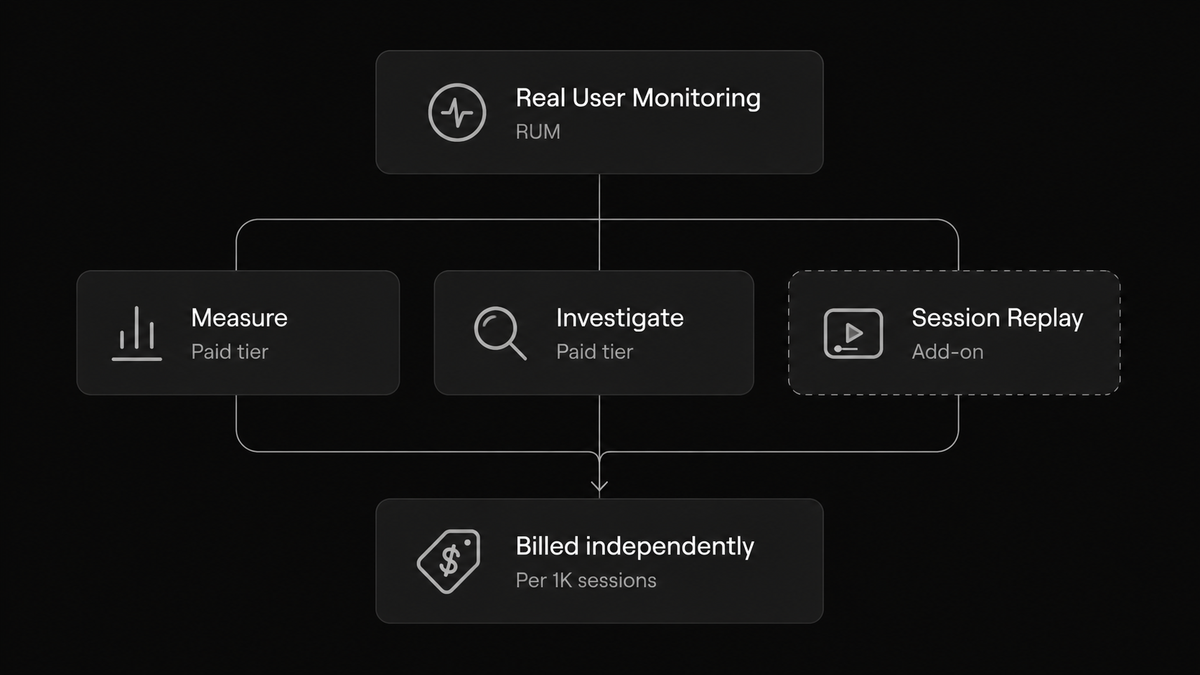
The tradeoff is the size of both the product and the invoice. RUM sessions and replay have their own billing units, while APM, infrastructure, logs, custom metrics, synthetics, profiles, and other modules add separate meters. This supports selective adoption, but an elastic application can drive several dimensions at once. Datadog publishes pricing and offers a trial; model retained RUM sessions, replay sampling, indexed logs, APM hosts or spans, and custom metrics together. Its OpenTelemetry support can ease collection, although queries, dashboards, monitors, and investigation workflows remain Datadog-specific.
Worth exploring if: Your organization already uses Datadog or is deliberately consolidating observability around it.
Give it a pass if: You want a focused debugging tool with a small billing surface and little platform commitment.
3. Dash0
Best for: OpenTelemetry teams that value browser-to-backend trace continuity more than visual replay
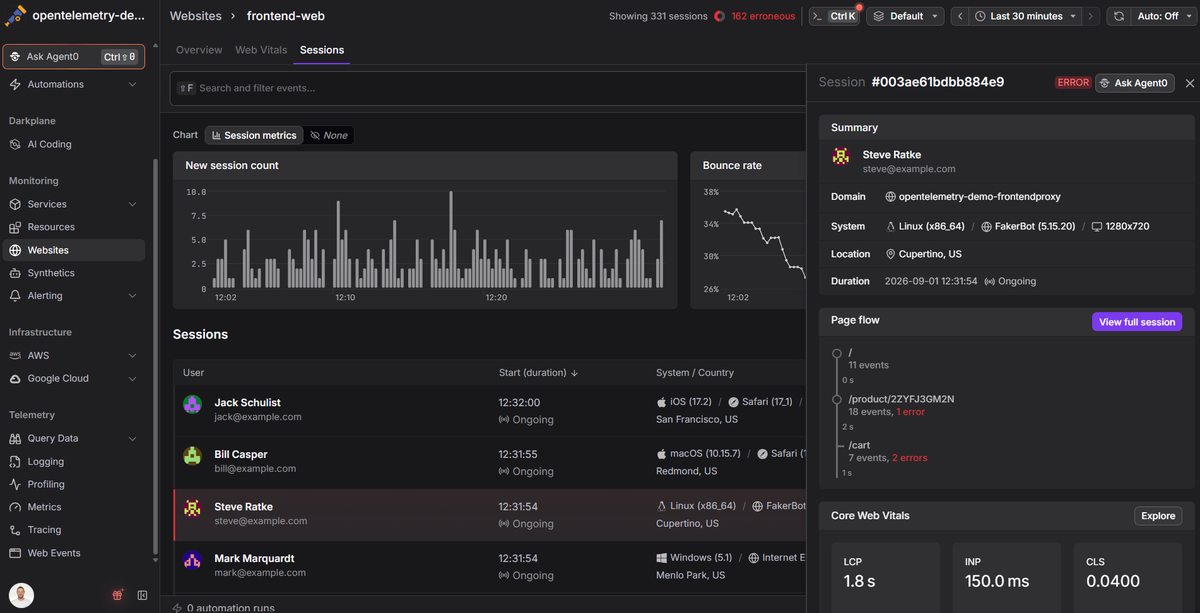
Dash0 Website Monitoring uses an OpenTelemetry-compatible Web SDK to capture page views, Core Web Vitals, HTTP requests, JavaScript errors, custom events, and session context. A browser request can propagate trace context into an instrumented backend, letting an engineer move from the user’s session timeline into the distributed trace, logs, and downstream calls behind it. OpenTelemetry keeps more instrumentation and transport work portable, although saved queries, dashboards, alerts, and investigation workflows remain vendor-specific.
Dash0 is not a drop-in LogRocket replacement. Its current session view is an event and page-flow timeline, not pixel-perfect DOM playback, and it does not provide native-mobile replay or LogRocket’s product-analytics depth. Pricing meters web events and other telemetry records rather than sessions, without separate seat or platform fees. That is straightforward to forecast from signal volume, but chatty browser or backend instrumentation still raises consumption. A 14-day no-card trial is available.
Worth exploring if: Your real problem is following a frontend failure across OpenTelemetry-instrumented services with fewer tool boundaries.
Give it a pass if: Watching a visual replay or debugging native-mobile sessions is non-negotiable.
4. New Relic
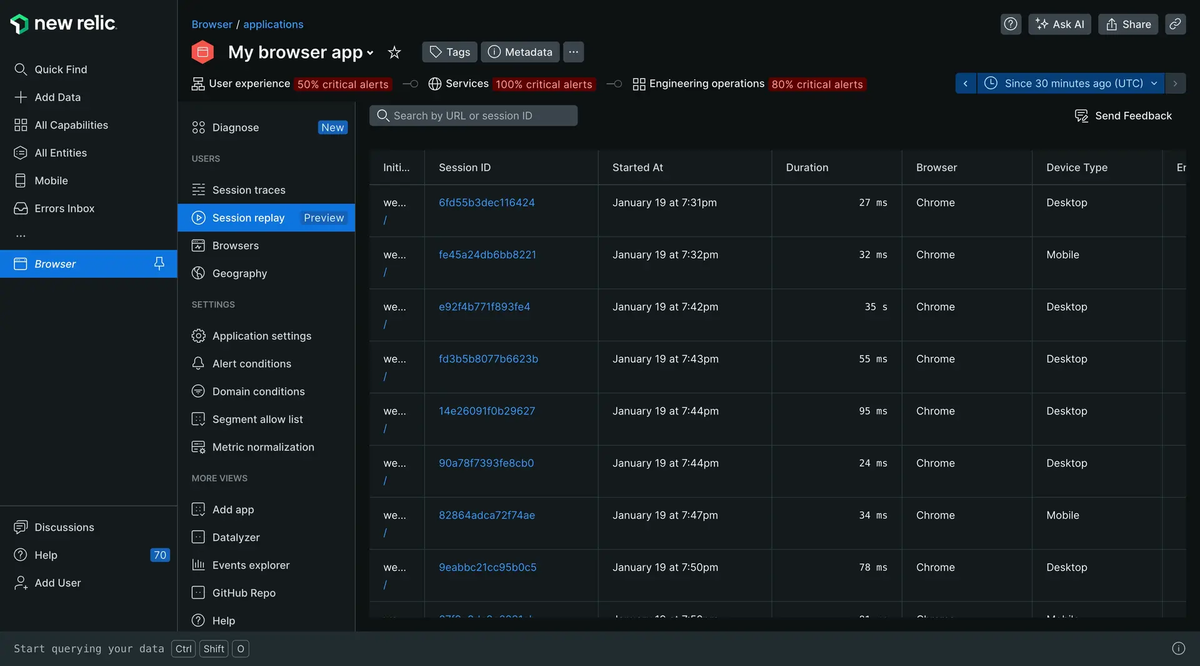
Best for: Web teams that want Browser, replay, logs, and APM under a data-ingest model
New Relic’s browser agent captures JavaScript errors, AJAX timing, web vitals, console logs, and distributed tracing. Session Replay adds DOM-based playback, while Browser monitoring connects frontend requests to backend services instrumented with New Relic APM. Separate sampling controls for ordinary and errored sessions let teams preserve failure evidence without replaying the same percentage of healthy traffic.
The replay capability is for web frontends, so New Relic does not replace LogRocket’s native-mobile playback. Replay bytes also enter the same consumption model as other browser data; volume varies with session length, activity, sampling, and DOM complexity. New Relic pricing combines data ingest with user or compute access and includes a no-card free tier. This can be easier to forecast than per-session billing when the team already knows its telemetry volume, but verbose data and a large debugging audience can raise both sides of the bill.
Worth exploring if: You already operate New Relic APM and want web replay to join the same trace and query workflow.
Give it a pass if: Native-mobile replay or replay-centric product analytics is a hard requirement.
5. Dynatrace
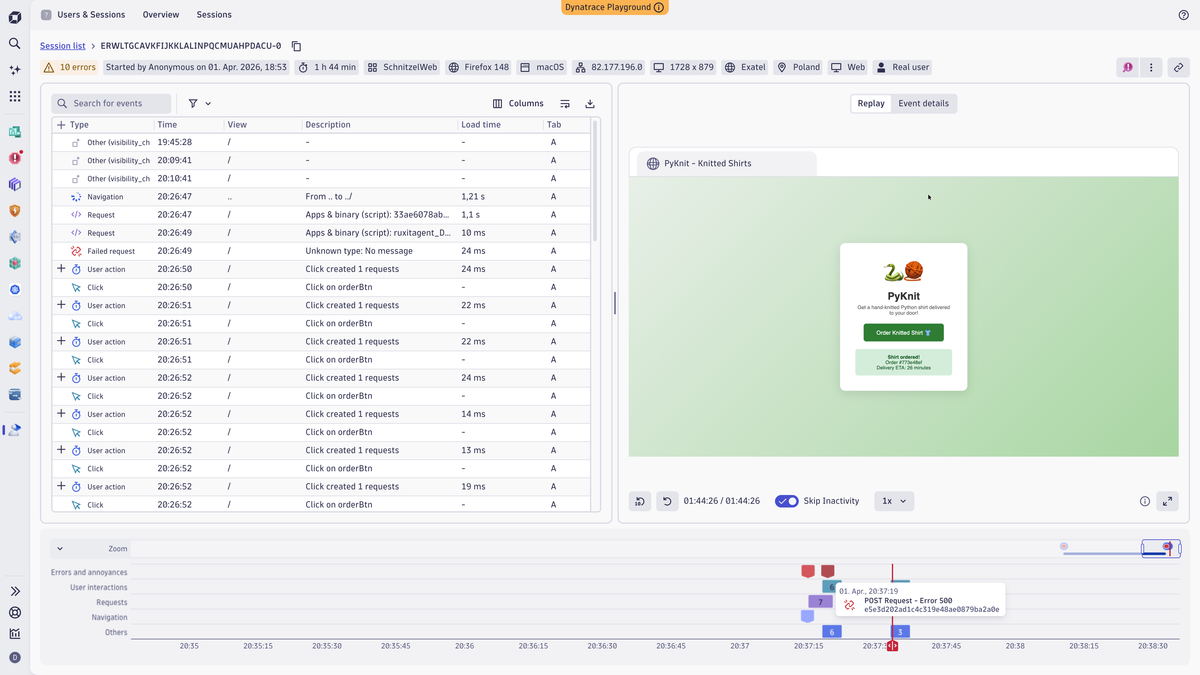
Best for: Large enterprises that need web and native-mobile evidence tied to governed full-stack observability
Dynatrace combines RUM and Session Replay across web, Android, and iOS with backend and infrastructure observability. Its frontend-backend linking can use W3C trace context to connect fetch and XHR activity to traces collected by OneAgent or OpenTelemetry. Capture-time and playback masking, opt-in recording, URL exclusions, and granular permissions make it a strong fit where session data requires formal governance.
That depth comes with a heavier rollout than LogRocket. OneAgent configuration, RUM policies, trace propagation, access controls, and platform conventions require ownership. Native-mobile replay also has framework and version limits; current iOS and Android guidance excludes cross-platform frameworks such as React Native and Flutter. The Dynatrace rate card meters ordinary RUM sessions, replay-enabled sessions, and session properties, while backend, log, infrastructure, automation, and data usage introduce additional units. Public rates help, but buyers still need a platform-wide forecast.
Worth exploring if: Enterprise governance, web and native-mobile coverage, and automated topology justify a broad observability deployment.
Give it a pass if: You need a quick replay-only rollout or depend heavily on unsupported cross-platform mobile frameworks.
6. ClickStack (HyperDX)
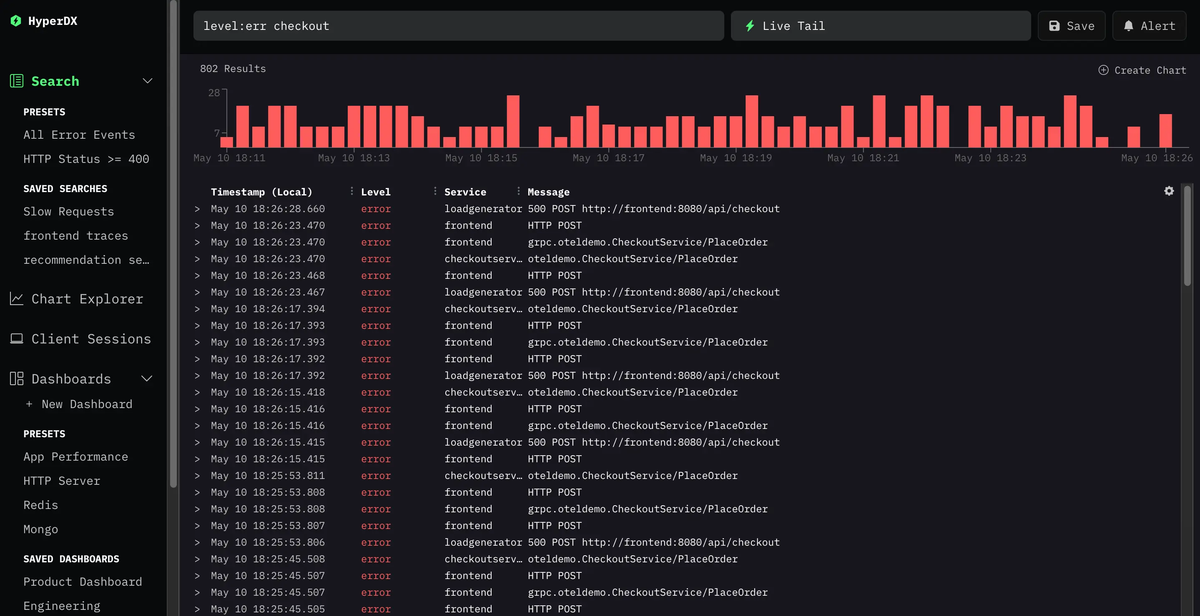
Best for: Teams that want session replay and backend telemetry in an open-source, OpenTelemetry-native stack
ClickStack combines an opinionated OpenTelemetry Collector, ClickHouse storage, and the HyperDX interface. Unlike observability tools that stop at browser events, it stores session replays beside logs, metrics, traces, and errors. That gives it an unusually direct answer to this comparison: engineers can keep visual evidence while querying the backend telemetry in the same system, using Lucene-style search or SQL.
The open-source distribution offers control, but production operations include the Collector, ClickHouse capacity, retention, upgrades, backups, and access control. Managed ClickStack removes much of that work through ClickHouse Cloud. Its commercial model is infrastructure-based rather than per event, host, or seat: compute, storage, backups, and data transfer drive cost, and a 30-day cloud trial is available. This is predictable when storage and query patterns are known, but expensive queries or always-on compute can still surprise you. ClickStack is also a younger, less opinionated RUM and error-triage experience than Sentry, Datadog, or Dynatrace.
Worth exploring if: You want one inspectable stack for replay and high-cardinality OpenTelemetry data, with self-hosted and managed paths.
Give it a pass if: Your team wants turnkey SaaS workflows and does not want to own ClickHouse concepts or evaluate a newer product surface.
7. Elastic Observability
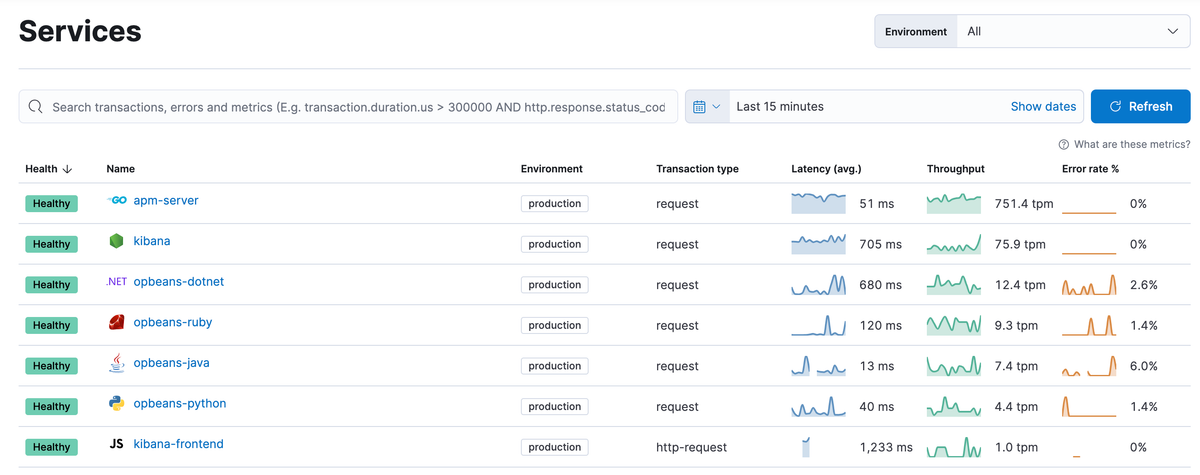
Best for: Elastic users who want browser errors and requests correlated with backend APM and searchable logs
Elastic’s RUM JavaScript agent captures page-load timing, web vitals, fetch and XHR activity, user interactions, and JavaScript errors. It supports distributed tracing for outgoing requests, allowing browser activity to join backend APM traces and the surrounding Elasticsearch data. This makes Elastic credible when investigations already begin with a request ID, log field, or Kibana query.
Elastic does not provide LogRocket-style visual session replay, so it replaces the trace-and-search portion of the workflow rather than the screen reconstruction. Its RUM agent also requires a centralized APM Server and is currently not compatible with Elastic Cloud Serverless, making Hosted or self-managed deployments the relevant paths. Elastic Cloud pricing is driven by provisioned or consumed platform resources, data storage, retention, and support; self-managed deployments shift the bill toward infrastructure and operators. A free cloud trial is available.
Worth exploring if: Elasticsearch and Kibana are already your operational center of gravity and visual replay is optional.
Give it a pass if: You need session playback or want the lowest-effort greenfield frontend-observability setup.
Comparison table
| Tool | Visual replay | Frontend-to-backend link | Best fit | Pricing model | Deployment |
|---|---|---|---|---|---|
| Sentry | Web and native mobile | Errors and distributed traces | Error-first developer triage | Base plan plus signal usage | SaaS; community self-hosting |
| Datadog | Web and mobile | Native RUM, APM, logs, and infrastructure | Managed platform consolidation | Sessions plus adopted product meters | SaaS |
| Dash0 | No; event timeline | OpenTelemetry trace context | OTel-native correlation | Web events and other telemetry records | SaaS |
| New Relic | Web | Browser-to-APM tracing | Ingest-priced web observability | Data ingest plus users or compute | SaaS |
| Dynatrace | Web, Android, and iOS | OneAgent and OpenTelemetry traces | Governed enterprise estates | RUM sessions, replay, properties, and platform usage | SaaS or managed options |
| ClickStack | Web | Replay beside OTel logs and traces | Open-source full-stack debugging | Compute, storage, and transfer | Self-hosted or managed cloud |
| Elastic Observability | No | Elastic RUM and APM traces | Elastic-centric operations | Cloud resources or self-managed infrastructure | Hosted or self-managed |
Final thoughts
Frontend-to-backend debugging divides this shortlist more clearly than feature counts do. Sentry is the closest move for developer-led issue triage, and Datadog offers the deepest managed correlation across a wide production estate. Dash0 fits the narrower case where portable instrumentation and trace continuity outweigh visual playback. New Relic and Dynatrace fit teams already comfortable with ingest-based or governed enterprise observability, ClickStack is the open-source option that preserves replay alongside OpenTelemetry data, and Elastic is strongest when search and existing operational data matter more than screen reconstruction.
Before replacing LogRocket, test one frontend exception, one failed API request, and one slow user journey end to end. Confirm whether the visual evidence is sufficient, whether trace headers survive CORS and every proxy hop, whether sensitive browser data is filtered before transmission, and whether source maps and release identifiers reach the final issue. Then forecast the whole debugging path, not just RUM, using measured replay volume, event or byte ingest, backend spans, logs, retention, query compute, and operator time. If session playback is optional and OpenTelemetry correlation is the deciding factor, the Dash0 free trial provides a practical production test. No credit-card required.