AWS X-Ray collects request data from applications and integrated AWS services, then turns it into traces and a service map for finding latency, errors, and downstream dependencies. It is a natural fit for AWS-first teams running services such as Lambda, API Gateway, ECS, or EKS and already investigating incidents in CloudWatch. Its strongest advantage is native AWS context with little extra platform sprawl. AWS’s X-Ray documentation describes the trace map and integrated-service model; for a broader look at what X-Ray covers and where it fits among tracing tools, see what AWS X-Ray is.
Teams evaluate AWS X-Ray alternatives when they need deeper cross-signal investigation, consistent tracing across clouds, more flexible queries, tail-based sampling, or a deployment model outside AWS. Instrumentation strategy is now part of that decision: AWS put the X-Ray SDKs and daemon into maintenance mode on February 25, 2026, and recommends OpenTelemetry for new and existing application instrumentation. That does not make the X-Ray backend obsolete, but it creates a good moment to compare where your portable OpenTelemetry data should land.
Quick picks
| Tool | Best fit |
|---|---|
| Dynatrace | Large enterprises that value automated discovery, topology, and causal analysis across complex estates |
| Grafana Cloud | Grafana and Prometheus users who want managed Tempo tracing without abandoning familiar open-source workflows |
| Dash0 | Platform teams prioritizing an OpenTelemetry-native workflow, span-level cost controls, and record-based billing |
| Datadog | Teams consolidating application, infrastructure, user-experience, and security monitoring under one mature SaaS platform |
| Honeycomb | Engineers debugging high-cardinality production behavior with exploratory queries and tail-based sampling |
| New Relic | Teams wanting broad full-stack observability, direct OTLP ingest, and an accessible free starting point |
| SigNoz | OpenTelemetry teams that want a choice between managed cloud, BYOC, and self-hosted observability |
What to look for in an AWS X-Ray alternative
-
A migration path from X-Ray instrumentation: Prefer native OTLP ingest and confirm support for W3C Trace Context, the X-Ray propagator, AWS resource attributes, and any custom annotations you rely on. A collector that can dual-export lets you compare backends before cutting over.
-
Trace investigation depth: Service maps are only the start. Compare attribute search, outlier analysis, span-derived RED metrics, tail sampling, asynchronous span links, and how quickly an engineer can move from a symptom to the responsible service or deployment.
-
Cross-signal context: Decide whether traces must correlate with logs, metrics, profiles, browser sessions, cloud resources, and incidents. Broad platforms simplify consolidation; tracing-focused tools can offer a sharper debugging workflow with a smaller product surface.
-
AWS and multi-cloud coverage: X-Ray’s native AWS integrations are hard to reproduce exactly. Test visibility for Lambda, API Gateway, ECS, EKS, SQS, Step Functions, and managed databases, then check whether the same model works for non-AWS services.
-
Deployment and data control: SaaS removes backend operations, while self-hosting or BYOC can satisfy residency and control requirements. The latter shifts scaling, storage, upgrades, backups, and on-call ownership to your team.
-
Sampling, retention, and billing: Model peak span volume, not only average traffic. Host counts, ingested bytes, retained or indexed spans, query scans, seats, and add-ons create very different incentives and surprise-cost drivers.
1. Dynatrace
Best for: Large, dynamic enterprises that prioritize automatic discovery and causal analysis
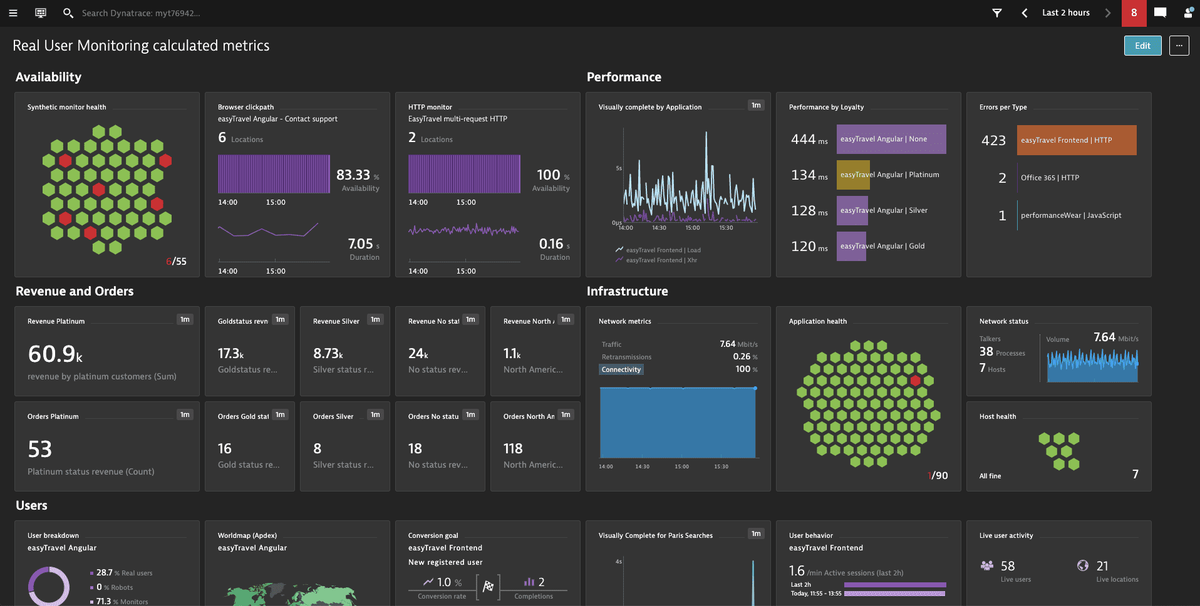
Dynatrace is the enterprise-automation choice on this list. OneAgent can capture application and infrastructure context automatically, while OpenTelemetry traces can be combined with OneAgent data in the same investigation. Its distributed tracing experience supports free-form analysis and correlation with logs, metrics, and business events; Dynatrace documents both instrumentation paths and trace analysis through Grail.
This depth is valuable when application ownership, topology, and dependencies are difficult to maintain manually. It also means the purchase is usually broader than replacing one AWS tracing service. Dynatrace Platform Subscription pricing can combine hourly Full-Stack monitoring with separate Grail meters for trace ingest, retention, and query scanning, so forecasting requires both runtime footprint and data-access patterns. The public rate card exposes those units, while enterprise procurement commonly adds a committed platform spend.
Worth exploring if: You operate a large hybrid estate and want automated topology plus opinionated root-cause workflows more than a lightweight tracing backend.
Give it a pass if: Your requirement is narrowly distributed tracing, your team wants a self-service monthly purchase, or adopting DQL and the wider Dynatrace operating model would outweigh the benefit.
2. Grafana Cloud
Best for: Teams already fluent in Grafana, Prometheus, and open-source observability backends
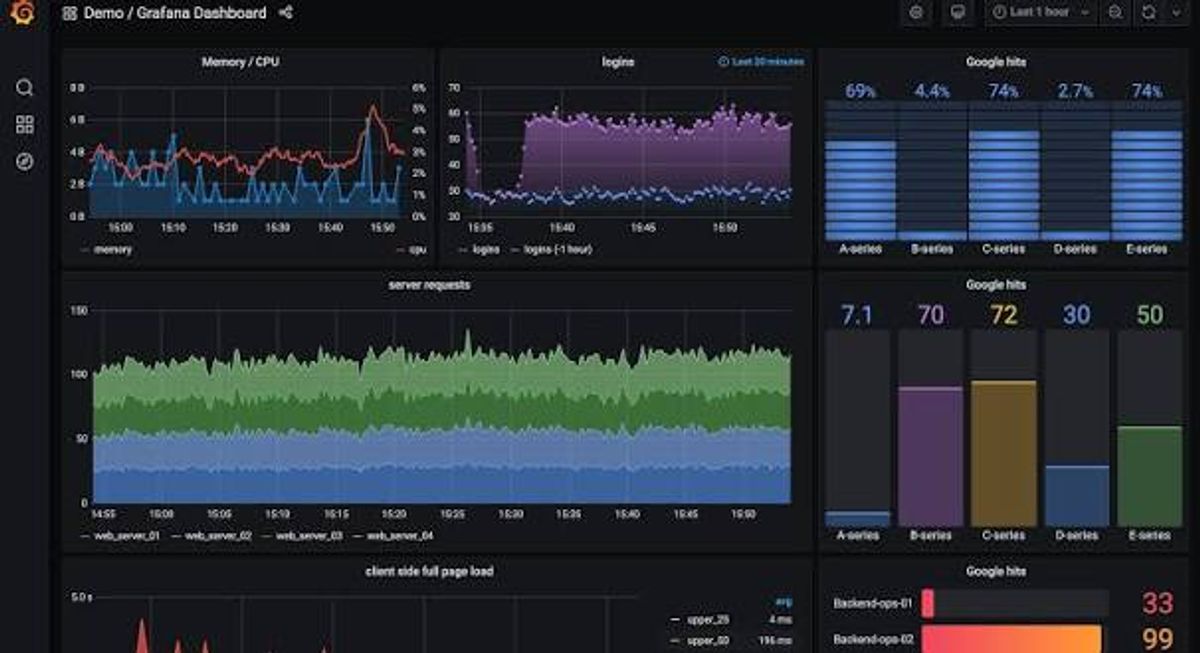
Grafana Cloud Traces is a managed Tempo service that accepts OpenTelemetry, Jaeger, and Zipkin formats. TraceQL provides structured trace search, while Traces Drilldown offers a queryless route for common investigations. Span-derived RED metrics, log-to-trace pivots, and Adaptive Traces make it a strong step up from X-Ray for teams that want traces to live beside Grafana dashboards and Prometheus metrics.
The managed service bills trace processing, writing, and retention by data volume, with a platform fee after the free tier. That is understandable once you measure bytes, but retention and multi-signal use still need modeling. Self-hosting Tempo gives you more control and can use object storage, but your team then owns sizing, upgrades, storage behavior, and availability — see this guide to running Prometheus monitoring the right way for what that operational burden looks like in practice. Grafana’s flexibility also means engineers may move among TraceQL, PromQL, and LogQL rather than learning one investigation language.
Worth exploring if: Grafana is already your operational front end and you want managed or self-managed tracing that fits the same ecosystem.
Give it a pass if: You want a highly opinionated single-query workflow or do not want to operate several backends and query models in a self-hosted deployment.
3. Dash0
Best for: Platform teams that want an OpenTelemetry-native investigation model and telemetry-record billing
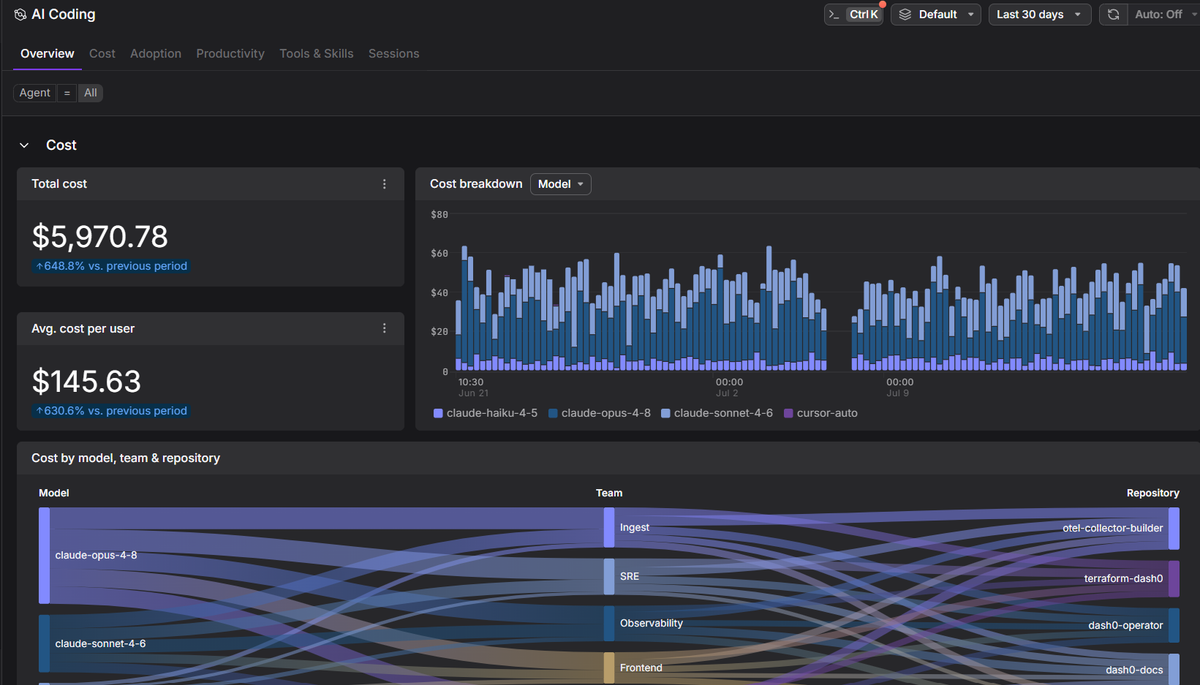
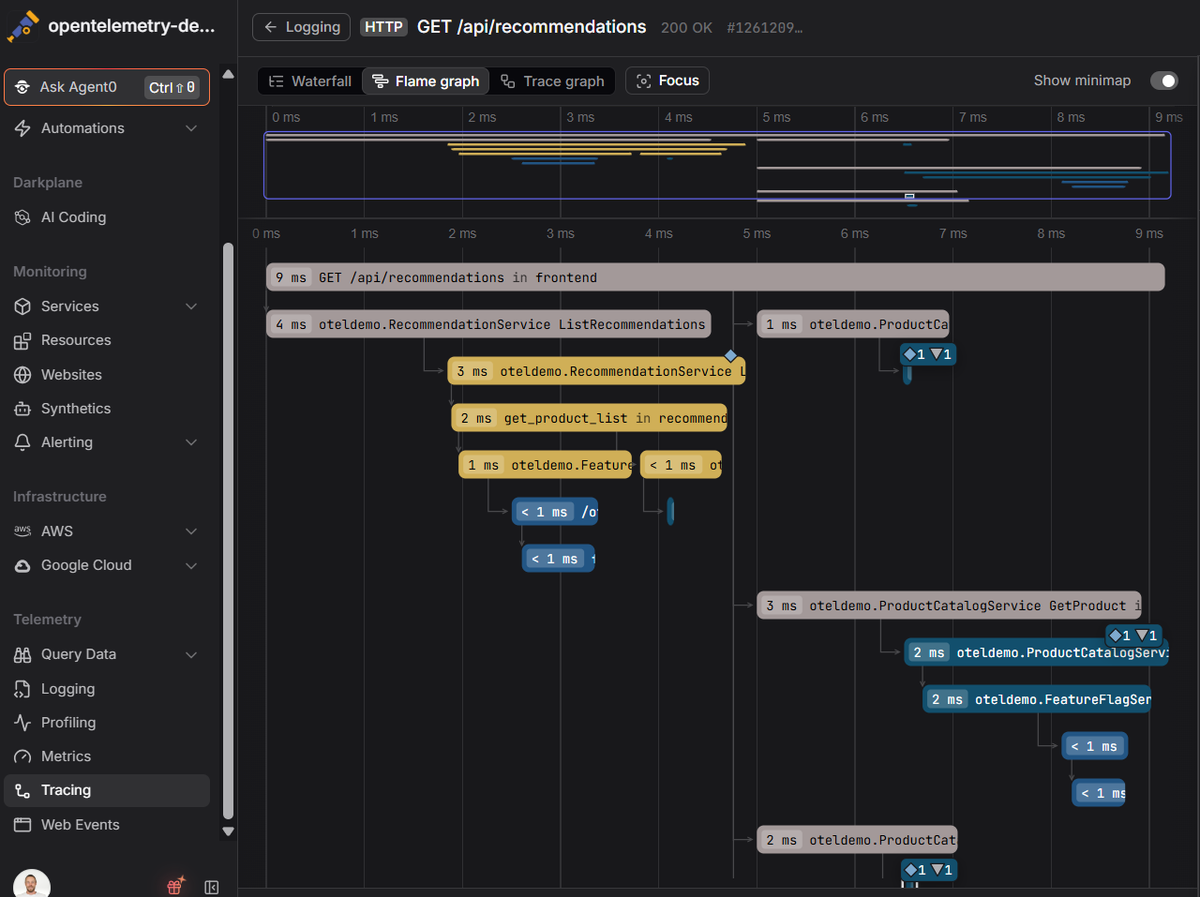
Dash0 ingests OpenTelemetry data and presents traces through an outlier map, span-derived RED metrics, grouped attribute analysis, automated triage, and waterfall, flame-graph, and service-graph views. The advantage over X-Ray is a unified workflow across spans, logs, metrics, and resources without first translating the data into a vendor-specific instrumentation model. Dash0’s tracing documentation also exposes raw OTLP data and cross-trace span links.
Pricing is consumption-based per million metric data points, spans, log records, and web events, with no base platform or per-seat fee. Span spam filters can drop known low-value traffic at ingestion, but those records cannot be recovered, so filters need production testing. See Dash0 pricing for current retention and the free trial. The main tradeoff is ecosystem breadth: Dash0 lists more than 100 integrations, but teams that need Datadog-scale coverage or a self-hosted backend should compare those requirements directly.
Worth exploring if: You are moving X-Ray instrumentation to OpenTelemetry and want a managed backend with focused investigation workflows and predictable record-based meters.
Give it a pass if: Your priority is the broadest mature suite across security, digital experience, and service management, or you require a self-managed tracing backend.
4. Datadog
Best for: Teams standardizing on a broad commercial observability platform
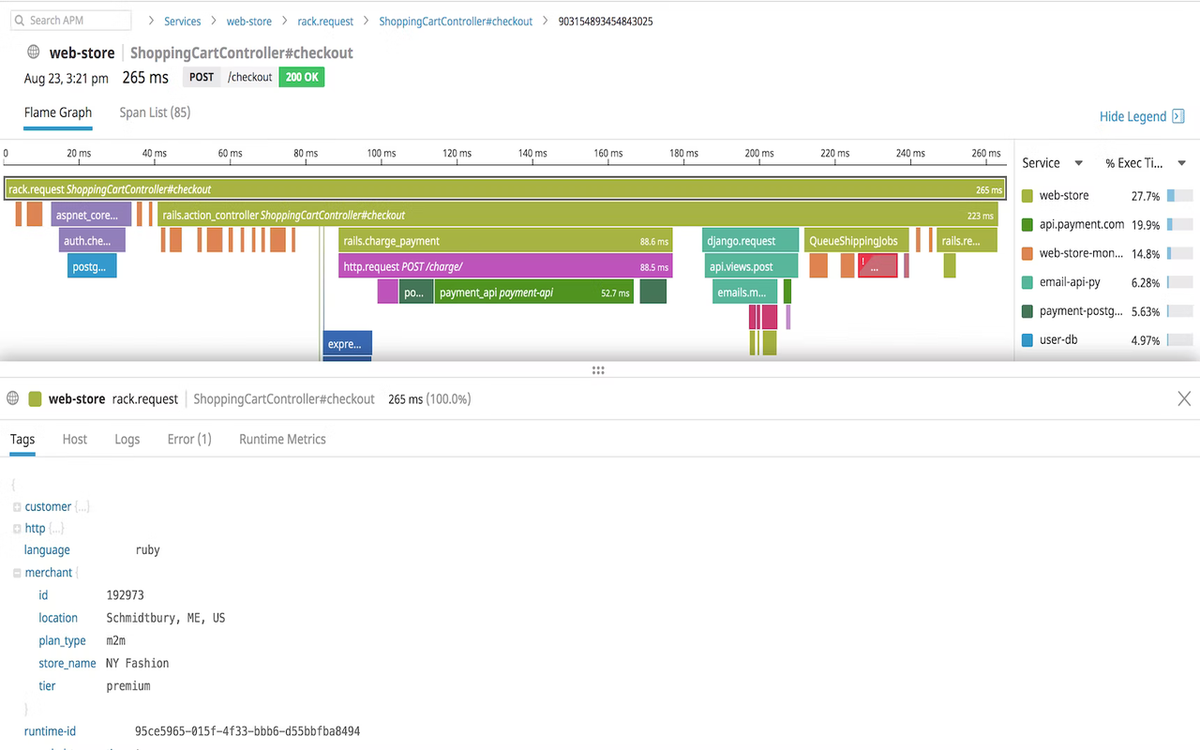
Datadog APM combines distributed tracing with service dependency views and correlation to infrastructure, logs, databases, RUM, deployment changes, and security signals. That breadth is the main reason to choose it over X-Ray: an investigation can start from an AWS resource, user session, alert, or trace and stay in one platform. Datadog supports both its own instrumentation and native or hybrid OpenTelemetry setups, which gives X-Ray users a practical OTLP migration path. For a closer look at how Datadog's tracing model compares to an OpenTelemetry-native approach, see what Datadog distributed tracing covers and this guide to migrating from Datadog to OpenTelemetry.
The tradeoff is commercial and operational surface area. Datadog’s public pricing offers host-based APM plans with span-ingest and indexed-span allowances, plus a direct OTLP APM ingest option billed by ingested span volume; infrastructure, logs, RUM, synthetics, and other modules have their own meters. That flexibility supports phased adoption, but an elastic AWS estate needs careful cost modeling across products. See Datadog’s pricing page for the current billing units and free trial.
Worth exploring if: You want one mature vendor for application, infrastructure, digital-experience, and security workflows across AWS and other environments.
Give it a pass if: You need a tracing-focused product with a small billing surface or want most investigation assets to remain portable outside a proprietary platform.
5. Honeycomb
Best for: High-cardinality, exploratory debugging of distributed systems
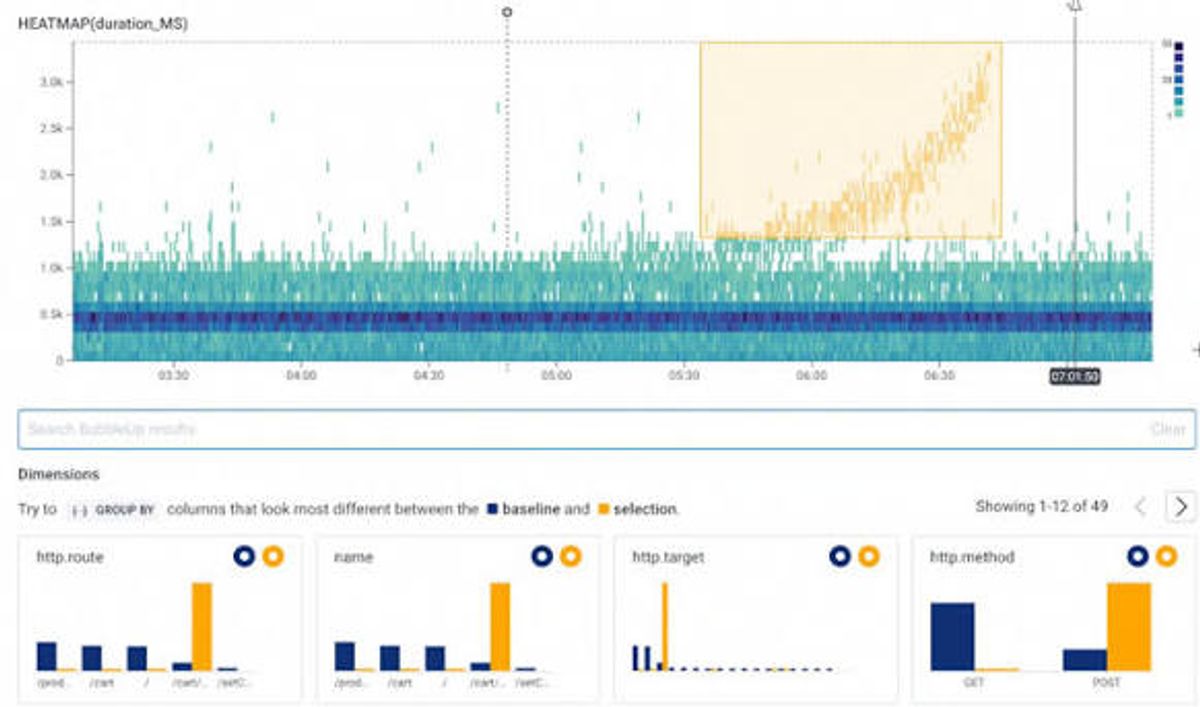
Honeycomb treats OpenTelemetry spans as richly attributed events and is strongest when the question is not known in advance. Engineers can slice production behavior by customer, endpoint, build, region, or any other useful field instead of relying only on predefined dashboards. The standard OpenTelemetry Collector can send OTLP data directly to Honeycomb, and Honeycomb documents filtering, transformation, and multi-backend export through that pipeline.
Refinery is the differentiator for high-volume tracing. It makes tail-based decisions after examining a complete trace and supports rules-based, dynamic, throughput-based, and deterministic sampling. Because Refinery is software you deploy and operate, teams should include its capacity and reliability in the migration plan. Honeycomb’s plans meter monthly events and metric data points, with unlimited seats and querying; the pricing page provides a free tier and public Pro starting point.
Worth exploring if: Your incidents require ad hoc analysis across high-cardinality attributes and you want trace-aware sampling to preserve rare failures.
Give it a pass if: Your main goal is broad, automatic AWS infrastructure discovery or an all-in-one suite spanning deep infrastructure, security, and digital-experience products.
6. New Relic
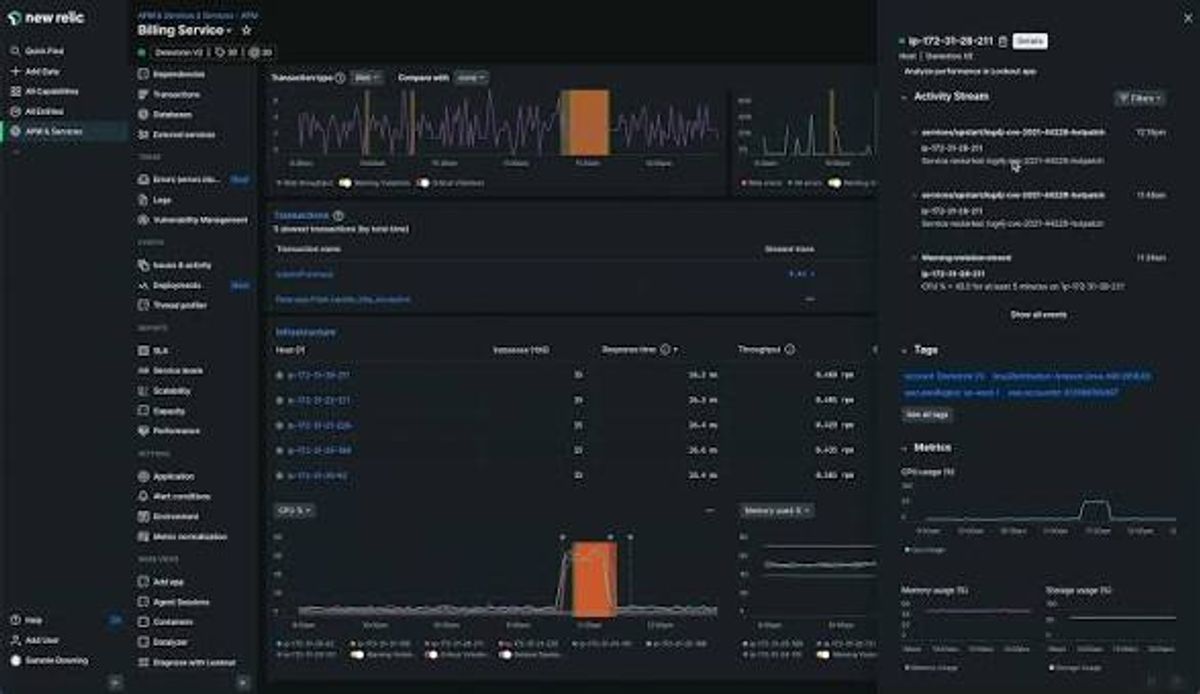
Best for: Teams seeking broad full-stack observability with direct OTLP ingest and a generous entry tier
New Relic can receive OpenTelemetry data through its OTLP endpoint and map spans, attributes, events, and span links into its telemetry database. That last detail matters for SQS, Kafka, batch, and other asynchronous flows where a strict parent-child tree is incomplete. Its OpenTelemetry trace documentation explains the mapping, while New Relic agents remain available when tighter out-of-the-box APM integration matters more than instrumentation portability. See what New Relic distributed tracing covers for a closer comparison of its tracing model.
The platform is broader than X-Ray, covering infrastructure, logs, browser and mobile monitoring, synthetics, alerts, and APM. Pricing is primarily based on data ingested plus either user access or a compute model, with optional Advanced Compute and retention features. This avoids host-count penalties in highly elastic environments, but large engineering teams should model access tiers as carefully as telemetry volume. New Relic publishes a perpetual free tier and self-service pricing.
Worth exploring if: You want one SaaS platform across signals, value direct OTLP ingest, and prefer data-volume billing over per-host APM licensing.
Give it a pass if: Full-platform user costs, proprietary NRQL assets, or optional compute features would create more governance and migration work than your tracing use case justifies.
7. SigNoz
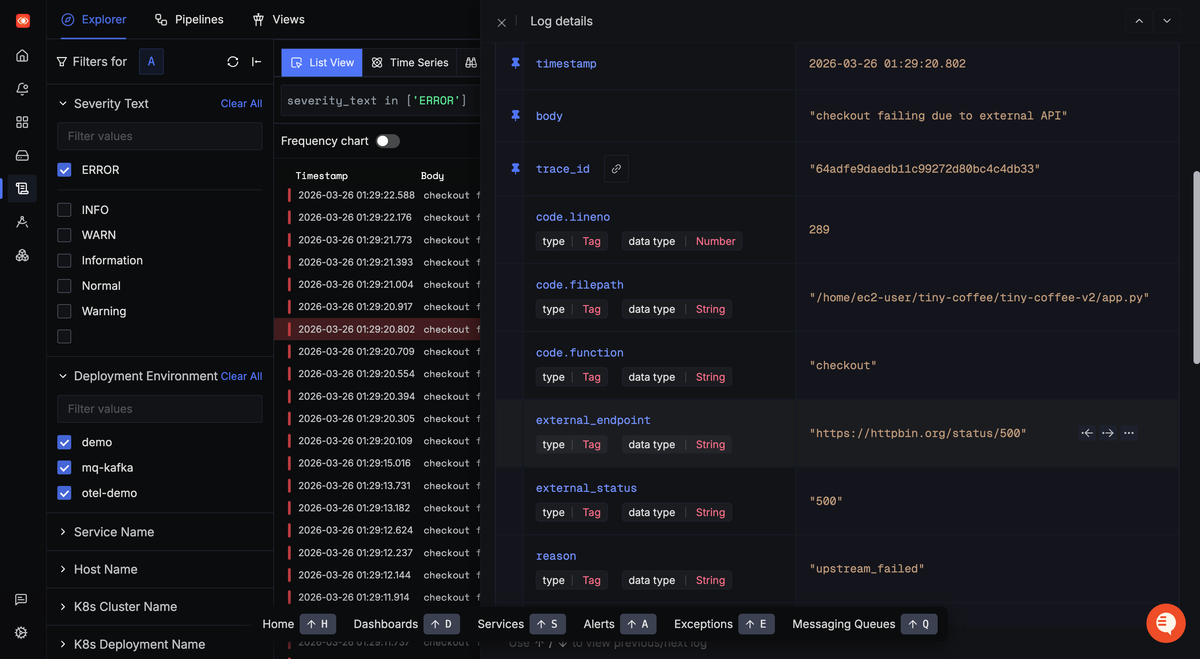
Best for: Teams that want OpenTelemetry-native observability with cloud and self-hosted deployment choices
SigNoz combines traces, metrics, logs, infrastructure monitoring, dashboards, and alerts around OTLP ingestion. The managed service removes backend maintenance, while the community edition lets you run the stack in your own environment and control the OpenTelemetry endpoints and pipeline. That makes SigNoz a credible X-Ray alternative for regulated workloads or teams that want to avoid placing their telemetry backend inside another proprietary cloud.
SigNoz Cloud bills traces and logs by ingested data volume and metrics by samples, without host or user meters, and offers a free trial. The community edition removes the SaaS bill but not the cost of storage, scaling, upgrades, backups, authentication, and production support; enterprise self-hosting or BYOC adds commercial support and governance features. The decision is therefore less about feature checkboxes than whether platform ownership is a strategic advantage for your team.
Worth exploring if: OpenTelemetry is your default instrumentation layer and you need a viable path from managed SaaS to BYOC or self-hosting.
Give it a pass if: You do not want to own observability infrastructure and need the deepest established enterprise integration and service-management catalog from day one.
Comparison table
| Tool | Best fit | Main strength | Main tradeoff | Deployment | Pricing model |
|---|---|---|---|---|---|
| Dynatrace | Complex enterprise estates | Automated discovery, topology, and causal analysis | Wider platform adoption and committed-spend planning | SaaS, managed options | Runtime footprint plus trace ingest, retention, and query |
| Grafana Cloud | Grafana and Prometheus teams | Tempo, TraceQL, and open-source ecosystem alignment | Multiple backends and query languages | SaaS or self-hosted Tempo | Trace process, write, and retention volume |
| Dash0 | OTel-native managed observability | Focused cross-signal workflow and record-based cost controls | Smaller ecosystem and no self-hosted edition | SaaS | Telemetry records and metric data points |
| Datadog | Broad platform standardization | Deep cross-product correlation and integration coverage | Multiple product meters and proprietary workflows | SaaS | APM hosts or OTLP span volume, plus separate modules |
| Honeycomb | Exploratory production debugging | High-cardinality analysis and trace-aware tail sampling | Less suited to broad AWS infrastructure standardization | SaaS; self-managed Refinery | Events and metric data points |
| New Relic | Accessible full-stack SaaS | Direct OTLP ingest and broad signal coverage | User or compute access model plus proprietary assets | SaaS | Data ingest plus users or compute |
| SigNoz | Deployment and data-control flexibility | OpenTelemetry-native cloud, BYOC, and self-host paths | Self-hosting transfers operational burden to your team | SaaS, BYOC, self-hosted | Ingested GB and metric samples, or infrastructure cost |
Final thoughts
The strongest AWS X-Ray alternatives fall into three approaches. Datadog, Dynatrace, and New Relic replace X-Ray with a much wider commercial platform; they fit organizations that want standardization and are willing to adopt a vendor’s query, dashboard, and billing model. Honeycomb and Dash0 put the investigation workflow and OpenTelemetry data model closer to the center. Grafana and SigNoz offer the clearest routes for teams that value open-source components, deployment flexibility, or existing Prometheus and Grafana skills. None recreates every AWS-native integration automatically, so the best choice depends on whether you are replacing only the trace backend or redesigning observability across signals and clouds.
Before switching, validate trace continuity through Lambda, API Gateway, SQS, Step Functions, and asynchronous jobs; map X-Ray annotations and metadata to OpenTelemetry attributes; and compare sampling results during real traffic peaks. Run both backends long enough to measure missing spans, investigation speed, retention, and cost from the same workload. Also inventory the vendor-specific assets you will rebuild: alerts, dashboards, service ownership, RBAC, and incident workflows remain switching costs even when instrumentation is portable. If you want a wider view of the tracing market beyond X-Ray specifically, see this ranking of the best distributed tracing tools. If an OpenTelemetry-native managed platform with record-based billing fits that test plan, the Dash0 free trial is a practical way to compare it against X-Ray using your own telemetry. No credit-card needed.