

You started with Sentry because it caught the exceptions your users hit before your users emailed you about them. Stack traces, breadcrumbs, the offending commit, a Slack ping. For a long time that was enough. Then the product grew, and so did the invoice. Sentry now meters errors, tracing spans, session replays, cron and uptime checks, logs, profiling, and Seer AI contributors as separate quotas, layered on top of plan tiers that gate single sign-on (SSO), audit logs, and retention (see Sentry's pricing). At some point you look at the bill and realize you are paying a developer-tools price for something that is edging toward full observability without quite being full observability.
That is usually the moment people start searching for a way out. And the search splits in two directions. One path is a like-for-like error tracker: another tool that groups exceptions and shows stack traces. The other path, the one this article takes, is a platform that absorbs error tracking into a broader picture of metrics, logs, traces, and infrastructure, so you run one system instead of Sentry plus a metrics tool plus a log tool.
The catch in that second path is worth stating up front, because most comparison articles skip it. Sentry is a developer-first error tracker that grew outward. Full observability and application performance monitoring (APM) platforms are the reverse: they start from traces, metrics, and logs, and errors are one facet of that data rather than a first-class issue-management workflow. Some of them replicate Sentry's exception grouping, release health, and session replay closely. Others surface the same errors but expect you to think in traces and log queries, not in an "issues" inbox. Whether that trade is worth it depends entirely on how your team actually debugs.
This piece evaluates eight platforms that can genuinely stand in for Sentry while giving you more. We look at how deep their error tracking really goes, what signals they cover, how you instrument them, whether they do frontend and session replay (and what that means for user data), how you pivot from an error to its root cause, how sampling and cost controls work, what their pricing model charges on, and how much you are locked in when you want to leave.
What makes replacing Sentry hard
Don't assume "observability platform" means "does everything Sentry does, plus more." Sometimes it does. Often it does the "more" well and the Sentry part adequately.
Start with error tracking depth. Sentry's core loop is exception capture, fingerprint-based grouping into issues, source-map-resolved stack traces for minified frontend code, release health (crash-free sessions and users), suspect-commit attribution, and assignment workflows. A platform that shows you a spike in 5xx spans is not the same thing. When you evaluate an alternative, the real question is whether errors are a managed object with an owner and a lifecycle, or a filter on your trace data.
Then there is signal coverage and how the signals connect. The reason to consolidate onto one platform is correlation: click an error, land on the trace that produced it, read the logs from that exact request, check the host's memory at that moment. A platform that stores each signal in a separate backend with a separate query language can still show you all four, but the pivots are clumsier than a single correlated data model.
Instrumentation is the next fork. Sentry ships SDKs you drop into your app. Some alternatives use a proprietary agent per host. Others are OpenTelemetry-native and take OpenTelemetry Protocol (OTLP) data directly, which changes what you can carry with you if you leave. Language coverage for automatic instrumentation varies a lot, and a tool that auto-instruments Java and Node.js beautifully may leave your Go service on manual spans.
Frontend and session replay deserve their own scrutiny. Replay is one of Sentry's most-loved features, and it is also a data-collection liability. A replay records DOM mutations and network activity, which means it can capture form fields, tokens, and personal data unless masking is configured correctly. Any tool that offers replay has to answer where that data is stored, whether masking happens before or after transmission, and what happens when a secret lands in a creatively named field that your redaction rules did not anticipate.
Finally, sampling, cost model, and lock-in. At real traffic you will sample traces, and the default sampling behavior affects whether the error you need is the one that got dropped. The pricing model determines whether adding a useful attribute, a new service, or a fifth engineer quietly raises your bill. And lock-in is not binary: OpenTelemetry makes instrumentation and telemetry pipelines portable, but it does not automatically make dashboards, alerts, saved queries, or investigation workflows portable. Those assets may still require migration or rebuilding when you switch backends.
We'll evaluate each tool against these criteria:
- Error tracking depth: real issue grouping, release health, and source-map stack traces, versus errors surfaced inside trace and log data
- Signal coverage and correlation: metrics, logs, traces, real user monitoring (RUM), profiling, and how cleanly you pivot between them
- Instrumentation model: proprietary agent versus OpenTelemetry-native, and automatic language coverage
- Frontend and session replay: whether it exists, and how it handles personally identifiable information (PII) and masking
- Sampling and data control: defaults, configurability, and impact on debugging
- Cost model: what dimensions it charges on and how predictable the bill is
- Lock-in: what stays portable and what does not
At a glance
| Tool | Error tracking | Signal coverage | Instrumentation | Session replay | Cost model | Lock-in |
|---|---|---|---|---|---|---|
| Datadog | Error Tracking product (separate SKU) | Metrics, logs, traces, RUM, profiling, synthetics | Proprietary agent, OTel-compatible | Yes (RUM add-on) | Per-host + per-GB + per-session, many meters | High, proprietary agent and query |
| New Relic | Errors Inbox (needs Core/Full seat) | Metrics, logs, traces, RUM, profiling | Agent or OTLP | Yes | Per-GB ingest + per-user seats | Medium, ingest is portable, workflows are not |
| Dynatrace | Davis AI error detection, no issue inbox | Metrics, logs, traces, RUM, security | OneAgent auto-discovery | Yes | Consumption (host-memory-hours, GB, sessions) | High, OneAgent and Grail |
| Elastic Observability | Errors from APM data | Metrics, logs, traces, RUM, synthetics | Agents or OTLP | No native replay | Per-GB ingest/retention or resource tiers | Medium, data model is Elastic-specific |
| Grafana Cloud | Frontend errors via Faro RUM | Metrics, logs, traces, profiles, RUM | OTel and Prometheus | No native replay | Per-series + per-GB + per-user + per-session | Medium, portable data, per-signal languages |
| SigNoz | Exceptions view from traces | Metrics, logs, traces, exceptions | OpenTelemetry-native | No | Per-GB (cloud) or self-host free | Low on instrumentation, self-host option |
| AppSignal | First-class error tracking | APM, errors, logs, host metrics, uptime, RUM | Language SDKs | No | Per monthly request, flat tiers | Medium, SDK-based, limited languages |
| Dash0 | Errors via traces and logs, no issue inbox | Metrics, logs, traces, RUM, synthetics, infra | OpenTelemetry-native, OTLP | No | Per-signal (spans, logs, metric points) | Low on instrumentation, dashboards portable via Perses/PromQL |
Pricing structures are analyzed per tool below. Rates were verified against each vendor's public pricing in mid-2026; confirm current numbers before you commit.
1. Datadog
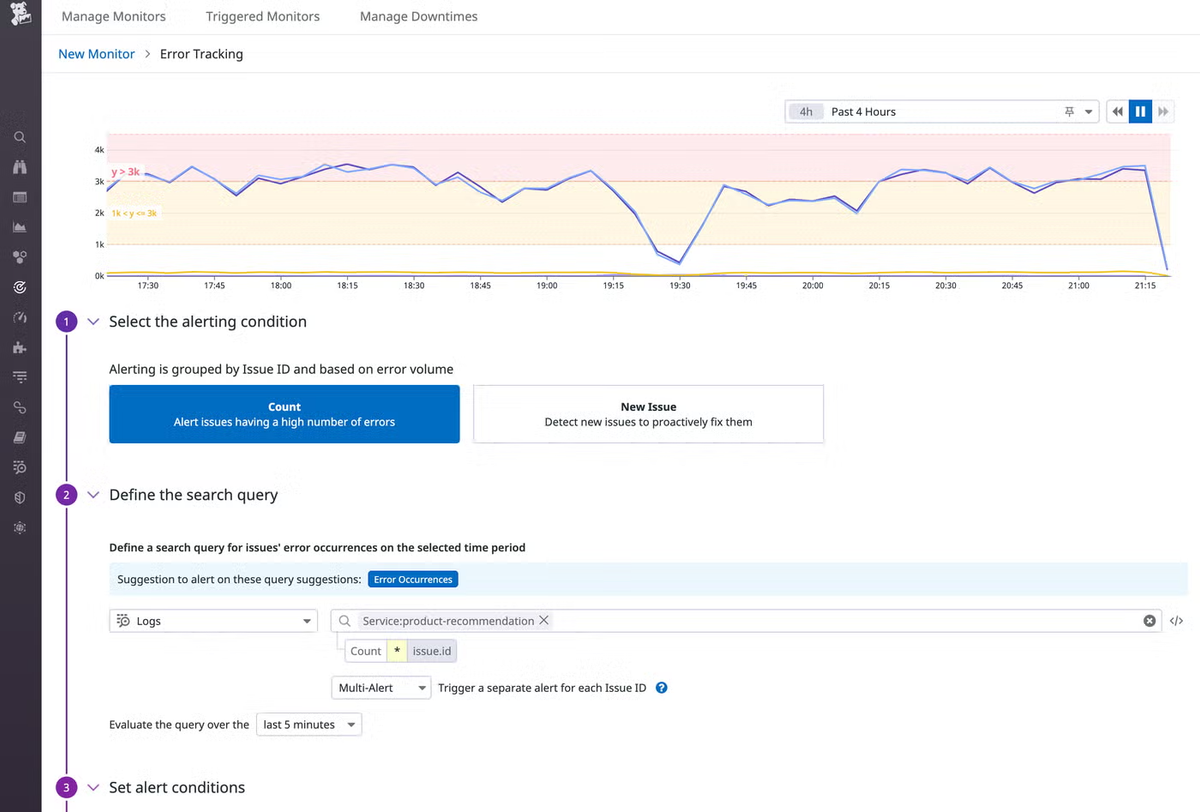 Datadog is the platform most teams benchmark everything else against, and for good reason. It covers infrastructure, APM, logs, RUM, synthetics, security, and a dedicated Error Tracking product, with an integration catalog north of 700. If your goal is one vendor for everything an SRE and a developer might ever want to look at, Datadog is the most complete answer on this list.
Its Error Tracking feature groups errors from backend and frontend, deduplicates them into issues, and ties them to the traces and logs around them. Combined with RUM and session replay, it gets close to feature parity with Sentry on the frontend, and well past it on the backend and infrastructure side.
What's good
- Genuine breadth with real correlation. Datadog's value is that an error, the distributed trace behind it, the host metrics at that moment, and the logs from that request all live in one place and link together. For teams drowning in tool sprawl, that consolidation is the whole point.
- Mature RUM and session replay. The frontend story is strong: real user monitoring, error tracking, and full session replay with configurable privacy masking. This is the part of Datadog that most directly replaces Sentry's replay.
- The integration catalog. Whatever database, queue, or cloud service you run, there is almost certainly a turnkey Datadog integration. This is genuinely hard for newer platforms to match.
The catch
The pricing is multi-dimensional and infamously hard to predict, which is the single most common reason teams leave. Infrastructure bills per host, APM bills per host on top of that, logs bill for ingestion and again for indexing, RUM and session replay bill per session, custom metrics carry a surcharge, and synthetics bill per test run. Each meter is defensible on its own; together they compound in ways that surprise people at invoice time.
Host billing uses a high-water mark. Datadog measures host count hourly, discards roughly the top 1% of hours, and bills the rest of the month at that near-peak level, so a few hours of autoscaling can inflate the whole month (Datadog pricing). In containerized environments, an agent misconfigured per-container instead of per-node can multiply the bill.
On instrumentation, Datadog is OpenTelemetry-compatible, not OpenTelemetry-native. You can send OTLP, but the platform is built around the Datadog agent and proprietary data model, so your dashboards, monitors, and much of your instrumentation investment stay behind if you migrate away.
Pricing model
Datadog charges on almost every dimension you can name: per host for infrastructure and again for APM, per GB for log ingestion plus per million events for indexing, per session for RUM and replay, per test for synthetics, and a surcharge for custom metrics beyond the included allotment. Error Tracking is its own line, around $25 per month for a 50K-error tier on-demand. This model interacts badly with high-cardinality, richly attributed telemetry: the more useful metadata you attach, the faster custom-metric and indexing costs climb, which quietly pushes teams toward sending less data exactly when they want more. Predicting the bill requires modeling each meter against your architecture, and most teams find the estimate lands well below the reality. Verify current rates on the pricing page.
The verdict
Pick Datadog if breadth and integration depth matter more than cost predictability, and you have the discipline, or a financial-operations (FinOps) team, to manage a multi-meter bill. It is the safe institutional choice for large teams. If you are leaving Sentry primarily to escape unpredictable pricing, understand that Datadog can reproduce that problem at a larger scale.
2. New Relic
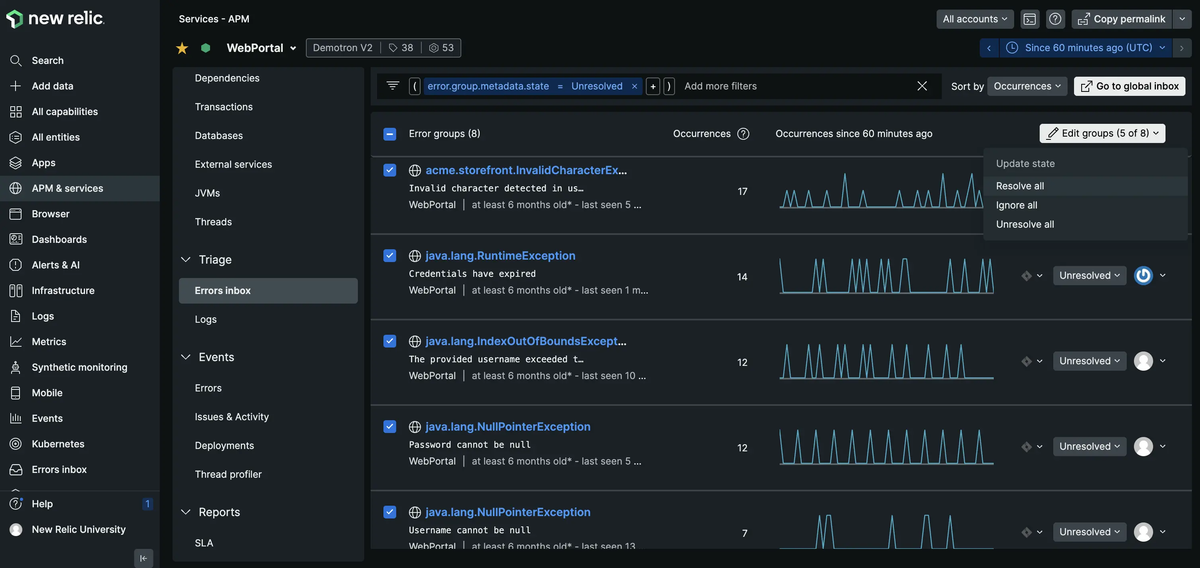 New Relic is a full-stack observability platform with a different pricing model from the host-based crowd: it charges for data ingested and for user seats, not for hosts. For Sentry refugees, the relevant piece is Errors Inbox, which collects and groups errors across services and pairs with New Relic's APM, logs, and RUM.
The platform is broad and mature, covering APM, infrastructure, browser and mobile monitoring, synthetics, and Kubernetes, with a generous free tier of 100 GB of ingest and one full-platform user.
What's good
- Ingest-based pricing decouples cost from host count. You pay for the telemetry you send, so scaling your fleet does not automatically scale your bill the way host-based models do. For dynamic or containerized workloads this is often cheaper and easier to reason about.
- Errors Inbox is a real error workflow. It groups errors, tracks them across releases, and surfaces regressions, which is closer to Sentry's model than a raw trace filter. It sits behind the Core or Full-platform user tier.
- A free tier you can actually run on. 100 GB per month and a full user, indefinitely, is enough for a small production app and makes evaluation painless.
The catch
The seat model is where costs hide. Full-platform users are expensive, and New Relic's own tiering pushes teams onto the Pro edition once they pass five full users, at a per-user rate that can exceed the data bill for a mid-size deployment (New Relic pricing). Basic users can view dashboards but cannot investigate traces or use Errors Inbox, so in practice every engineer who debugs production needs a paid seat. That tension, wanting the whole team in the tool but paying per head for it, is the New Relic version of Sentry's seat problem.
On the free tier, exceeding 100 GB in a month stops ingestion and cuts platform access until the next month or an upgrade, which is a hard edge to hit unexpectedly. Logs are the usual culprit, since default agents forward everything.
Instrumentation is flexible (agents or OTLP), but the platform's data model and the investigation workflows you build are New Relic-specific, so ingest portability does not translate to workflow portability.
Pricing model
New Relic bills on two independent axes: data ingest (first 100 GB free, then roughly $0.40 per GB on the standard option or $0.60 with Data Plus for extended retention and compliance) and user seats (Core users around $49, full-platform users far higher). The ingest axis is friendly to rich telemetry, since it does not penalize cardinality or custom metrics separately. The seat axis is the opposite: it prices access, which incentivizes limiting who on the team can debug. Predictability is good on data and poor on seats, because seat needs grow with team size in ways that are easy to under-forecast. Confirm rates on the pricing page.
The verdict
New Relic fits teams with large fleets but small-to-moderate debugging headcount, where ingest-based pricing wins and seat costs stay contained. If you have a big engineering org that all needs full access, model the seat math carefully before committing, because that line item can dominate.
3. Dynatrace
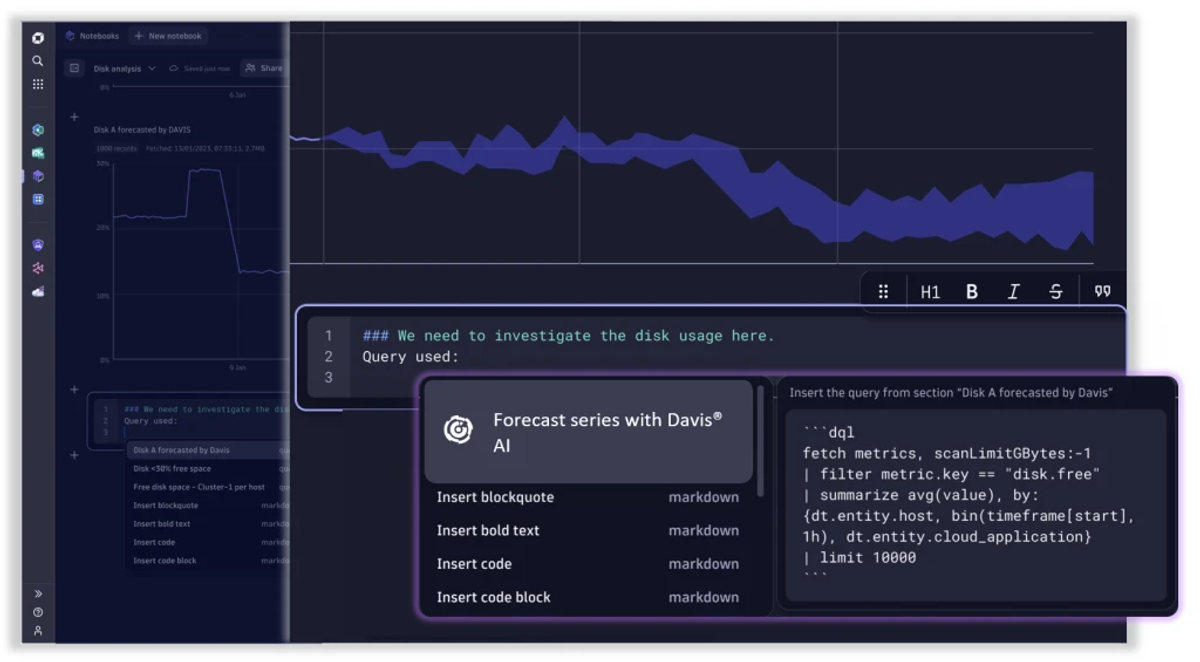 Dynatrace sits at the enterprise end of this list. Its calling card is automation: OneAgent auto-discovers your environment, Smartscape draws a live dependency topology, Grail unifies the data, and Davis AI performs causal root-cause analysis. For large, tangled, hybrid estates where mapping dependencies by hand is hopeless, that automation is the reason to buy.
For error tracking specifically, Dynatrace takes a different philosophy than Sentry. Rather than an issues inbox you triage, Davis AI detects anomalies and errors and points at probable causes. It is powerful for incident response and weaker as a developer-facing error-workflow tool.
What's good
- Automatic discovery and topology. OneAgent instruments hosts with minimal configuration, and Smartscape continuously maps what depends on what. In a 500-service environment, this is a genuine advantage that manual instrumentation cannot match.
- Causal AI root-cause analysis. Davis correlates signals to propose a root cause rather than just alerting on symptoms. When it works, it collapses investigation time significantly during incidents.
- Unified data with long retention options. Grail stores logs, metrics, traces, and events together, with trace retention extendable well beyond the defaults for teams that need long lookback.
The catch
Dynatrace is expensive and its consumption model is complicated. Full-Stack monitoring bills per gigabyte-hour of host memory (roughly $0.01 per GiB-hour, about $58 per month for an 8 GiB host), logs bill per GB ingested plus a per-GiB-day retention charge, RUM bills per session, and Davis AI and application security consume additional units (Dynatrace pricing). One documented sharp edge: automation workflows begin accruing charges when created, not when they run. Third-party data puts the median enterprise contract around $183K per year, which tells you the target customer.
The error-tracking experience is not a Sentry replacement in shape. If your developers live in an issues list, assign errors, and track crash-free release health, Dynatrace's anomaly-centric model will feel foreign. It is built for SREs responding to incidents, not for a developer triaging their service's exception feed.
Lock-in is high. OneAgent and Grail are proprietary, and the automation that makes Dynatrace valuable is also what makes leaving it painful.
Pricing model
Dynatrace's Platform Subscription meters memory-GiB-hours, host-hours, pod-hours, GiB-days of retention, sessions, and workflow-hours, each separately. Unlimited users is a real advantage against seat-based rivals. But the sheer number of meters interacts poorly with predictability: teams routinely underestimate because Full-Stack host costs, log retention, and RUM sessions each scale on different axes. The per-host-memory model also means memory-heavy services cost more to monitor regardless of how useful their telemetry is. List rates discount meaningfully above a few hundred hosts, so real pricing requires a sales conversation. Check the pricing page for current units.
The verdict
Choose Dynatrace if you are a large enterprise with complex hybrid infrastructure, an incident-response-heavy operating model, and the budget to match. It is overkill, and overpriced, for a startup that mainly wants to keep doing what Sentry did. The automation is real; so is the invoice.
4. Dash0
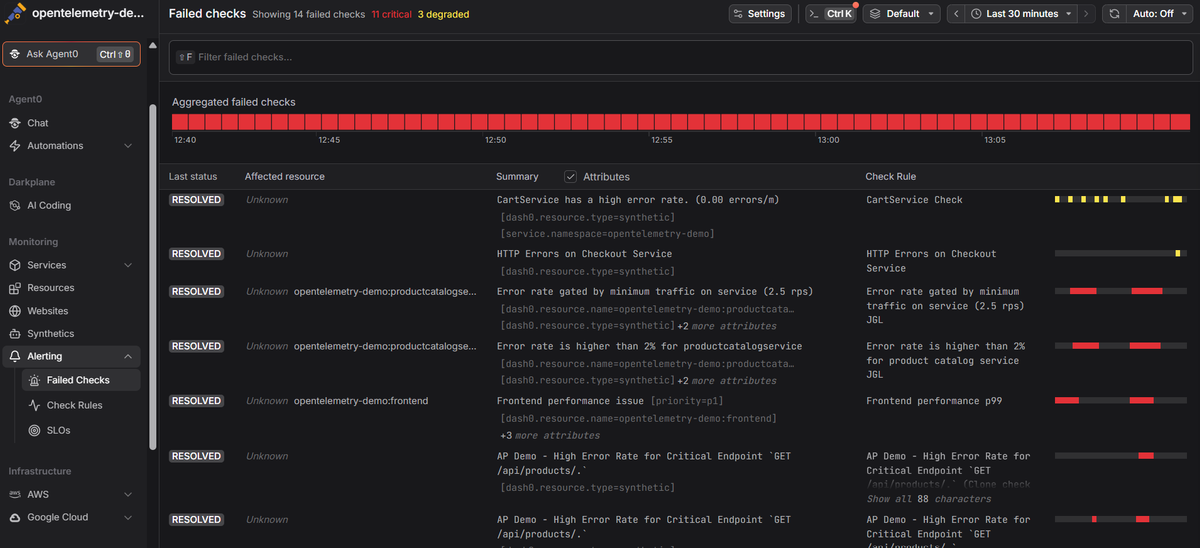 Dash0 is an OpenTelemetry-native observability platform built around OTLP, with full PromQL support across every signal and Perses-compatible dashboards. It covers metrics, logs, distributed tracing, APM, infrastructure and Kubernetes monitoring, RUM via web events, synthetic monitoring, service maps, alerting, and a set of AI SRE agents (Agent0). It is a managed SaaS, and it takes OpenTelemetry data directly rather than through a proprietary agent.
For teams leaving Sentry, the relevant framing is honest: Dash0 handles errors as they appear in traces and logs, with resource-centric correlation, rather than as a dedicated issue-management inbox. It is an observability platform that surfaces errors well, not a drop-in clone of Sentry's exception-triage workflow.
What's good
- OpenTelemetry-native, so instrumentation stays portable. Dash0 ingests OTLP directly (distributed tracing). If you instrument with OpenTelemetry SDKs, that instrumentation works with other OTel backends too, which reduces the instrumentation-and-transport half of lock-in.
- One query language across signals. Full PromQL support for metrics, logs, and traces means engineers who know Prometheus do not context-switch between three query languages, and existing alert rules can carry over.
- Per-signal pricing that does not penalize rich data. Dash0 charges per million spans, log records, and metric data points, with no per-seat, per-host, or base platform fee (pricing). Adding another useful attribute to a span does not create a new billing dimension, which keeps richly attributed OTel data affordable.
The catch
Dash0 is a young platform, and that shows in a few places. Dash0's automatic instrumentation via the Kubernetes operator covers Java, Node.js, .NET, and Python (Python is opt-in); other runtimes rely on you wiring up OpenTelemetry SDKs yourself, which is more setup than dropping in a Sentry SDK. Its integration catalog is smaller than the decade-old incumbents, so niche or legacy systems may need manual OTel collection.
On error tracking specifically, Dash0 does not offer Sentry's dedicated issues inbox, crash-free release health, or session replay. Frontend visibility comes through RUM web events and synthetic checks, not a replay recording of the user's session. If your team's daily habit is triaging an exception feed with assignment and release-health tracking, that exact workflow is not replicated here, and you should test whether trace-and-log-based error investigation fits how you actually work. Finally, be aware that Dash0 is SaaS-only, with no self-hosted option.
Pricing model
Dash0 uses purely consumption-based pricing: per million metric data points, spans, and log records, plus per-thousand synthetic check runs, with no per-seat, per-host, or platform fee. Because it does not meter hosts, seats, active series, or custom attributes separately, the model aligns well with high-cardinality OpenTelemetry data, and you can estimate the bill by multiplying each signal's volume by its published rate. Higher volume still costs more, linearly. Cost-control features include spam filters that reject low-value telemetry before storage and billing, monthly budget limits, and real-time usage dashboards, so you can see spend accrue rather than discovering it on an invoice. Spans and log records cost more per million than metric data points, so trace-heavy microservice architectures should model span volume specifically.
The verdict
Dash0 fits teams standardizing on OpenTelemetry who want a managed backend with predictable per-signal pricing and one query language, and who are comfortable treating errors as part of correlated trace-and-log data. It is a weaker fit if you specifically need Sentry's issue inbox, release health, or session replay, or if you require self-hosting. You can start a free trial with 14 days of unlimited access to test it against real telemetry.
5. Elastic Observability
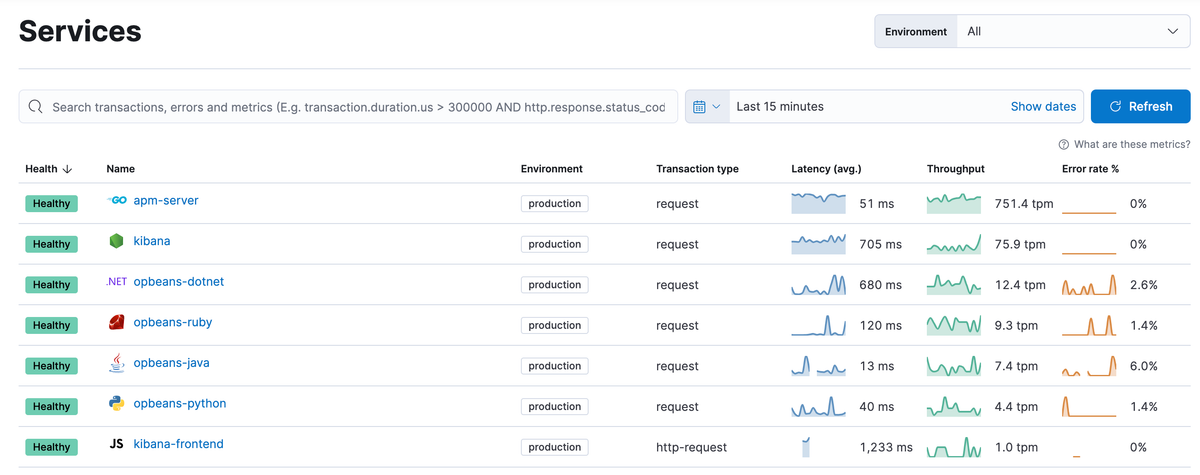 Elastic Observability is the ELK stack grown into a full observability product. It bundles APM, log analytics, infrastructure metrics, RUM, synthetics, and AIOps on top of Elasticsearch, and its search heritage makes it exceptionally strong at slicing and querying logs at volume. For teams already invested in Elastic, adding observability is low marginal effort.
Errors show up through the APM data model, grouped and traceable, though Elastic does not market a standalone Sentry-style error-tracking product with release health and session replay.
What's good
- Search-grade log analytics. Elasticsearch is built for this, and it shows. Full-text search over high-volume logs, fast aggregations, and flexible querying are Elastic's strongest suit and a real reason to pick it over trace-first platforms.
- Three deployment models. Hosted (resource-based), Serverless (usage-based per GB), and fully self-managed under license. That flexibility lets you trade operational effort against cost in a way most SaaS-only rivals cannot.
- OTLP ingestion and broad coverage. Elastic accepts OpenTelemetry data and covers APM, infra, RUM, and synthetics, so it is a plausible single platform rather than just a log tool.
The catch
Pricing takes work to model. Serverless Observability bills on ingest and retention per GB (roughly $0.09 to $0.15 per GB ingested on the Complete tier, plus retention and egress), while Hosted pricing is resource-based and scales with the RAM, storage, and zones you provision (Elastic pricing). Elastic's own billing docs note that billed data volume uses an enriched, normalized size that can exceed your raw index size, which catches teams off guard.
The query experience is a mixed bag for developers. Kibana Query Language (KQL) and the Elastic query surfaces are powerful but less familiar than SQL or PromQL, and there is a learning curve. There is no native session replay, so if replay is a Sentry feature you rely on, Elastic will not fill that gap.
Self-managed Elastic is free at the license level but carries real operational weight at scale: cluster sizing, shard management, and retention tuning become a job. That is the price of the control it offers.
Pricing model
Elastic charges primarily on data: per GB ingested and per GB retained on Serverless, or on provisioned cluster resources on Hosted. This model rewards disciplined log volume and punishes verbosity, since logs are usually the largest signal. Because billed size is normalized and enriched, the metric you should track is Elastic's reported billed volume, not your raw log bytes. Predictability is reasonable once you understand the normalization, and the cost advantage is strongest for log-heavy teams and those already running Elasticsearch. See the pricing page for current rates.
The verdict
Elastic is the pick when logs are your center of gravity and search matters more than a polished error-issue workflow, especially if you already run the stack. If you came to Sentry for frontend error tracking and replay, Elastic is a weaker match; it is an observability and log-analytics platform first.
6. Grafana Cloud
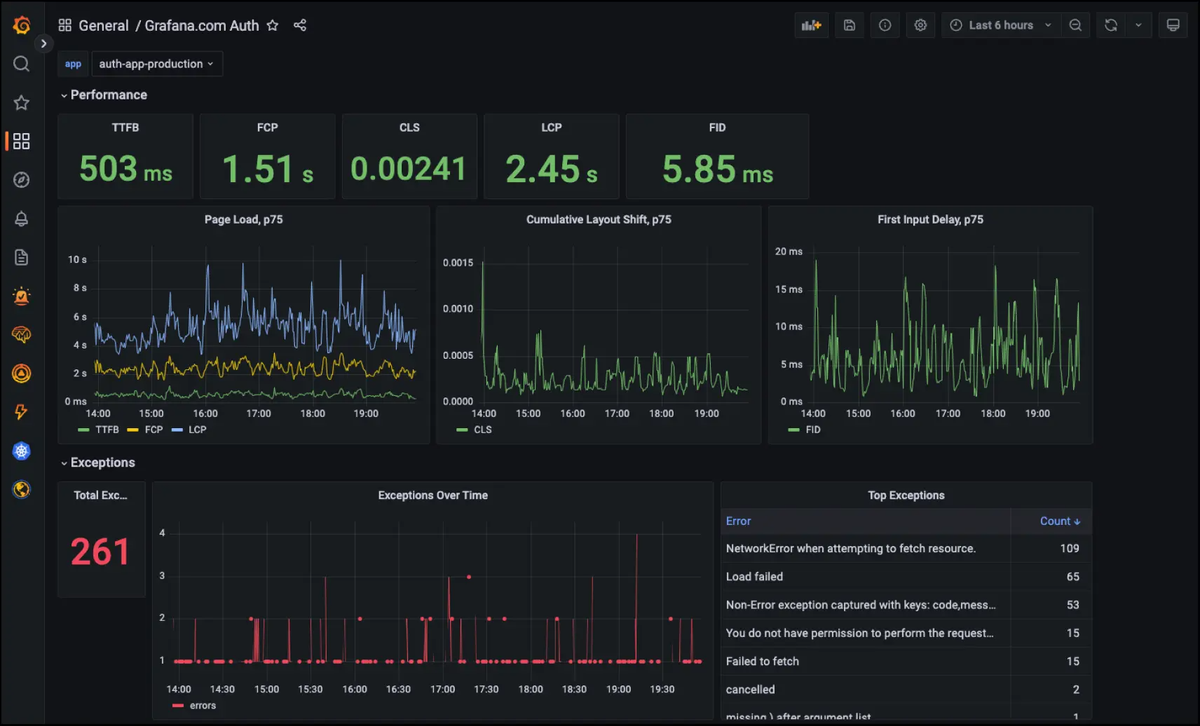 Grafana Cloud is the managed version of the Grafana ecosystem: Mimir for metrics, Loki for logs, Tempo for traces, Pyroscope for profiling, and Faro for frontend observability, behind the dashboards most engineers already know. It is OpenTelemetry and Prometheus friendly, and its free tier is the most generous in the category.
For error tracking, Grafana's answer is Frontend Observability powered by Faro, which captures frontend errors and RUM data. It covers the browser-error piece of Sentry reasonably, but there is no unified backend issue inbox in the Sentry sense.
What's good
- You probably already know the dashboards. If your team lives in Grafana, adopting Grafana Cloud is the shortest learning curve here. Existing dashboards and Prometheus alert rules carry over directly.
- A free tier that covers a real deployment, and Prometheus alignment. The free plan is enough for a genuine small deployment, and native Prometheus and OTel support means your existing instrumentation and PromQL knowledge transfer.
- Frontend observability with Faro. Real user monitoring and frontend error capture, integrated with the rest of your telemetry, gives you the browser-side visibility that pairs with backend traces.
The catch
Grafana's architecture is its own trade-off: each backend is a separate system with its own query language. You write PromQL for metrics, LogQL for logs, and TraceQL for traces, and each bills on its own meter. That composability is powerful and also means "one platform" is really seven or more line items on the invoice, each scaling independently.
Cost drivers stack: metrics bill per thousand active series (cardinality is the silent killer here), logs and traces bill per GB, visualization users bill per active user on top of a monthly platform fee, and Frontend Observability bills per session. A cardinality explosion on the same host count can move a bill from hundreds to thousands. The Adaptive Metrics and Adaptive Logs features that tame this sit behind the higher Advanced tier with a substantial annual minimum.
There is no session replay, and the multi-language, multi-backend model means correlation across signals is less seamless than a single unified data model. You get flexibility in exchange for more moving parts.
Pricing model
Grafana Cloud meters separately across metrics (per thousand active series), logs and traces (per GB), profiles (per GB), frontend sessions (per thousand), and visualization users (per active user plus a platform fee). The per-series metric pricing means high-cardinality telemetry, exactly the rich, attribute-heavy data you want for debugging, is the fastest way to inflate the bill. This incentivizes label discipline, which is healthy up to a point and a debugging constraint past it. Predictability is moderate: usage-based on multiple axes, with the free tier absorbing small teams entirely. Grafana's pricing is published on its site; verify current rates there before committing.
The verdict
Grafana Cloud is the natural choice for teams already fluent in Grafana and Prometheus who want a managed version without running the LGTM stack themselves. If you want tightly correlated errors-to-traces-to-logs in a single data model, or session replay, the composable architecture works against you.
7. SigNoz
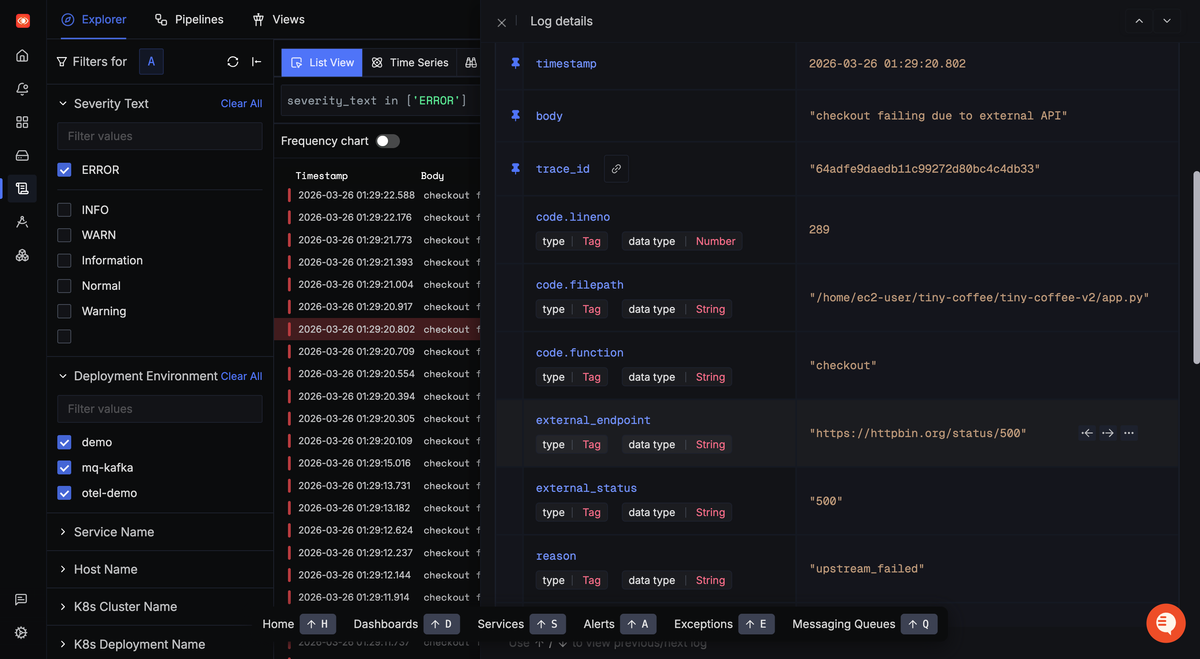 SigNoz is an open-source, OpenTelemetry-native observability platform built on ClickHouse, combining logs, metrics, traces, and an exceptions view in a single UI. It is one of the more credible open-source options for teams that want to leave Sentry without adopting an enterprise SaaS, and it exists as both a free self-hosted Community edition and a managed cloud.
Its Exceptions feature surfaces errors from trace data, which lands somewhere between Sentry's dedicated inbox and a raw trace filter: more structured than the latter, less workflow-rich than the former.
What's good
- OpenTelemetry-native from the ground up. SigNoz ingests OTLP directly and supports any language OpenTelemetry supports, so instrumentation portability is strong and there is no proprietary agent.
- Genuinely open source and self-hostable. The Community edition is free to run on your own infrastructure, which appeals to teams with data-residency requirements or a hard cost ceiling. This is a real option, not a crippled tier.
- ClickHouse-backed performance. The columnar store handles high-cardinality trace queries and full-text log search well, and it has a track record at high daily ingestion volumes.
The catch
Self-hosting means operating ClickHouse, and that is the honest cost. The initial Helm or Docker Compose deployment is quick, but the learning curve arrives later, when queries slow down, retention needs tuning, or schema migrations come up. Running it well at scale is an ongoing job, and the "free" edition is free in license, not in engineering time.
The cloud offering removes that burden but reintroduces a bill: a monthly minimum plus per-GB ingestion for logs and traces and per-sample metrics pricing, with no per-host or per-seat charge. That is transparent, though per-GB and per-sample volumes can be hard to forecast for spiky workloads.
SigNoz stops at observability data. There is no session replay, no crash-free release health, and no incident-management or status-page tooling, so it covers the telemetry side of Sentry but not the full developer-workflow side. Its scope is deliberately narrower than the all-in-one incumbents.
Pricing model
SigNoz Cloud charges per GB for logs and traces and per million samples for metrics, above a monthly minimum, with no per-host or per-seat dimension. Self-hosted is free in license and paid for in infrastructure and operations. The usage-based cloud model is friendly to rich telemetry and easy to reason about per signal, though per-GB pricing rewards trimming verbose logs. The self-hosted path shifts cost entirely to your own compute and your team's time. Predictability is good on cloud once volumes stabilize, and fully in your control (for better and worse) when self-hosted. SigNoz publishes its rates on its site.
The verdict
SigNoz is the pick for teams that want an OpenTelemetry-native platform they can self-host, value control and transparency, and have the engineering capacity to run ClickHouse, or want a usage-priced managed version of the same. It is not the choice if you need Sentry's frontend replay and release-health workflow, or if you have no appetite for operating storage infrastructure.
8. AppSignal
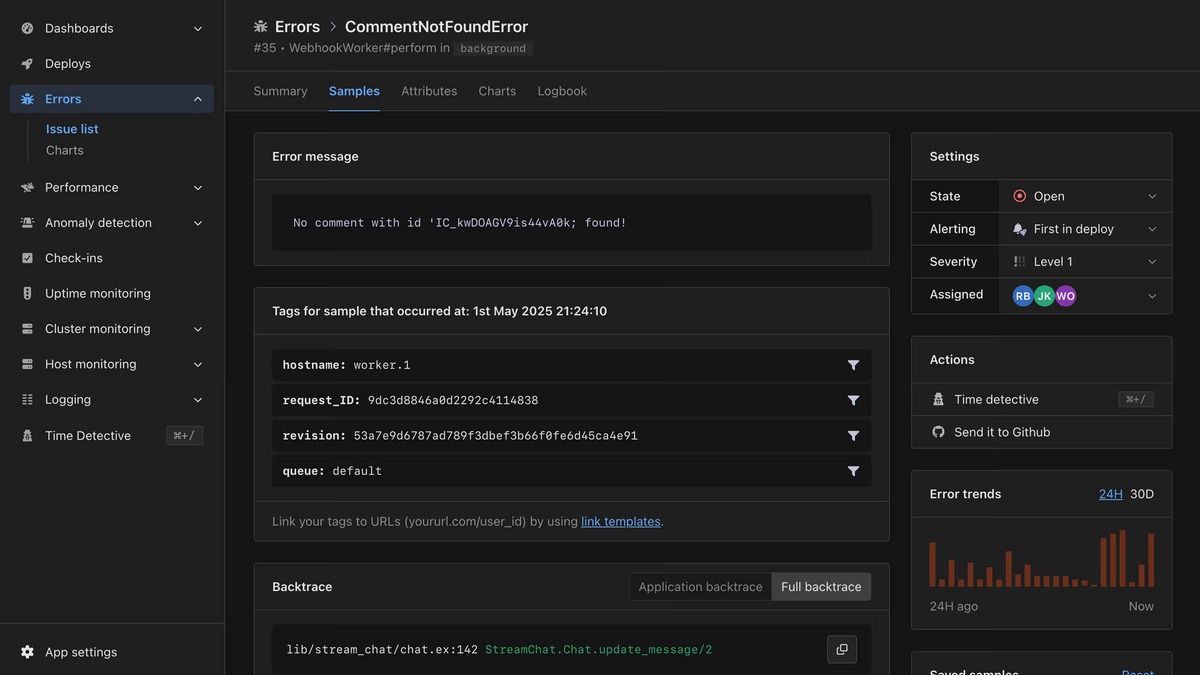 AppSignal is a developer-focused, all-in-one monitoring tool that bundles APM, first-class error tracking, log management, host metrics, uptime monitoring, anomaly detection, and RUM into a single dashboard with a single flat price. Of everything on this list, it is the closest in spirit to Sentry: built for developers and opinionated about keeping things simple.
Its error tracking is a genuine first-class feature, not a trace afterthought: it captures exceptions, groups them, alerts on them, and ties them to performance data. For a small team that outgrew Sentry's pricing but still thinks in errors, it is a natural landing spot.
What's good
- Real all-in-one simplicity. Error tracking, performance, logs, host metrics, and uptime in one tool with one predictable price. Setup for a supported framework is close to adding a dependency and an API key, which matches the Sentry onboarding experience.
- Request-based pricing with no seat tax. You pay by monthly request volume, with unlimited apps, hosts, and users. For a growing team, not paying per head is a meaningful difference from most alternatives here.
- No overage surprises. AppSignal does not bill overages or cut you off mid-incident; it starts an upgrade conversation only after you exceed limits consistently. That predictability is rare in this category.
The catch
The hard limit is language support. AppSignal has native agents for Ruby, Elixir, Node.js, Python, and frontend JavaScript, and nothing for Java, Go, .NET, or PHP. If your stack is outside that set, AppSignal is simply not an option, and that disqualifies it for many teams before any other consideration.
The integration ecosystem is small next to the incumbents. If you rely on turnkey integrations for a wide range of databases, queues, and cloud services, AppSignal will feel sparse compared to Datadog's catalog. It is built to cover what most teams in its supported languages actually need, not to be exhaustive.
There is no session replay, so the specific Sentry feature of watching a user's session leading up to an error is absent. And while request-based pricing is predictable, very high-throughput applications should check the request math, since that is the axis the bill scales on.
Pricing model
AppSignal charges by monthly request volume in flat tiers, with unlimited apps, hosts, and users, plus a small add-on for extra log storage. This is the most predictable model on the list: you pick a request tier and that is essentially the bill, without per-host, per-seat, or per-signal meters interacting. The trade is that request volume is the only lever, so it does not finely reward reducing one signal type, and extremely high request counts push you up tiers regardless of how much telemetry each request carries. For teams within its supported languages and moderate request volumes, predictability is excellent. Confirm current tiers on the pricing page.
The verdict
AppSignal is the easy recommendation for small-to-midsize teams on Ruby, Elixir, Node.js, or Python who want Sentry's developer-first simplicity plus APM and infrastructure, at a flat and predictable price. It is a non-starter for Java, Go, or .NET shops, and too narrow for teams that need a deep integration catalog or session replay.
Which tool fits your situation
The right choice depends on what you are actually trying to replace about Sentry, more than on which platform is "best."
If you are a small-to-midsize team on Ruby, Elixir, Node.js, or Python and you liked Sentry's developer-first feel but not its bill, AppSignal is the most direct swap: first-class error tracking plus APM and infrastructure, one flat price, minimal setup.
If you want a managed OpenTelemetry-native platform with predictable per-signal pricing and are comfortable treating errors as part of correlated traces and logs rather than a separate inbox, Dash0 fits, especially if you are already standardizing on OTLP and PromQL.
If you have the engineering capacity to run ClickHouse and want an open-source, self-hostable option for data-residency or cost-ceiling reasons, SigNoz is the strongest choice here, with a usage-priced cloud as the managed fallback.
If your team already lives in Grafana and Prometheus, Grafana Cloud is the shortest path, and its free tier may cover you entirely at small scale.
If logs and search are your center of gravity, or you already run Elasticsearch, Elastic Observability gives you the best log analytics on this list, with the option to self-manage.
If you need one vendor for absolutely everything and can manage the bill, Datadog is the most complete platform and has the closest session-replay parity with Sentry. If you have large fleets but a contained debugging headcount, New Relic's ingest-based pricing often wins. And if you are a large enterprise with sprawling hybrid infrastructure and an incident-response operating model, Dynatrace's automation earns its premium.
Final thoughts
There is no single Sentry replacement, because Sentry is two products wearing one name: a developer-first error tracker and an increasingly full observability suite. The tools here split along that seam. AppSignal and, on the frontend, Datadog come closest to Sentry's error-and-replay workflow. Elastic, Grafana Cloud, SigNoz, New Relic, and Dynatrace are observability platforms first that surface errors as part of a larger picture. What actually decides this is how your team debugs: by triaging an issues inbox, or by pivoting through traces and logs. That determines which half of Sentry you need to reproduce.
The other seam is pricing, which is usually what sent you searching in the first place. Host-based models (Datadog, Dynatrace) reward small fleets and punish autoscaling. Ingest-based models (New Relic, Elastic, SigNoz) reward disciplined log volume. Seat-based components (New Relic, Grafana users) price access to the tool. Per-signal and request-based models (Dash0, AppSignal) aim for the fewest interacting meters. Map your architecture to the model, not to the headline rate.
If your reason for leaving is a mix of unpredictable, multi-dimensional billing and a desire to stop being locked into a proprietary agent, an OpenTelemetry-native platform with per-signal pricing addresses both at once: instrumentation stays portable through OTLP, one PromQL surface spans your signals, and the bill is the sum of a few published rates rather than a dozen interacting meters. That is the specific gap Dash0 is built for, with the trade that you give up Sentry's dedicated issue inbox, release health, and session replay in exchange.
Whatever you pick, test it against your real telemetry before you migrate, because sampling defaults, error-grouping quality, and billed data volume all behave differently under your traffic than in a demo. Sign up for a free Dash0 account with 14 days of unlimited access if you want to run that test on OpenTelemetry data.
Frequently asked questions
Which Sentry alternative is closest to a drop-in replacement? For error tracking specifically, AppSignal is the closest in spirit for teams on Ruby, Elixir, Node.js, or Python, since it treats errors as a first-class feature with Sentry-like setup simplicity. For frontend error tracking plus session replay, Datadog's RUM and replay come closest to feature parity. No single tool replaces every Sentry feature, so match the alternative to the specific Sentry capabilities you rely on.
Do these alternatives support session replay like Sentry? Not all of them. Datadog, New Relic, and Dynatrace offer session replay or equivalent RUM replay. Elastic, Grafana Cloud, SigNoz, AppSignal, and Dash0 do not offer a native session-replay recording, though several provide real user monitoring for frontend errors and performance. If replay is central to your debugging, that narrows the field considerably.
Will switching from Sentry lock me into another vendor? Partly, on every platform. OpenTelemetry-native tools like Dash0 and SigNoz keep your instrumentation and transport portable, so the SDK work you do can move to another OTel backend. Proprietary-agent platforms like Datadog and Dynatrace make instrumentation itself sticky. On every platform, though, your dashboards, alert rules, saved queries, and investigation workflows stay behind when you switch. OpenTelemetry reduces lock-in; it does not eliminate it.
How do I compare pricing across such different models? Do not compare headline rates. Map your own architecture to what each model charges on: host count and autoscaling behavior for host-based tools, monthly ingest volume for per-GB tools, team size for seat-based tools, and signal volumes for per-signal tools. Then estimate your bill under each. The same workload can be cheapest on different platforms depending on whether your cost driver is hosts, data, seats, or requests.

