

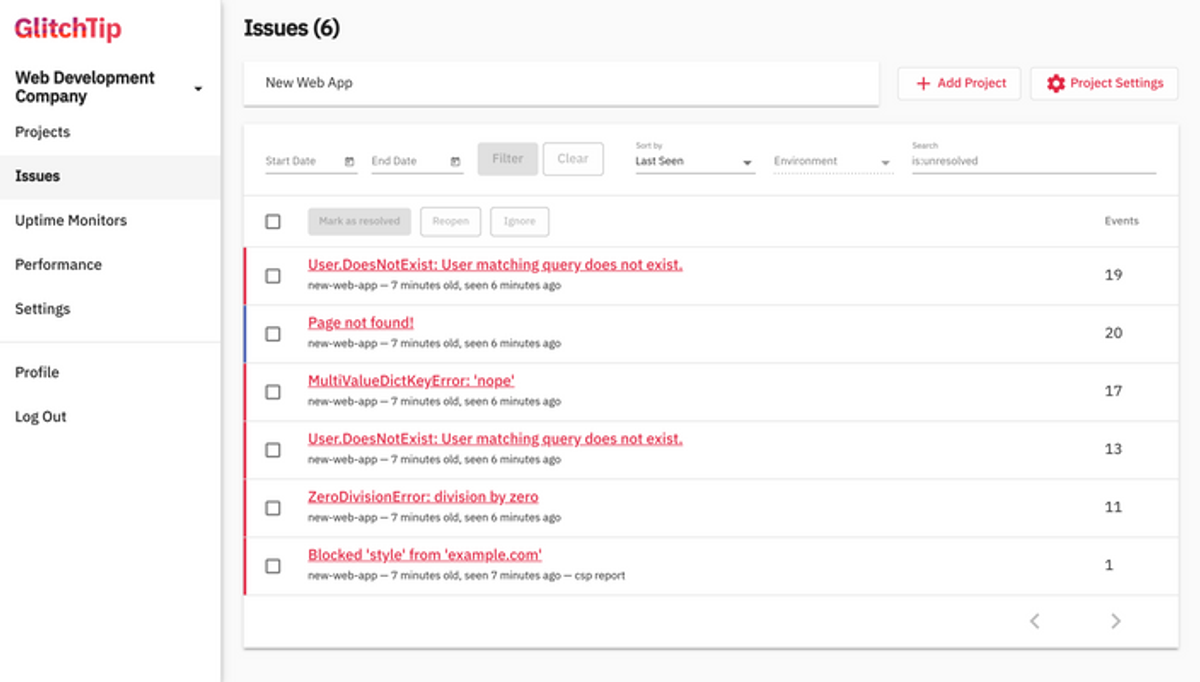
Like others, your team picked up GlitchTip because it did one thing without asking much of you. And there is nothing wrong with that. You point your existing Sentry SDKs at it, change the DSN (Data Source Name), and exceptions start flowing into a clean interface with grouping, alerts, and uptime checks. Self-host it on a small box for free, or pay a predictable monthly fee for the hosted version. For a lot of teams, that is genuinely all error tracking needs to be.
 Then something changes. Maybe your hosted event count creeps toward the limit, and you notice that GlitchTip meters events across four things at once: issues, uptime checks, performance transactions, and release-file storage. Maybe you want session replay or real distributed tracing and hit the wall where GlitchTip deliberately stops. Maybe the self-hosted instance you set up two years ago now needs upgrades and backups that nobody owns. Or maybe you have gone the other way, and running a separate error tracker next to a separate metrics tool next to a separate log tool has started to feel like three problems where you wanted one.
That is the moment people start looking around, and the search immediately splits. One direction is a lighter, cheaper, or more capable version of the same thing: another dedicated error tracker that groups exceptions and shows stack traces, ideally one you can still feed with Sentry SDKs. The other direction is a platform that absorbs error tracking into a broader picture of traces, logs, and metrics, so errors become one correlated signal instead of a standalone tool. Both are valid. They lead to very different products.
This guide covers eight alternatives across that whole range, from single-container self-hosted trackers to managed OpenTelemetry-native platforms. For each one, the questions that actually decide a migration: how hard is it to move off your current instrumentation, how deep does the error tracking really go, what else does it see, how you run it, and what its pricing model charges on when your traffic spikes at the worst possible moment.
Why choosing a GlitchTip alternative is tricky
The trap is treating every tool on this list as interchangeable because they all "do error tracking." They do not do the same job. GlitchTip occupies a specific niche: a focused, Sentry-compatible error tracker that runs light. Some alternatives are lighter still. Some are far heavier and only call error tracking one of their features. Matching the tool to what you actually miss about GlitchTip matters more than any feature checklist.
Start with migration cost, because it is GlitchTip's whole reason for existing. GlitchTip speaks the Sentry SDK protocol, so adopting it was a one-line DSN change. Any alternative that also accepts Sentry SDK events lets you switch the same way. Anything that requires a proprietary agent or a full OpenTelemetry instrumentation project is a different level of effort, and that effort is real work spread across every service you run.
Then there is error-tracking depth. GlitchTip gives you exception capture, grouping into issues, stack traces, basic release tracking, and alerts. It does not give you source-map-resolved frontend stack traces at Sentry's level, crash-free release health, or session replay. When you evaluate an alternative, the real question is whether errors are a managed object with an owner and a lifecycle, or a filter you apply to trace data. A platform that shows you a spike in failed spans is not the same as an issues inbox you triage, even when both surface the same underlying error.
Signal coverage is the next fork, and it maps directly to which of the two search directions you are on. A dedicated tracker sees errors and little else, which is fine if errors are all you want. A full observability platform sees traces, logs, metrics, and infrastructure, and its value is correlation: click an error, land on the trace that produced it, read the logs from that exact request. That power comes with more setup, more data, and usually a bigger bill.
Deployment model separates this list as sharply as anything. GlitchTip's appeal for many is that it self-hosts on four containers instead of Sentry's forty. Some alternatives here are even lighter to run yourself. Others are SaaS-only, which removes all the operational work and removes the option of keeping error data on your own infrastructure for compliance or data-residency reasons. If you chose GlitchTip specifically to self-host, that constraint eliminates several entries before you compare anything else.
Frontend and session replay deserve their own scrutiny, because it is the feature GlitchTip lacks that people most often leave for. Replay records DOM mutations and network activity, which means it can capture form fields, tokens, and personal data unless masking is set up correctly. Any tool that offers replay has to answer where that data is stored, whether masking happens before or after transmission, and what happens when a secret lands in a creatively named field your redaction rules did not anticipate. Replay is a debugging superpower and a data-collection liability at the same time.
Finally, the cost model, which is often the thing that sent you searching. GlitchTip's event-based pricing is simple until you remember it counts uptime checks and performance transactions against the same quota as errors. Alternatives charge on very different axes: per event, per GB ingested, per user seat, per active metric series, per request, or per signal. The headline rate tells you almost nothing. What matters is which axis scales with your architecture, and whether one bad deploy that generates an error storm quietly triples your invoice.
We'll evaluate each tool against these criteria:
- Sentry SDK migration: can you switch with a DSN change, or do you re-instrument
- Error-tracking depth: real issue grouping, release health, and source-map stack traces, versus errors surfaced inside trace and log data
- Signal coverage: errors only, or metrics, logs, traces, and infrastructure with correlation between them
- Deployment model: self-hosted open source, managed SaaS, or both, and the operational weight of each
- Frontend and session replay: whether it exists, and how it handles personal data and masking
- Instrumentation and lock-in: Sentry SDK, proprietary agent, or OpenTelemetry-native, and what stays portable if you leave
- Cost model: what dimensions it charges on and how predictable the bill is under an error storm
How they compare
| Tool | Sentry SDK migration | Error-tracking depth | Signal coverage | Deployment | Cost model | Lock-in |
|---|---|---|---|---|---|---|
| Sentry | Native (it is Sentry) | Deepest: issues, release health, source maps, replay | Errors, tracing, replay, logs, cron, profiling | SaaS or self-host (40+ containers) | Per-event across many separate meters | Medium: SDKs are OTel-friendly, workflows are not |
| Bugsink | DSN change, drop-in | Focused: grouping, full stack traces, local variables | Errors only | Self-host (single container) or EU SaaS | Flat infra cost self-hosted, fixed tiers hosted | Low on data, source-available (BSL) license |
| Rollbar | SDK swap, not Sentry-compatible | Strong grouping, deploy tracking, session replay | Errors, replay, RQL analytics | SaaS only | Per-occurrence, unlimited users, overage controls | Medium: proprietary SDK and data model |
| SmartBear Insight Hub (Bugsnag) | SDK swap, not Sentry-compatible | Stability score, release health, strong mobile | Errors, performance spans, OTel tracing | SaaS only | Per-event plus per-span, unlimited users on paid | Medium: proprietary SDKs, OTel tracing option |
| Honeybadger | SDK swap, not Sentry-compatible | First-class errors plus uptime, cron, status pages | Errors, uptime, logs (Insights), checks | SaaS only (self-host on enterprise) | Per-error plus daily log ingest, unlimited users | Medium: SDK-based, limited languages |
| Dash0 | Re-instrument with OpenTelemetry | Errors via traces and logs, no issue inbox | Metrics, logs, traces, RUM, synthetics, infra | SaaS only | Per-signal (spans, logs, metric points) | Low on instrumentation, dashboards portable via Perses and PromQL |
| Highlight.io / LaunchDarkly Observability | SDK swap, OTLP ingest | Errors plus session replay, logs, traces | Errors, replay, logs, traces, RUM | Self-host (OSS) or LaunchDarkly SaaS | Usage-based on the hosted product | Low on data, but standalone hosting is sunset |
| SigNoz | Re-instrument with OpenTelemetry | Exceptions view from traces | Metrics, logs, traces, exceptions | Self-host free or managed cloud | Per-GB (cloud) or self-host infra cost | Low on instrumentation, self-host option |
Pricing structures are analyzed per tool below. Rates were verified against each vendor's public pricing in mid-2026. Confirm current numbers before you commit, because this category changes its packaging often.
1. Sentry
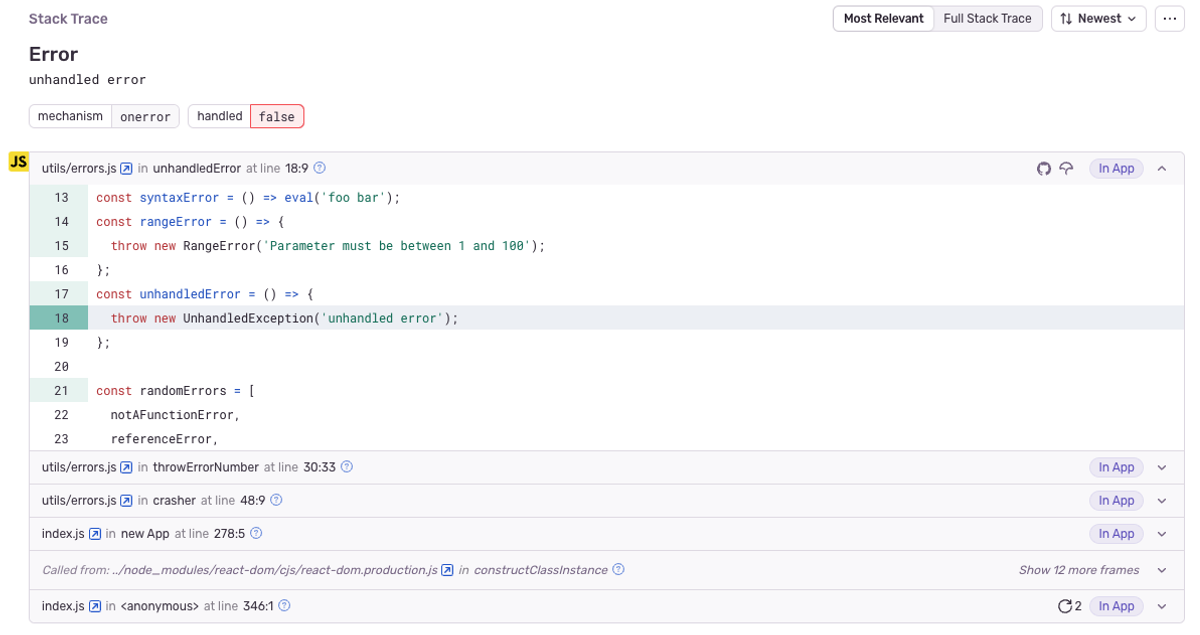
Sentry is the tool GlitchTip was built to imitate, which makes it the most obvious upgrade path. GlitchTip implements a subset of Sentry's ingest API, so moving from GlitchTip to Sentry means pointing your DSN back at the tool the SDKs were designed for. Everything you were approximating with GlitchTip, you get in full: fingerprint-based issue grouping, source-map-resolved stack traces for minified frontend code, release health with crash-free session and user rates, suspect-commit attribution, and assignment workflows.
Sentry has also grown well beyond error tracking. It now meters tracing spans, session replay, structured logs, cron and uptime checks, and continuous profiling, each as its own product with its own quota. That breadth is the reason to come back to Sentry, and, as you will see, the reason its bill behaves the way it does.
What's good
- The deepest error workflow in the category. If your team lives in an issues inbox, assigns bugs, and ships against a crash-free release-health target, nothing else here matches Sentry's polish. It is the product every other error tracker gets compared to.
- Session replay and source maps done properly. Replay with configurable privacy masking, plus automatic source-map resolution for frontend stack traces, are the two features GlitchTip users most often leave to get. Sentry has both, mature.
- The self-hosted option still exists and is free. You can run Sentry's open-source build yourself at no license cost, which keeps error data on your own infrastructure if compliance demands it.
The catch
The self-hosted build is the honest inverse of GlitchTip's biggest selling point. Sentry's open-source stack runs 40-plus containers and wants 16 GB of RAM as a floor, which is exactly the operational weight GlitchTip was created to avoid. Most small teams that self-host Sentry to escape SaaS pricing end up spending more in engineering time than the SaaS plan would have cost. If self-hosting was your reason for choosing GlitchTip, self-hosted Sentry is a step backward.
On the hosted side, the pricing is where teams get surprised. Sentry bills errors, spans, replays, logs, attachments, cron monitors, and profiling as separate meters, each with its own overage rate, layered on top of plan tiers that gate single sign-on (SSO), audit logs, and retention. At low volume this is predictable and fair. At scale, the number of independent meters is the problem: one noisy deploy can spike a single category without warning, and one team reported a bill spike of more than 3x after a day of roughly 1.4 million events. The AI features (Seer) sit behind a separate per-contributor charge.
Pricing model
Sentry's Developer plan is free with 5,000 errors a month and a single user. Paid plans start at Team, around $26 a month billed annually, and Business at roughly $80, both including 50,000 errors and 5 million spans, with the difference being compliance features and retention rather than base quota (Sentry pricing). The model charges per event across many categories, and errors are the most expensive unit. This scales linearly and rewards filtering low-value events, which is healthy, but the multi-meter structure means predicting the bill requires modeling each category against your traffic. Error storms are the specific risk: event-based billing turns a runaway exception into a line item. Verify current rates and overage tiers on the pricing page.
The verdict
Come back to Sentry if what you missed about GlitchTip was depth, and you are willing to pay SaaS prices for a first-class error workflow with replay and release health. Do not self-host it to save money unless you have a platform team with spare capacity, because the operational bill replaces the software one.
2. Bugsink
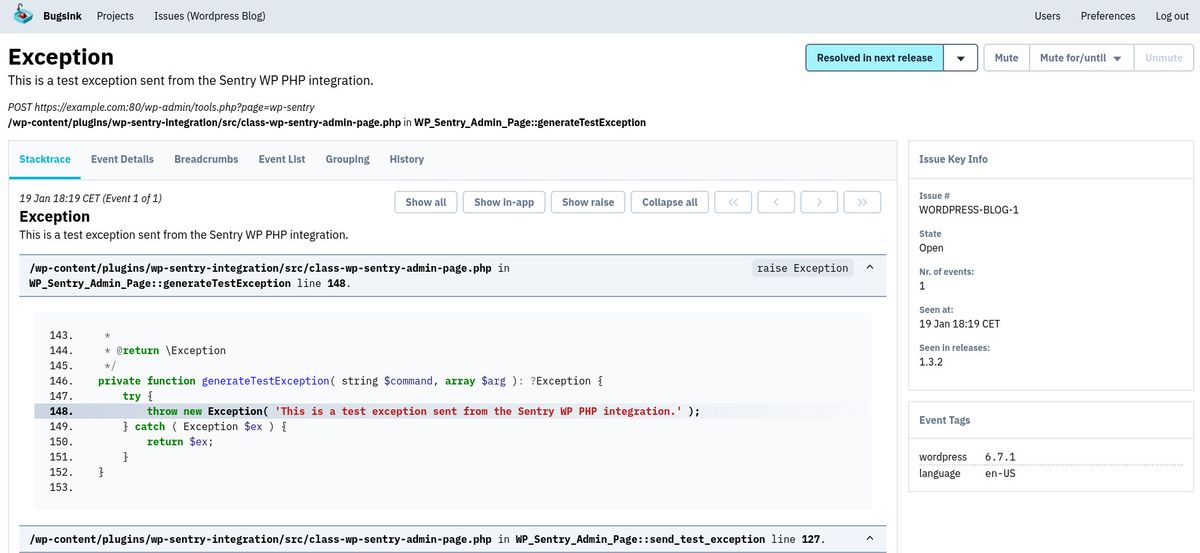
Bugsink is the closest thing on this list to GlitchTip's spirit, taken one step further toward minimalism. It is a self-hosted error tracker that is fully compatible with Sentry's open-source SDKs, so you adopt it by changing a DSN, exactly as you did with GlitchTip. The pitch is deliberately narrow: capture the error, show the stack trace with local variables at the point of failure, group similar events, and stop there. No performance monitoring, no session replay, no distributed tracing.
It was built by a developer who tried to self-host Sentry, found the stack far too heavy, and wrote a lighter alternative. That origin shows in the deployment story. Bugsink runs as a single Docker container, defaults to SQLite so you need no separate Redis or database, and fits comfortably in 512 MB of RAM.
What's good
- Drop-in Sentry SDK compatibility, like GlitchTip. Switching from GlitchTip to Bugsink is another one-line DSN change, since both speak the same protocol. Your instrumentation does not move.
- The lightest self-hosting on this list. A single container with SQLite means setup takes minutes and ongoing operations are close to nothing. For a solo developer or a two-person team, it is the least infrastructure you can run and still have real error tracking.
- Local variables in stack traces. Bugsink captures the values of local variables at the moment of the exception, which is often the difference between reproducing a bug and guessing at it.
The catch
Bugsink's focus is also its ceiling. It does errors and nothing else, so if your reason for leaving GlitchTip was wanting performance monitoring, uptime checks, or session replay, Bugsink does not have them and does not intend to. It is a narrower tool than GlitchTip, not a broader one.
The licensing deserves a clear-eyed note. Bugsink is source-available under a Business Source License rather than a standard open-source license, which is not the same thing as GlitchTip's MIT license. For most teams self-hosting for internal use this changes nothing, but if you have a strict open-source-only policy, read the license terms before you commit. The project is also young, first released publicly in early 2025, so the community and integration ecosystem are smaller than GlitchTip's, which in turn is smaller than Sentry's.
Pricing model
Self-hosted Bugsink is free of per-event billing entirely: you pay for the VPS it runs on and nothing else, which means event volume is capped only by your disk. That is the strongest cost story in the category for high-volume error tracking, because a bad deploy that generates millions of events costs you nothing extra. Bugsink also offers a hosted EU SaaS with a free tier and fixed paid tiers starting around $16 a month, positioned to cut a Sentry invoice substantially at higher volumes (Bugsink pricing). The hosted tiers are fixed rather than metered, so the bill is predictable. Confirm current tiers before committing.
The verdict
Bugsink is the natural move for a GlitchTip user who wants to go lighter, not heavier, and whose only real need is error tracking they can own. It is an excellent fit for solo developers, minimalist teams, and compliance-driven setups that need errors to stay on-premises. It is the wrong choice if you were hoping to gain features rather than shed them.
3. Rollbar
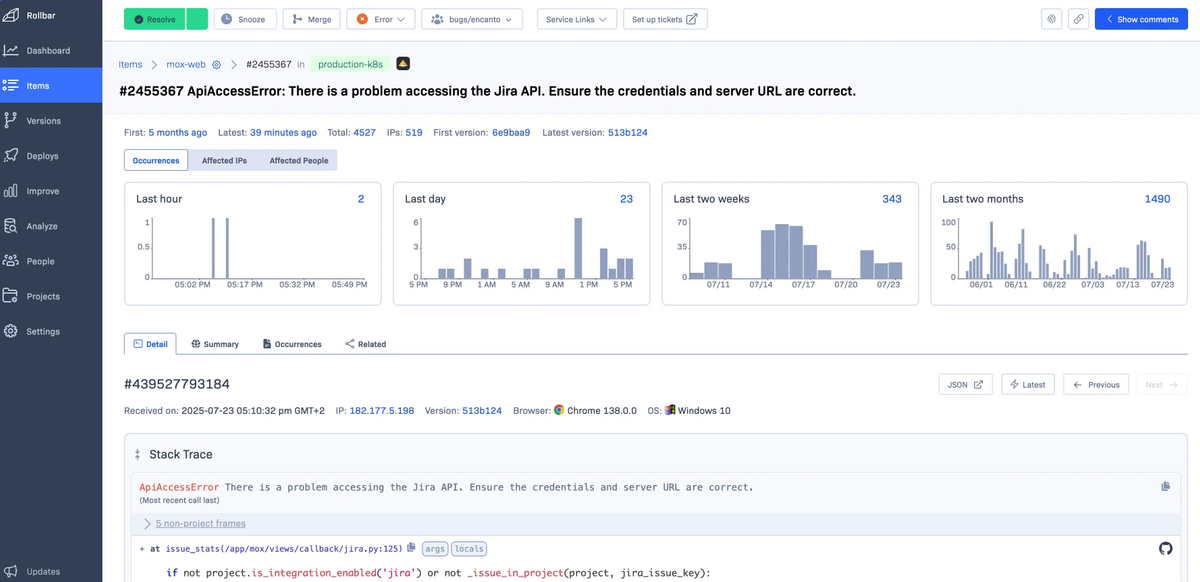
Rollbar is a commercial error monitoring platform that has been in the category almost as long as Sentry, built around fast triage and automated grouping. It is not Sentry-SDK-compatible, so migrating from GlitchTip means swapping in Rollbar's own SDKs across your services rather than changing a DSN. In exchange, you get a tool whose entire design goal is turning a flood of raw occurrences into a short list of issues worth acting on.
Rollbar covers a broad set of languages and frameworks, links errors to the deploys and commits that caused them, and has added session replay and an AI agent (Resolve) that proposes root causes and can open a pull request with a fix.
What's good
- Grouping that fights alert fatigue. Rollbar's fingerprinting is a genuine strength, and teams report it collapsing hundreds of raw notifications into a handful of meaningful issue groups. If GlitchTip's grouping felt noisy, this is a real upgrade.
- Unlimited users on every paid tier. You are not taxed per engineer, so a fifty-person team pays the same base rate as a ten-person team at the same volume. That removes the seat-cost tension that some alternatives carry.
- Three explicit overage controls. Rollbar lets you choose stop-at-limit (the default), on-demand billing, or a hard budget cap, so an error storm does not have to mean a surprise invoice. Few tools give you this much control over the failure mode.
The catch
Migration is the first cost. Because Rollbar uses its own SDKs rather than the Sentry protocol, moving from GlitchTip is real instrumentation work, not a config change, and that effort scales with the number of services you run. It also means your instrumentation investment is now Rollbar-specific and does not travel with you if you leave.
The pricing steps up sharply once you outgrow the free tier. The Free plan is genuinely usable at 5,000 occurrences a month with unlimited users, but the next real tier, Essentials, starts around $99 a month billed annually for 25,000 events, which is a large jump from GlitchTip's hosted rates at comparable volume (Rollbar pricing). Some advanced capabilities, including the RQL query language and HIPAA support, sit behind the higher Advanced tier. The interface is powerful but dense, and takes some learning before it feels navigable.
Pricing model
Rollbar meters occurrences as the primary unit, with session replays and analytics credits as secondary dimensions, and includes unlimited users on all plans. The occurrence-based model scales with error volume the way GlitchTip's does, so an error storm still drives cost, but the built-in stop-at-limit and budget-cap controls let you bound that risk explicitly rather than discovering it after the fact. Predictability is good if you configure the overage mode deliberately, and poor if you leave it on on-demand and forget. The free-to-Essentials jump is the main thing to model. Check the pricing page for current tiers and overage rates.
The verdict
Rollbar suits teams that ship frequently, drown in duplicate errors, and want automated grouping plus tight overage control, and that do not mind re-instrumenting to get it. It is a poor fit if you specifically valued GlitchTip's Sentry SDK compatibility, or if the jump from free to roughly $99 a month lands awkwardly for your volume.
4. SmartBear Insight Hub (Bugsnag)
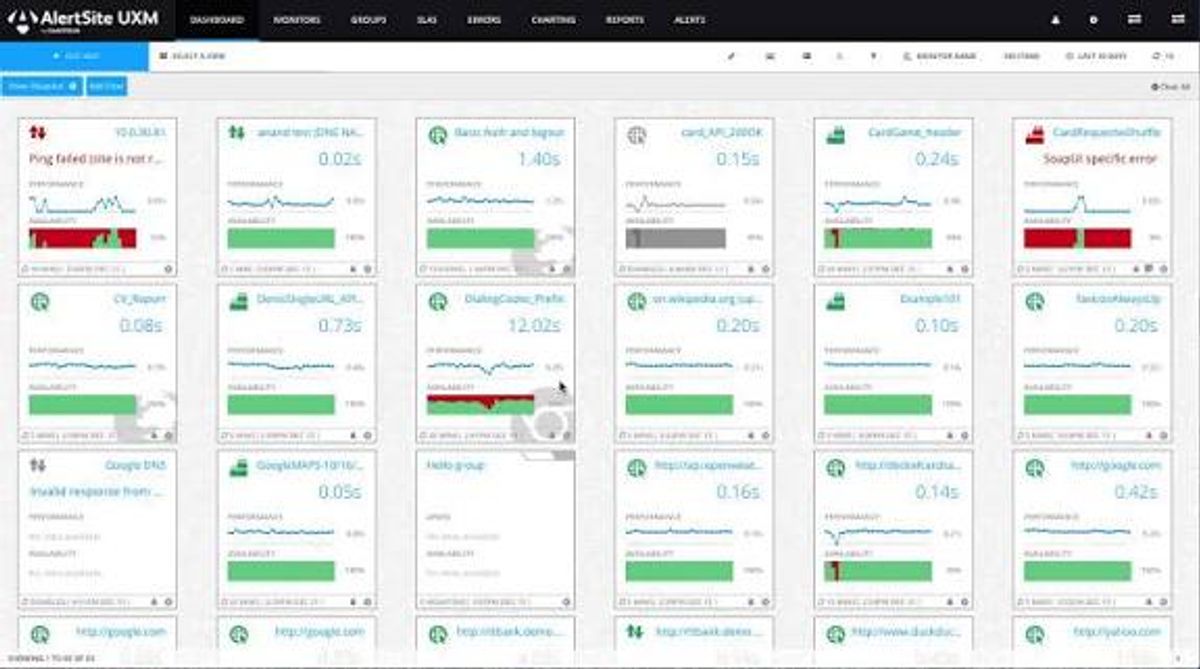
SmartBear Insight Hub, the product formerly and still widely known as Bugsnag, is a commercial error and stability platform with a distinctive framing. Instead of counting raw errors, it centers on a stability score: the percentage of user sessions that do not crash. You set a target, say 99.9%, and the tool tells you when a release drifts below it. For teams that report app health to leadership, or that make ship-or-fix decisions per release, that single number is more actionable than a raw error count.
It is not Sentry-SDK-compatible, so migration from GlitchTip means adopting Insight Hub's SDKs. Its strongest territory is mobile, with well-regarded iOS, Android, and React Native support across 50-plus platforms, and it has added OpenTelemetry-native distributed tracing and performance spans alongside the core crash reporting.
What's good
- The stability score reframes release decisions. "v2.1 is at 98.5% stability" is a more useful sentence than "v2.1 has 347 errors," because it ties directly to user impact and a target you can defend. This is Insight Hub's real differentiator over GlitchTip and most of this list.
- Best-in-class mobile crash reporting. Symbolication, ProGuard mapping, and crash-free session metrics are handled natively and well. If mobile is a meaningful part of your stack, this is a genuine reason to look here.
- Overage behavior you choose in advance. When you exceed a quota, Insight Hub either auto-upgrades you or begins rate-limiting, and you decide which, so a bad day does not silently generate a surprise bill.
The catch
The migration cost is the same as Rollbar's: proprietary SDKs mean re-instrumenting every service, not changing a DSN, and that ties your instrumentation to SmartBear going forward. For a GlitchTip user whose whole workflow was built on Sentry SDK compatibility, that is the friction to weigh first.
There is no session replay, so if you were leaving GlitchTip to gain replay, this is not the tool for it. The free tier's data retention is tight at seven days, which limits how far back you can investigate without upgrading. And the product now lives inside SmartBear's larger suite, which means its roadmap is shaped by that portfolio rather than by a standalone error-tracking focus. Whether that is a risk or a reassurance depends on how you feel about consolidation.
Pricing model
Insight Hub has a free tier covering 7,500 events and 1 million spans a month for one user, with paid Select and Preferred plans starting low and scaling by event and span volume, unlimited users on paid tiers, and SSO plus feature flags on Preferred (Insight Hub pricing). Publicly listed entry rates sit around $20 to $39 a month depending on source and billing period. The model charges on two axes, events and performance spans, so a trace-heavy application should model span volume as well as error count. Predictability is reasonable at moderate volume because of the choose-your-overage-behavior design. Confirm current tiers before committing.
The verdict
Insight Hub is the standout for mobile and cross-platform teams that manage releases against an explicit stability bar rather than reacting to alerts. It is a weaker fit for backend-only web teams who valued GlitchTip's Sentry compatibility, and a non-starter if session replay is what you came for.
5. Honeybadger
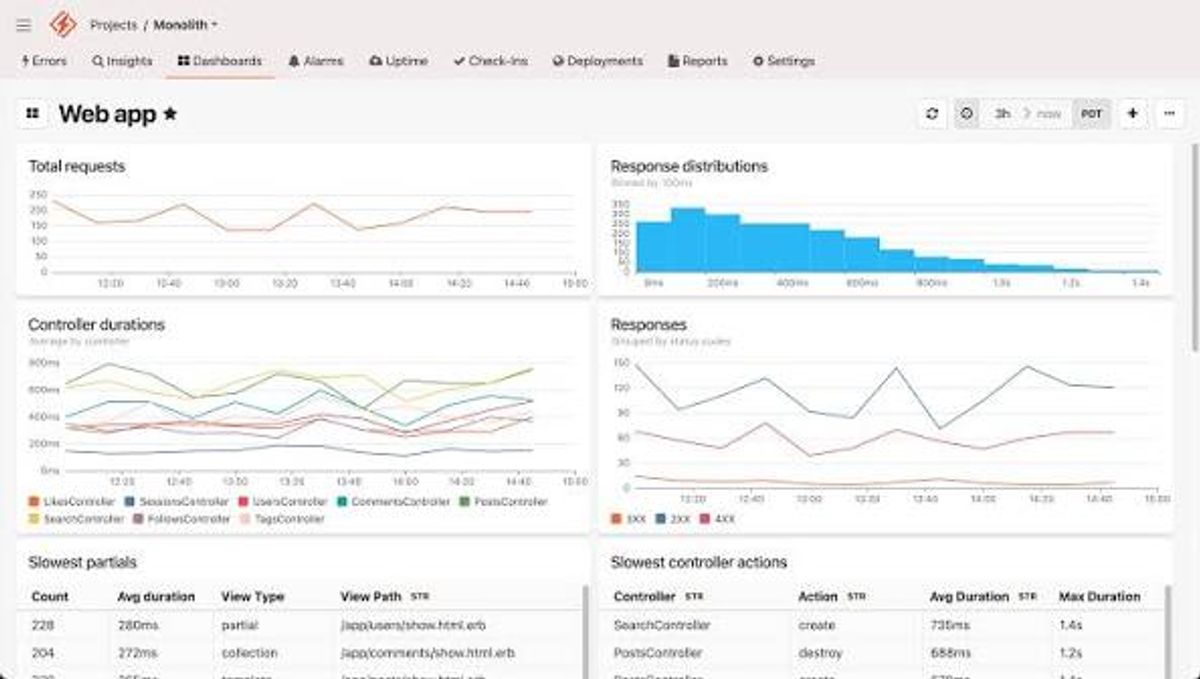
Honeybadger is a developer-focused monitoring tool that bundles more than GlitchTip into one predictable product. Alongside error tracking, it includes uptime monitoring, cron and heartbeat checks, status pages, dashboards, and log-based observability (Insights), all from one vendor at one price. It is built and run by a small, bootstrapped team that has been at it for over a decade, which shows in the developer-led support and the deliberately uncomplicated pricing.
Like the other commercial trackers here, it uses its own SDKs rather than the Sentry protocol, so switching from GlitchTip is a re-instrumentation, not a DSN swap. Its language support centers on Ruby, Elixir, and the common web and backend stacks (JavaScript, Node, Go, Python, PHP, Java).
What's good
- Bundled operational monitoring, not just errors. GlitchTip includes uptime checks, and Honeybadger extends that idea: errors, uptime, cron and heartbeat monitoring, and a public status page in one tool. For a small team that wants fewer vendors, that consolidation is the point.
- Unlimited users on paid plans. Like Rollbar, Honeybadger does not charge per seat, so getting the whole team into the tool does not scale your bill by headcount.
- A humane overage policy. Honeybadger keeps processing up to 125% of your monthly quota before it stops, and sends warning emails along the way, so you are not cut off mid-incident and not surprised by the ceiling.
The catch
Language coverage is the gating question. Honeybadger's error tracking is strongest in Ruby and Elixir and covers the common web stacks, but if your services sit outside its supported set, it is simply not an option, and that rules it out for some teams before anything else. The re-instrumentation cost applies as with the other commercial trackers.
There is no session replay and no distributed tracing in the Sentry sense, so this is a bundle of focused developer-monitoring tools rather than a full observability platform. Self-hosting is not available on standard plans (it is an enterprise conversation), which matters if you chose GlitchTip specifically to keep error data on your own infrastructure. The Insights log quota is metered daily rather than monthly, which is a different mental model to track.
Pricing model
Honeybadger's Developer plan is free with 5,000 errors a month and one user. The Team plan is $26 a month with 50,000 errors and unlimited users, and Business is $80 a month with team-management and SSO features (Honeybadger pricing). The main meters are monthly errors, daily Insights ingest, and the number of uptime monitors, with optional overage billing at a published per-notification rate if you routinely run slightly over. Because users are unlimited and the error meter is transparent with a 125% grace band, the bill is one of the more predictable on this list. Verify current limits before committing.
The verdict
Honeybadger is the easy recommendation for small and midsize teams on Ruby, Elixir, or a common web stack who want GlitchTip's focus plus bundled uptime, cron, and status pages, at a flat and predictable price. It is a non-starter outside its supported languages, and the wrong tool if you need self-hosting or session replay.
6. Dash0
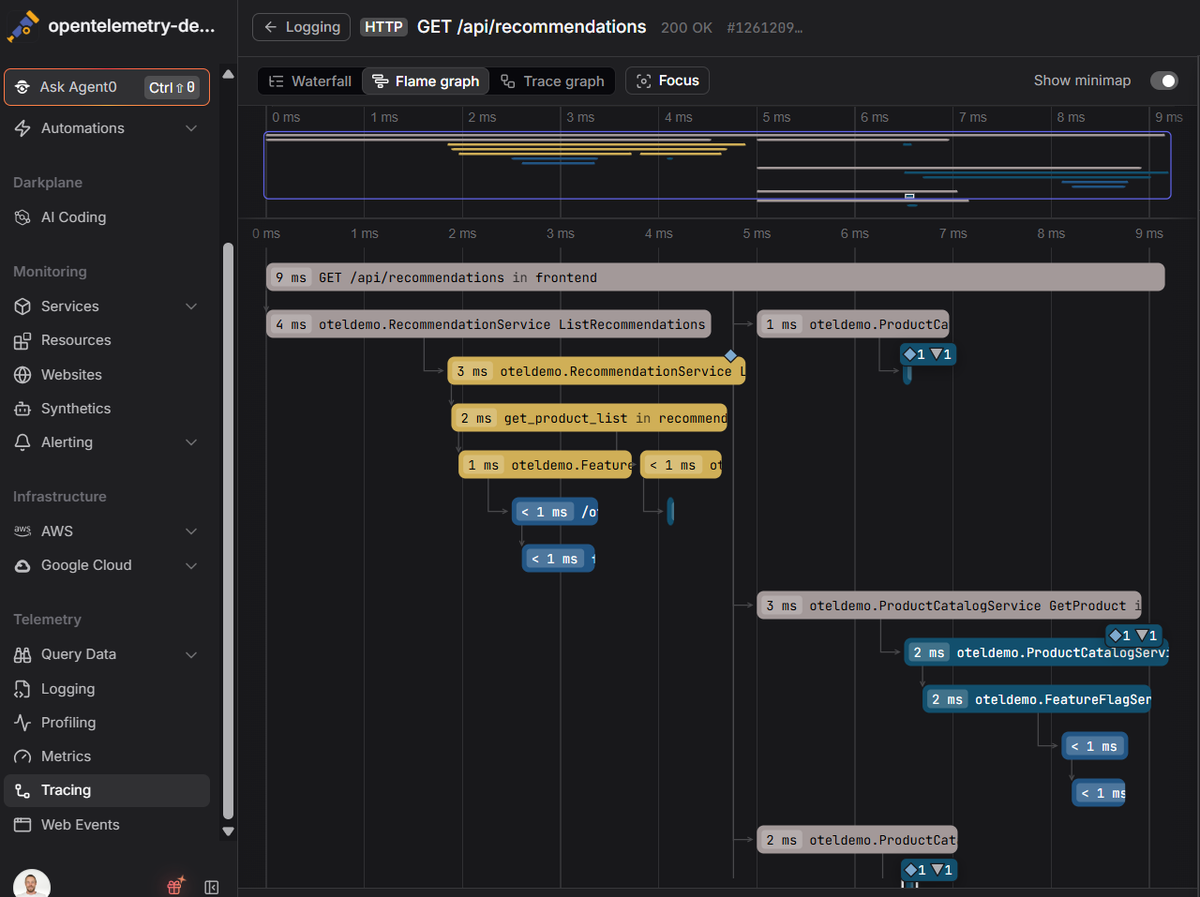
Dash0 is an OpenTelemetry-native observability platform built around OTLP (OpenTelemetry Protocol), with full PromQL support across every signal and Perses-compatible dashboards. It covers metrics, logs, distributed tracing, APM, infrastructure and Kubernetes monitoring, real user monitoring (RUM) via web events, synthetic checks, service maps, and alerting. It represents the other search direction entirely: not a lighter error tracker, but a platform where errors are one signal inside a correlated whole.
For a GlitchTip user, the honest framing matters up front. Dash0 handles errors as they appear in traces and logs, with resource-centric correlation and a Triage feature that identifies which span attributes best explain a set of errors or latency spikes. It does not present a dedicated issues inbox in the GlitchTip or Sentry sense.
What's good
- OpenTelemetry-native, so instrumentation stays portable. Dash0 ingests OTLP directly. If you instrument with OpenTelemetry SDKs, that same instrumentation works with other OTel backends, which reduces the instrumentation-and-transport half of lock-in in a way proprietary SDKs cannot.
- One query language across signals. Full PromQL support for metrics, logs, and traces means engineers who already know Prometheus do not context-switch between three query languages, and existing alert rules can carry over.
- Per-signal pricing that does not penalize rich data. Dash0 charges per million spans, log records, and metric data points, with no per-seat, per-host, or base platform fee (pricing). Adding another useful attribute to a span does not create a new billing dimension, so richly attributed telemetry stays affordable.
The catch
The migration is the largest on this list for a GlitchTip user. Dash0 does not accept Sentry SDK events, so there is no DSN swap. You instrument with OpenTelemetry, and while the Kubernetes operator auto-instruments Java, Node.js, .NET, and Python (Python opt-in), other runtimes mean wiring up OTel SDKs yourself. That is a real project, not a config change.
On error tracking specifically, Dash0 does not offer a dedicated issues inbox, crash-free release health, or session replay. Frontend visibility comes through RUM web events and synthetic checks, not a replay recording of the user's session. If your daily habit is triaging an exception feed with assignment and release-health tracking, that exact workflow is not replicated here, and you should test whether trace-and-log-based error investigation fits how your team actually debugs. It is also SaaS-only with no self-hosted option, and traces and logs retain for 30 days by default while metrics and synthetic data retain for 13 months, so strict on-premises or long-trace-retention needs will hit those limits.
Pricing model
Dash0 uses purely consumption-based pricing: per million metric data points, spans, and log records, plus per-thousand synthetic check runs, with no per-seat, per-host, or platform fee. Because it does not meter hosts, seats, or custom attributes separately, you can estimate the bill by multiplying each signal's volume by its published rate, and it aligns well with high-cardinality OpenTelemetry data. Spans and log records cost more per million than metric data points, so trace-heavy microservice architectures should model span volume specifically. Cost-control features include spam filters that reject low-value telemetry before storage and billing, monthly budget limits, and real-time usage dashboards, so you watch spend accrue rather than discovering it on an invoice.
The verdict
Dash0 fits teams that are done running error tracking as a silo and want to standardize on OpenTelemetry, with predictable per-signal pricing and one query language, and who are comfortable investigating errors through correlated traces and logs. It is the wrong choice if you specifically need an issues inbox, release health, or session replay, or if self-hosting is a hard requirement. You can start a free trial with 14 days of unlimited access to test it against your real telemetry. For the broader field of full observability platforms, the 8 best Sentry alternatives covers Datadog, New Relic, and others in the same depth.
7. Highlight.io / LaunchDarkly Observability
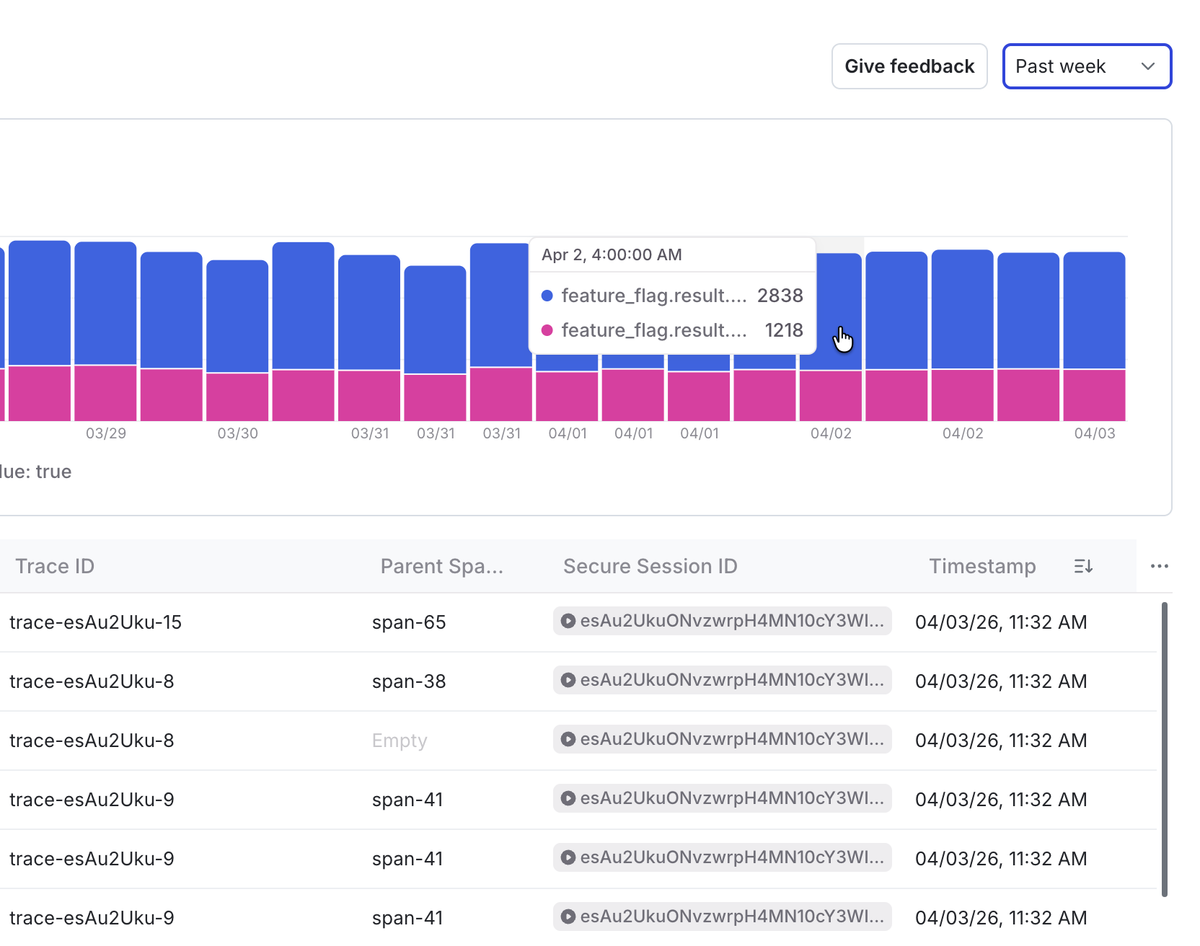
Highlight.io is an open-source, full-stack monitoring platform that pairs error monitoring with session replay, logging, and tracing, built on ClickHouse and OpenTelemetry. It is the entry on this list that most directly answers the "I left GlitchTip because I wanted session replay" motivation, since replay is its flagship feature and it captures errors and logs alongside it.
There is a significant caveat that most comparison articles have not caught up to. Highlight was acquired by LaunchDarkly in 2025, and the standalone hosted service at highlight.io was deprecated on February 28, 2026, with the product folded into LaunchDarkly Observability. The open-source project remains available in its current state for community maintenance, with critical fixes back-ported, but active development has moved to LaunchDarkly's commercial platform.
What's good
- Session replay in an open-source tool. Highlight brings pixel-level session replay together with error monitoring in a self-hostable package, which is rare. For a GlitchTip user who wanted replay without going to a fully commercial vendor, the OSS path is a real option.
- Full-stack signals, not errors alone. Errors, logs, traces, and RUM in one platform give you correlation that a dedicated tracker cannot, so you can move from a frontend error to the backend trace behind it.
- OpenTelemetry and OTLP support. Highlight accepts OTLP data, so your instrumentation is more portable than a proprietary-SDK tool, and the ClickHouse backend handles high-volume queries well.
The catch
The acquisition is the headline risk, and it cuts both ways. If you want the hosted product, it is now LaunchDarkly Observability, which means signing up for LaunchDarkly and accepting its licensing and pricing rather than a standalone observability vendor. If you want the open-source build, it still exists, but you are adopting a project whose commercial energy has moved elsewhere and whose self-hosted community was still small before the move. Betting your error tracking on it means betting on either LaunchDarkly's roadmap or community maintenance.
The self-hosted path also carries real operational weight. Highlight's stack uses ClickHouse and wants 4 to 8 GB of RAM, heavier than GlitchTip's four containers, so you are trading up in infrastructure to gain replay and full-stack signals. And session replay itself is the data-collection liability described earlier: it records DOM and network activity, so masking must be configured carefully or you will capture personal data and secrets.
Pricing model
Self-hosted Highlight is free at the license level (Apache-2.0) and paid for in the ClickHouse infrastructure and operational effort you take on, which is the same trade every self-hosted platform on this list makes. The hosted product now follows LaunchDarkly Observability's usage-based model, with a free tier and overage billing once you exceed it, billed alongside LaunchDarkly's feature-management platform (LaunchDarkly pricing). Because the hosted pricing is now tied to LaunchDarkly's packaging, model it against that product rather than Highlight's old rates. Confirm current terms directly, since this is the entry most in flux.
The verdict
The open-source Highlight build is worth a look for teams that want session replay plus errors on their own infrastructure and have the capacity to run ClickHouse and track a maintenance-mode project. For the hosted experience, evaluate LaunchDarkly Observability as what it now is: an observability product inside a feature-management platform, which makes the most sense if guarded releases and feature flags are already part of your workflow.
8. SigNoz
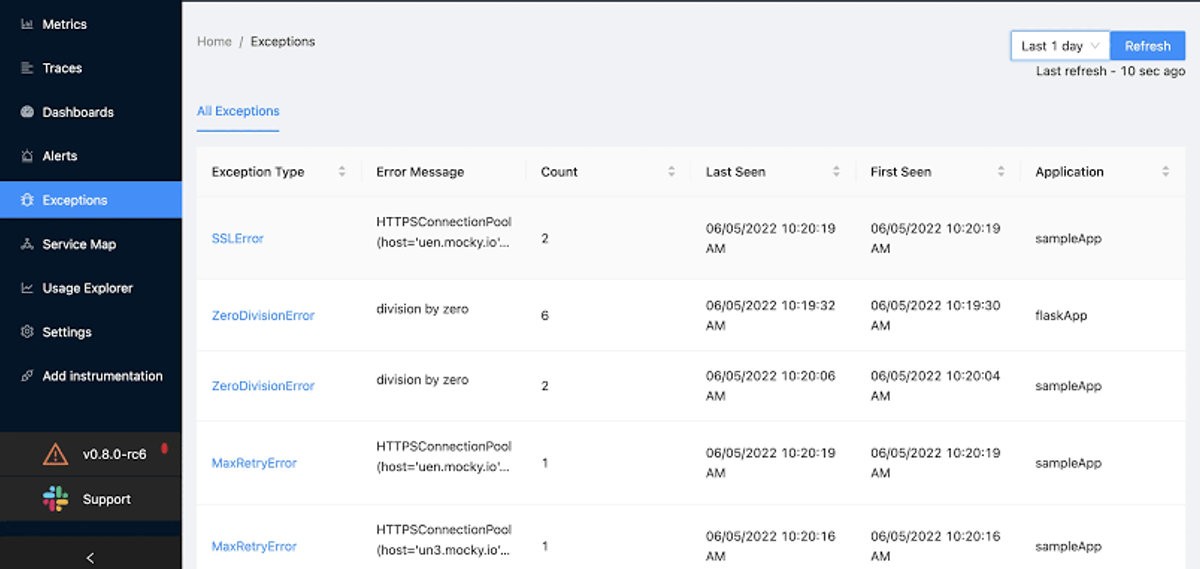
SigNoz is an open-source, OpenTelemetry-native observability platform built on ClickHouse, combining logs, metrics, traces, and an exceptions view in a single interface. Like Dash0, it represents the "absorb error tracking into a broader platform" direction, but with a self-hostable open-source core as its center of gravity. Its Exceptions feature surfaces errors from trace data, which lands between a dedicated inbox and a raw trace filter: more structured than the latter, less workflow-rich than the former.
Migrating from GlitchTip means re-instrumenting with OpenTelemetry rather than changing a DSN, since SigNoz does not accept Sentry SDK events. The payoff is that the same OTel instrumentation feeds metrics, logs, and traces, not just errors.
What's good
- Genuinely open source and self-hostable. The Community edition is free to run on your own infrastructure and is a full product, not a crippled tier. For teams with data-residency requirements or a hard cost ceiling, this is a real GlitchTip-style ownership option that also gives you metrics, logs, and traces.
- OpenTelemetry-native from the ground up. SigNoz ingests OTLP directly and supports any language OpenTelemetry supports, so there is no proprietary agent and your instrumentation stays portable to other OTel backends.
- ClickHouse-backed performance. The columnar store handles high-cardinality trace queries and full-text log search well, with a track record at high daily ingestion volumes.
The catch
Self-hosting means operating ClickHouse, and that is the honest cost. The initial Helm or Docker Compose deployment is quick, but the learning curve arrives later, when queries slow, retention needs tuning, or schema migrations come up. Running it well at scale is an ongoing job, and the free edition is free in license, not in engineering time. It is meaningfully heavier to run than GlitchTip.
SigNoz also stops at observability data. There is no session replay, no crash-free release health, and no status-page or incident-management tooling, so it covers the telemetry side of what you might want but not the full developer-workflow side. Its exceptions view is a step up from a raw trace filter but a step down from a dedicated issues inbox with assignment and lifecycle. If error triage as a managed workflow is what you valued in GlitchTip, weigh that gap carefully.
Pricing model
SigNoz Cloud charges per GB for logs and traces and per million samples for metrics, above a monthly minimum, with no per-host or per-seat dimension, per its published pricing. Self-hosted is free in license and paid for in infrastructure and your team's time. The usage-based cloud model is friendly to rich telemetry and easy to reason about per signal, though per-GB pricing rewards trimming verbose logs, and spiky workloads can be harder to forecast. The self-hosted path shifts cost entirely to your own compute. Predictability is good on cloud once volumes stabilize, and fully in your hands, for better and worse, when self-hosted.
The verdict
SigNoz is the strongest choice for a GlitchTip user who wants to graduate to full observability while keeping the open-source, self-hostable posture that made GlitchTip appealing, and who has the engineering capacity to run ClickHouse (or wants the usage-priced cloud instead). It is not the tool if you need session replay, release-health workflows, or a dedicated issues inbox, or if operating storage infrastructure is off the table.
Which tool fits your situation
The right pick depends less on which tool is "best" and more on which of GlitchTip's traits you are trying to keep, and which limitation drove you to look.
If you want to go lighter and keep Sentry SDK compatibility, Bugsink is the most direct move: a single container, a one-line DSN change, and no per-event billing when self-hosted. It is the closest thing to GlitchTip's own philosophy, taken further.
If you want more depth and are willing to pay for it, Sentry is the obvious upgrade, since GlitchTip was built to imitate it, and coming back gives you release health, source maps, and session replay in full. Budget for the multi-meter bill, and do not self-host it to save money.
If duplicate-error noise was your problem, Rollbar's grouping and its explicit overage controls are the answer, provided you accept a re-instrumentation and a steeper jump past the free tier.
If you ship mobile or manage releases against a stability target, SmartBear Insight Hub's stability score and mobile crash reporting are the differentiators, again at the cost of adopting its SDKs.
If you want GlitchTip's focus plus bundled uptime, cron, and status pages from one predictable vendor, and you are on Ruby, Elixir, or a common web stack, Honeybadger is the tidy consolidation play.
If session replay is specifically what you left for, the open-source Highlight build gives you replay on your own infrastructure, with the caveat that its hosted future is now LaunchDarkly Observability. Sentry and Rollbar are the commercial routes to replay if you would rather not self-host.
If you have concluded that a separate error tracker is the wrong architecture and you want errors as one correlated signal, the OpenTelemetry-native platforms fit. SigNoz keeps the open-source, self-hostable posture GlitchTip users tend to like, if you can run ClickHouse. Dash0 is the managed, per-signal-priced option for teams standardizing on OTLP and PromQL who are comfortable investigating errors through traces and logs rather than an inbox.
A few tools sit just outside this list but are worth a look for narrow cases. PostHog bundles error tracking into product analytics with a generous free error tier. Firebase Crashlytics is free and excellent if you are mobile-only. OneUptime combines error tracking with on-call and status pages in one open-source platform. None is a general-purpose GlitchTip replacement, but each wins a specific situation.
Final thoughts
There is no single GlitchTip replacement, because "leaving GlitchTip" describes at least three different journeys. One group wants the same focused error tracker, only lighter, cheaper, or self-hostable on even less infrastructure, and lands on Bugsink or, going the other way for depth, back on Sentry. A second group wants a more capable commercial tracker with better grouping, mobile support, or bundled monitoring, and lands on Rollbar, SmartBear Insight Hub, or Honeybadger. A third group has decided that a standalone error tool is the wrong shape, and wants errors folded into metrics, logs, and traces, which leads to SigNoz, Highlight, or Dash0. What decides your path is how your team debugs and what you were missing, not which product scores highest on a feature grid.
The other seam is pricing, which is usually part of why you started looking. GlitchTip's event model is simple but counts uptime and performance against the same quota, and every alternative charges on a different axis: per event, per GB, per request, per active series, or per signal. Map your architecture to the model rather than to the headline rate, and pay special attention to what happens during an error storm, because that is when the difference between a stop-at-limit control and an uncapped per-event meter becomes a very large number.
If your reason for leaving is a mix of wanting more than error tracking and not wanting to be locked into another proprietary SDK, an OpenTelemetry-native platform addresses both at once: instrumentation stays portable through OTLP, one PromQL surface spans your signals, and the bill is the sum of a few published rates rather than a stack of interacting meters. That is the specific gap Dash0 is built for, with the honest trade that you give up GlitchTip's dedicated issue workflow in exchange for correlated traces and logs.
Whatever you choose, test it against your real telemetry before you migrate, because grouping quality, sampling defaults, and billed data volume all behave differently under your traffic than in a demo. Sign up for a free Dash0 account with 14 days of unlimited access if you want to run that test on OpenTelemetry data.
Frequently asked questions
Is there a free open-source alternative to GlitchTip? Yes, several. Bugsink is a source-available single-container error tracker that is Sentry-SDK-compatible and free to self-host. SigNoz offers a free, self-hostable Community edition that adds metrics, logs, and traces on top of an exceptions view, built on OpenTelemetry and ClickHouse. The open-source Highlight build adds session replay. All three trade license cost for the operational work of running them, and SigNoz and Highlight are meaningfully heavier to operate than GlitchTip.
Which GlitchTip alternative keeps Sentry SDK compatibility? Bugsink is the closest, since it accepts events from Sentry's open-source SDKs and you migrate with a one-line DSN change, exactly as you adopted GlitchTip. Sentry itself is of course fully compatible, because GlitchTip implements a subset of Sentry's ingest API. Rollbar, SmartBear Insight Hub, and Honeybadger use their own SDKs, so moving to them means re-instrumenting your services.
Do any GlitchTip alternatives offer session replay? GlitchTip does not have session replay, and it is a common reason to switch. Sentry and Rollbar include it on the commercial side. The open-source Highlight build offers it self-hosted. Bugsink, Honeybadger, SigNoz, and Dash0 do not offer native session replay, though several provide real user monitoring for frontend errors. If replay is central to your debugging, it narrows the field quickly.
What happened to Highlight.io? Highlight was acquired by LaunchDarkly in 2025, and the standalone hosted service at highlight.io was deprecated on February 28, 2026, with the product folded into LaunchDarkly Observability. The open-source project remains available for community maintenance with critical fixes back-ported, but active development moved to LaunchDarkly's commercial platform. If you want the hosted product, you are now evaluating LaunchDarkly Observability rather than a standalone vendor.
How do I compare pricing across such different models? Do not compare headline rates. GlitchTip charges per event across issues, uptime, performance, and releases combined. Alternatives charge per occurrence, per GB, per request, per active series, or per signal. Map your own architecture to what each model charges on, then estimate your bill under each, and specifically model what happens during an error storm, since event-based models turn a runaway exception into cost while stop-at-limit and flat-tier models bound it.

