Dash0 acquires Polar Signals

Dash0 updates from August 2025

3 updates shipped to Dash0 in August 2025: Synthetic Monitoring, Introducing the new organization settings and End-to-End AWS Tracing with CloudWatch Transaction Search (Public Beta).

Synthetic Monitoring

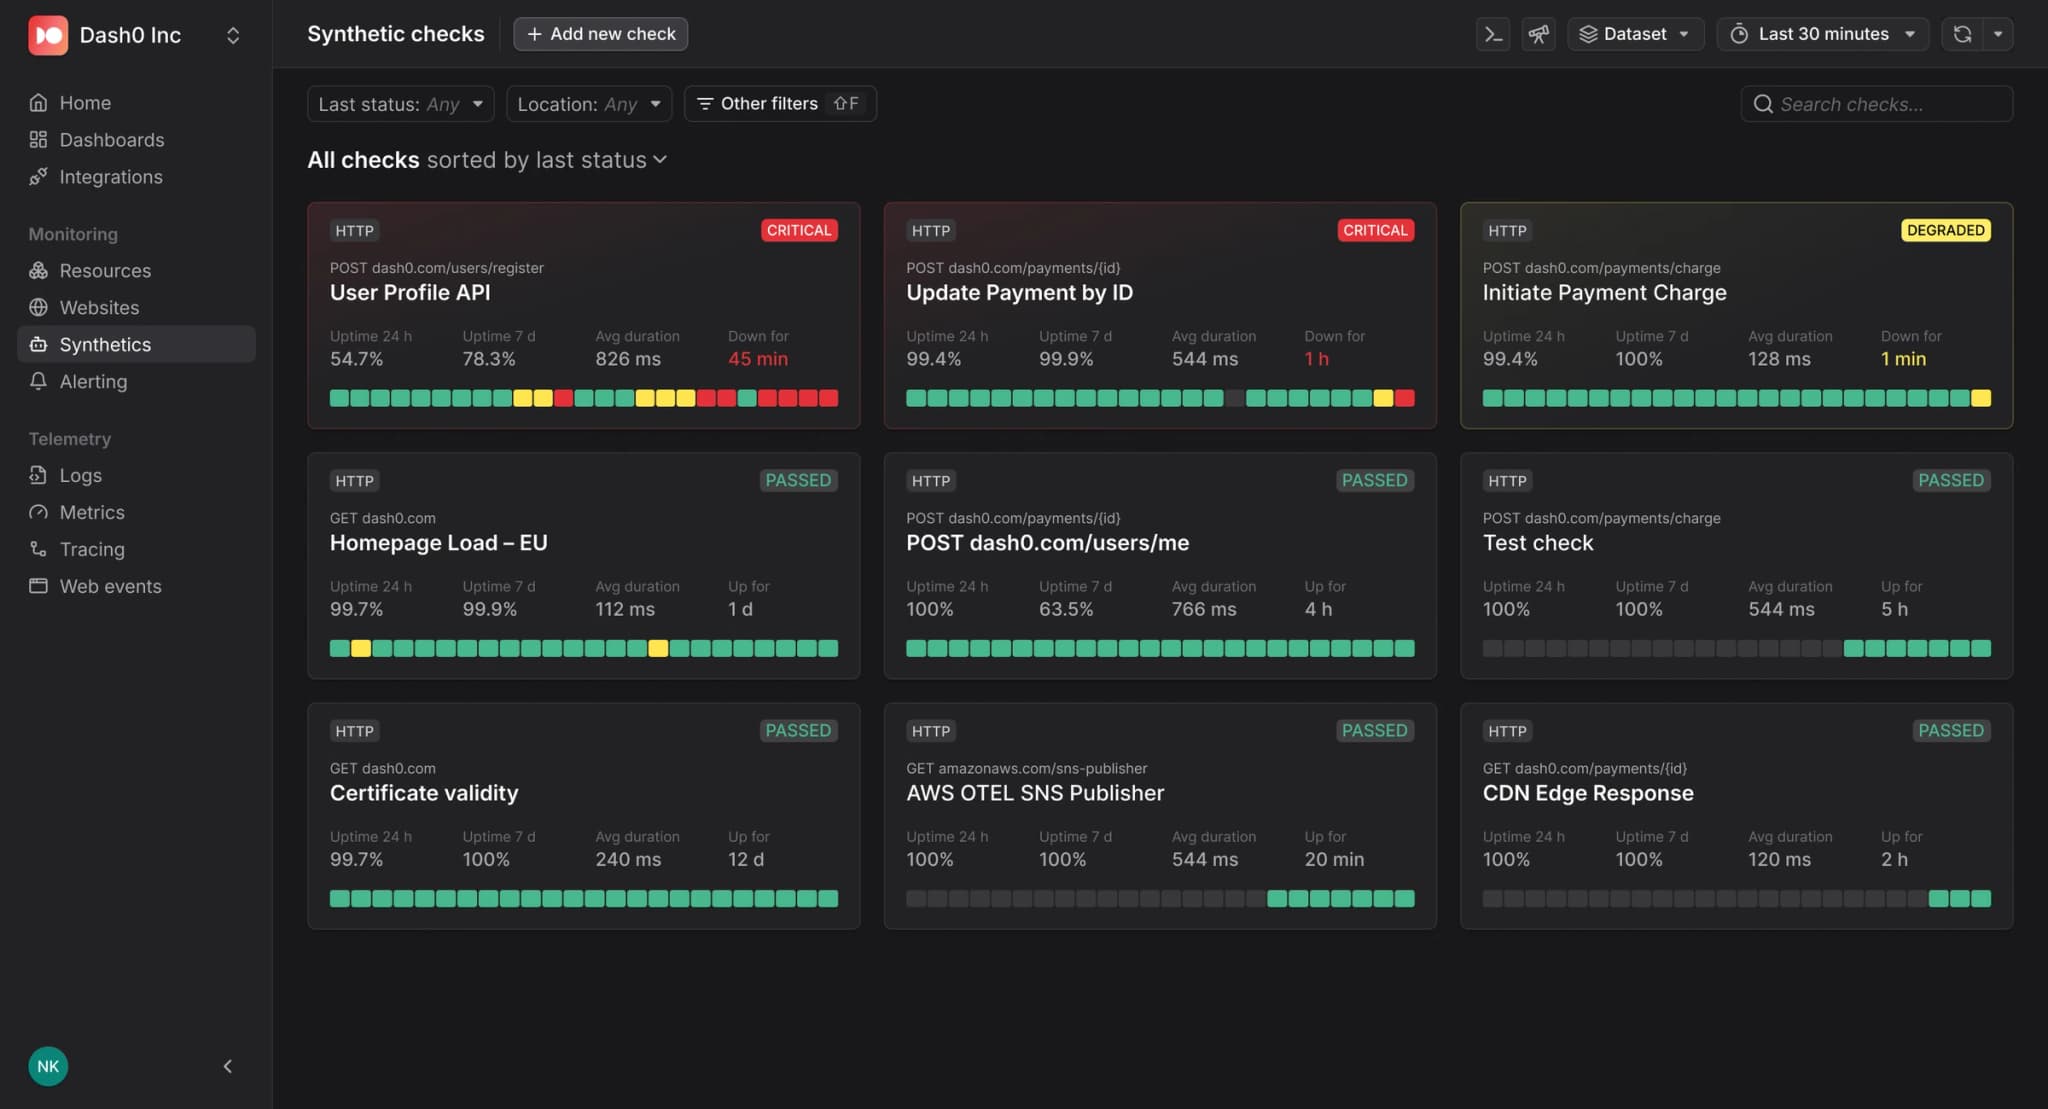
Synthetic monitoring generates continuous simulated traffic from multiple locations, letting you catch problems before anyone opens a support ticket.

What's New

One-Click Setup: Create synthetic checks by adding your URL. Fully operational in under 60 seconds—no scripts or configuration files required.

Multi-Location Testing: Run checks from multiple global locations with one-click expansion. Monitor how your services perform for users from Frankfurt, Oregon, Melbourne, and soon more.

Deep Tracing Integration: Every span in every trace shows if it was triggered by a synthetic check and which one. Filter synthetic traffic during outages to focus on real user impact, or verify which operations are covered by synthetic monitoring. And, of course, it works with Triage as well.

Built-in Essentials: Uptime monitoring and SSL certificate expiration alerts included out of the box.

Infrastructure as Code: Already supported in the Dash0 Terraform Provider, and soon in the Dash0 Operator for Kubernetes as well!
Read more

Introducing the new organization settings

We've completely redesigned Organization Settings to make managing your workspace simpler, faster, and more intuitive.

We've completely redesigned Organization Settings to make managing your organization simpler, faster, and more intuitive. The new experience is streamlined, easier to navigate, and organized to help you find what you need without unnecessary clutter.

What's New

  • Deep-Linkable Pages: Every settings section now has its own unique URL. Easily share direct links with teammates or bookmark frequently visited pages. This also makes support far more efficient, allowing you to send or receive an exact link to the relevant page.

  • Revamped Members Section:

    • Search & Sort: Quickly find members and sort the list by role, name, or status.

    • Simplified Layout: We've decluttered the interface and improved the visual hierarchy for faster scanning.

  • Improved General Section:

    • Streamlined Design: Enjoy faster navigation and easier comprehension.

    • Industrial-Standard Danger Zone: A clear, well-marked area for critical actions like deletions, ensuring both safety and clarity when performing irreversible actions.

Screenshot of the new members settings page in Dash0
Revamped organization members settings page

Why This Matters

Managing your organization's settings should be effortless. These changes bring tangible benefits:

  • Faster Collaboration: Deep links let you guide teammates straight to the right settings without manual navigation.

  • Increased Clarity: Better organization and reduced clutter mean less mental effort to make changes.

  • Enhanced Safety: The new Danger Zone follows industry best practices to help prevent mistakes.

Read more

End-to-End AWS Tracing with CloudWatch Transaction Search (Public Beta)

Get complete visibility into your AWS workloads with automatic span collection from fully managed services like API Gateway, Lambda, SNS, SQS and many more. No code changes required—just enable the integration and see the full journey your requests take through AWS infrastructure.

Traditional OpenTelemetry instrumentation captures only what happens inside your code, while AWS X-Ray also records what happens after the call reaches AWS services.

Our CloudWatch Transaction Search integration bridges that gap by stitching the spans together so you get one seamless, end-to-end trace of every request, from the very first hop to the final response. It works by streaming every X-Ray span into an aws/spans log group as JSON, which we then make OpenTelemetry compliant in our ingestion pipeline.

That is, you keep the full X-Ray data while paying CloudWatch-Logs prices and nothing extra for X-Ray storage.

incomplete OpenTelemetry trace starting at Lambda handler.complete trace including API Gateway processing, Lambda service overhead, and managed service spans

What's New

Automatic AWS Service Span Collection: Seamlessly captures tracing data from API Gateway, Lambda service, SNS/SQS messaging, as well all other AWS services emitting X-Ray data, and correlates it with your existing OpenTelemetry or X-Ray traces.

True End-to-End Latency: See the complete user experience from first AWS service interaction to final response, not just application execution time.

Zero-Code Integration: Works with your existing setup—no application changes required.

Join the Public Beta

CloudWatch Transaction Search integration is now available in public beta. Experience complete AWS observability while we continue refining the feature based on your feedback.

Get started with Amazon CloudWatch Transaction Search →

Read more