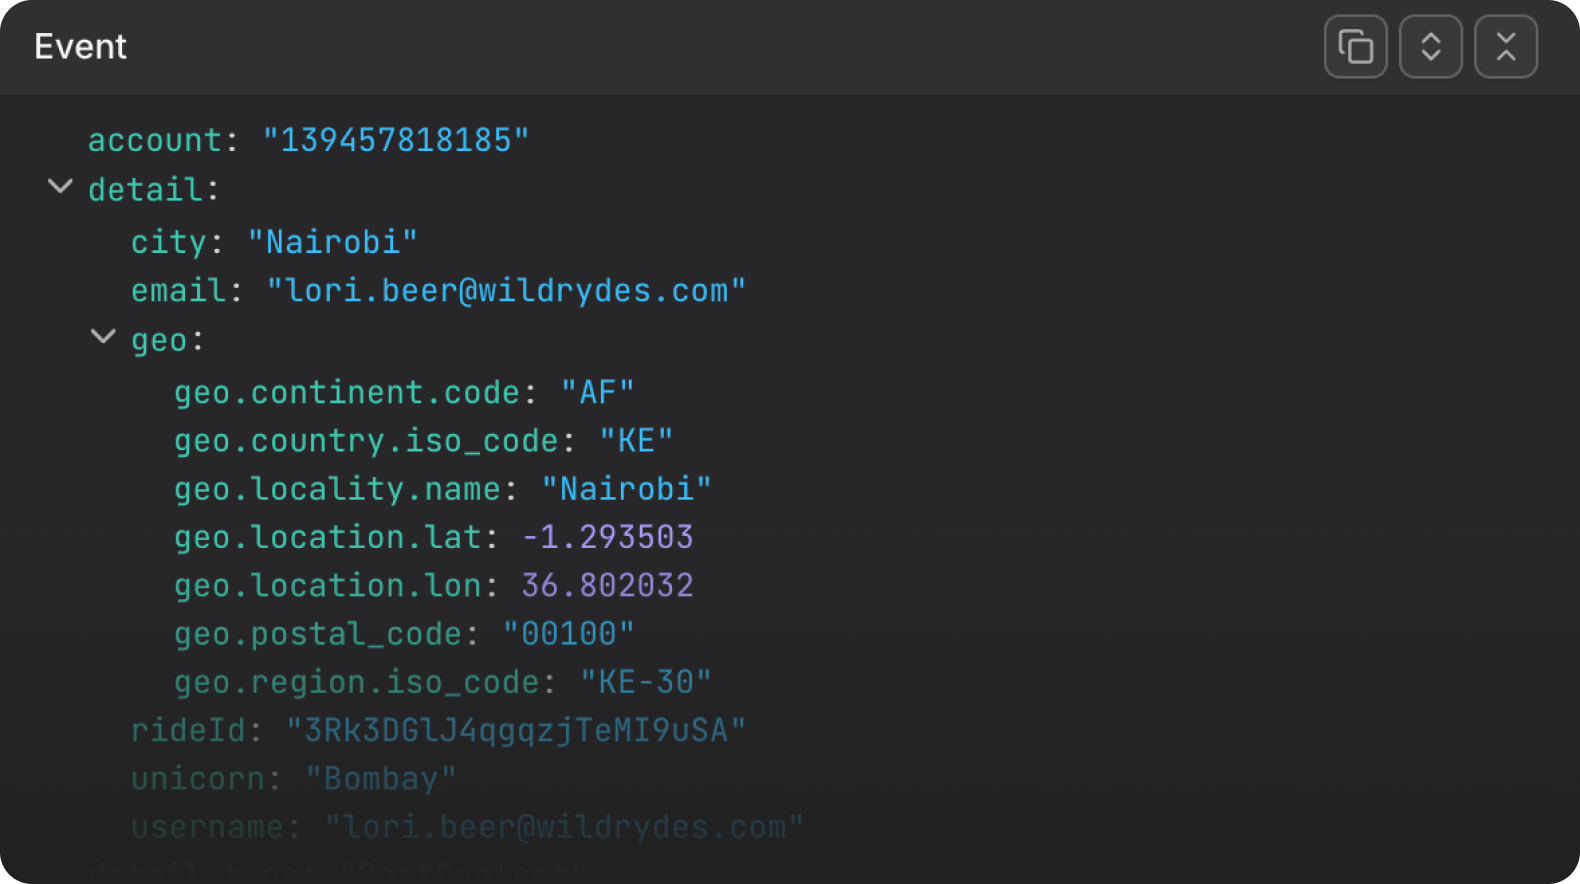
Event Payloads in the Trace
The input that caused the failure
The extension captures the full event that triggered the invocation, an SQS message, an EventBridge event, a Kinesis record, and attaches it to the trace.
Dash0 acquires Polar Signals

A Lambda function is gone by the time you start investigating. Dash0 captures what triggered the invocation, what it was processing, and what killed it, before the function disappears.
Start for free or Book a demo


Infrastructure engineer - Chargetrip
In an age of overly complex tools, we find that Dash0 stands out for its simplicity and speed. With simple pricing, easy integration, amazing filtering capabilities, fast handling of large data volumes, and straightforward alerting with clear error messages, Dash0 makes observability a breeze.

CTO - Hayuno AG
Despite being a young company, Dash0 delivers enterprise-grade quality and features—automatic instrumentation, spans, logs with semantic context, PromQL support, AI-powered trace triage—all working reliably from day one.

Senior Full-Stack Engineer - catchHR
Dash0 has significantly streamlined our approach to observability and OpenTelemetry, bringing everything together in one place. The intuitive interface and seamless integration have enabled us to quickly gain valuable insights into our systems and resolve issues efficiently.

Senior Web Developer - CroCoder
What I love most about Dash0 is that it's fully OpenTelemetry native which has significantly improved our software development process. The seamless navigation from logs to traces to metrics streamlines bug diagnosis and troubleshooting, enhancing our team's efficiency.

Software Engineer - Vercel
The tracing UI is amazing. When we switched to Dash0, it significantly cut down the amount of time from a bug being reported to figuring out why it happened and fixing it. Filtering on attributes is extremely intuitive, and the tracing tree UI is awesome.

DevOps Cloud Architect - AV Software Solutions 360° at Bechtle
With Dash0, we have found an OpenTelemetry-native solution that provides the flexibility we need. With the support of the open standard OpenTelemetry, we are able to handle public resources responsibly.

Solution Architect - Porsche Digital
Dash0's foundation on open source standards ensures future-proof and next-gen observability. Their focus on ease of use empowers all of our developers to gain insights quickly.
The Dash0 Lambda Extension runs as a sidecar alongside your function. Add the layer, set three environment variables, no other code changes. Sensitive fields are masked by default, with custom masking rules available per payload type.
The extension captures the full event that triggered the invocation, an SQS message, an EventBridge event, a Kinesis record, and attaches it to the trace.
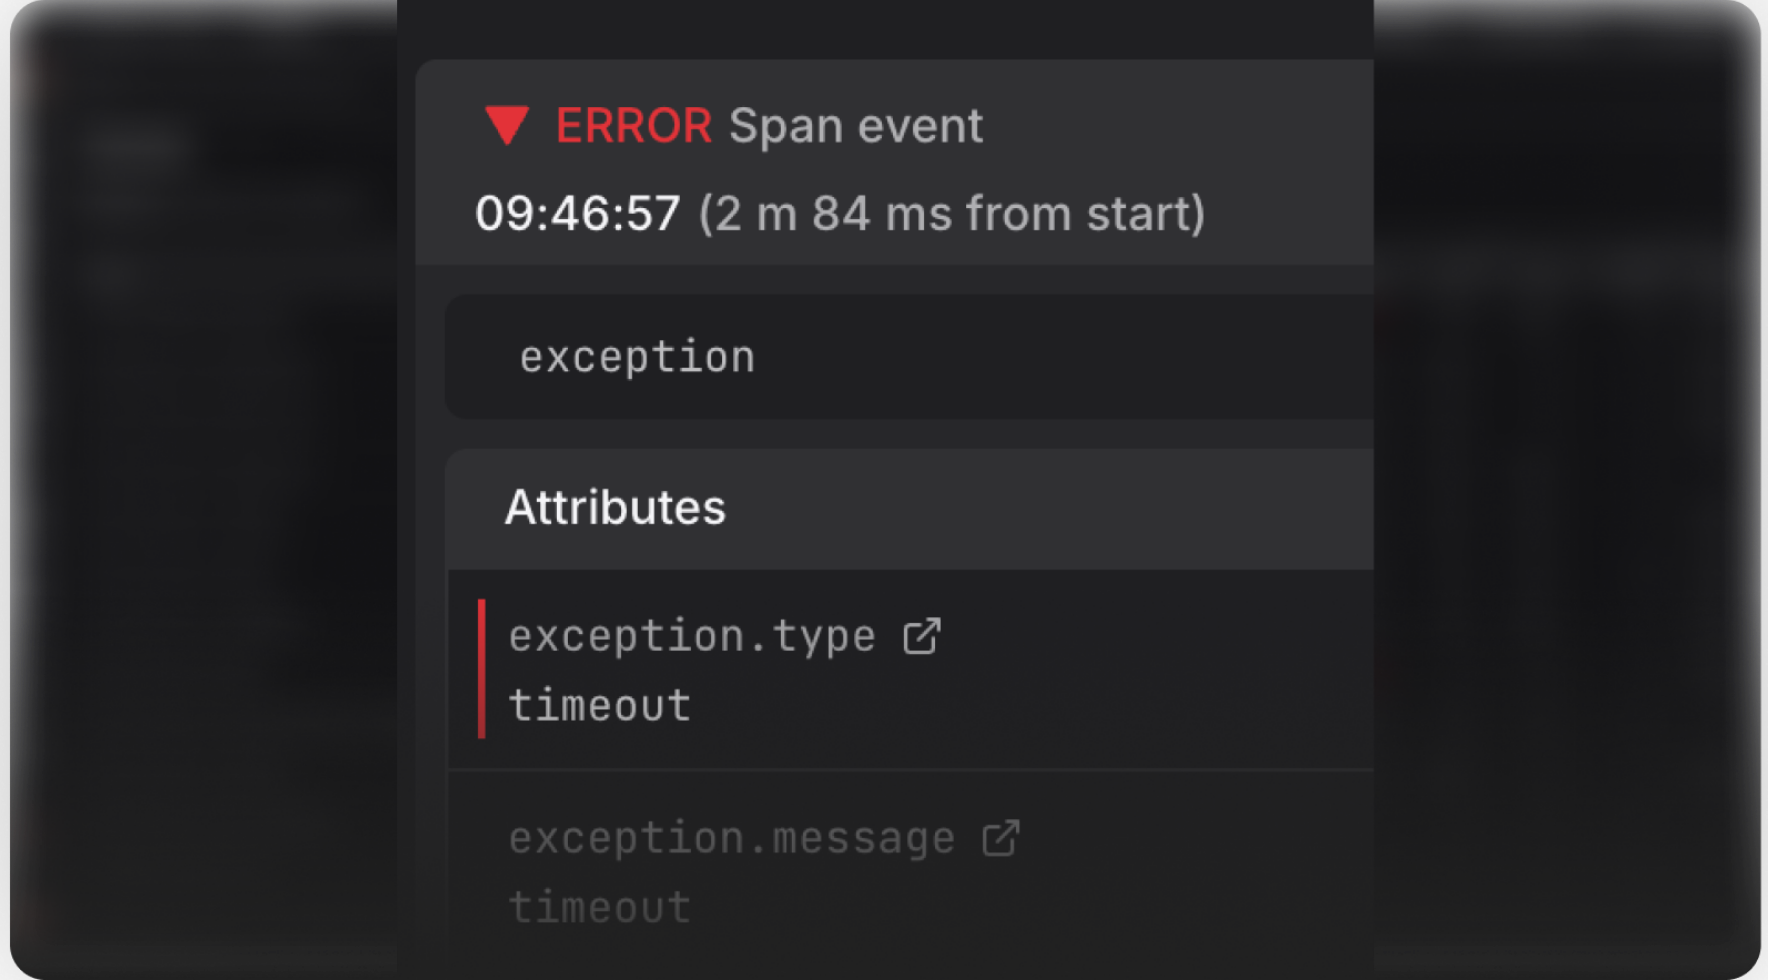
When a function times out or runs out of memory, the runtime kills it before any trace can be emitted. The extension detect the failure and generate a synthetic trace: duration, trigger source, batch size, failure type.
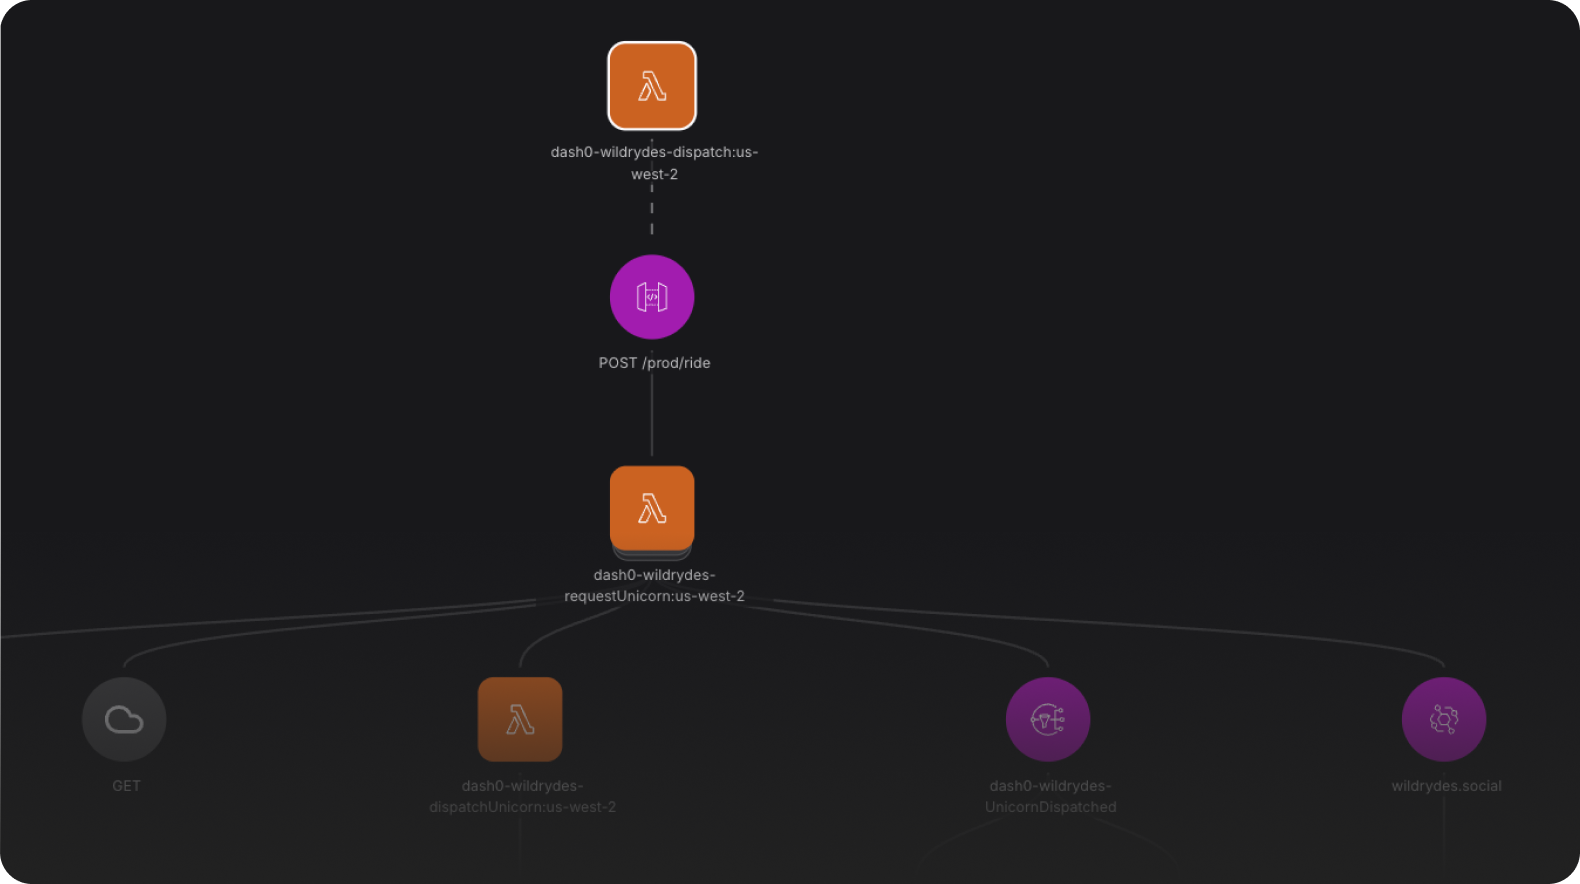
Trace context propagates across SQS, SNS, EventBridge, and Kinesis. Each hop carries its event source and batch record count, so a fan-out across multiple brokers stays traceable end to end.
Every invocation produces a complete trace, enriched with the details your application code never sees.
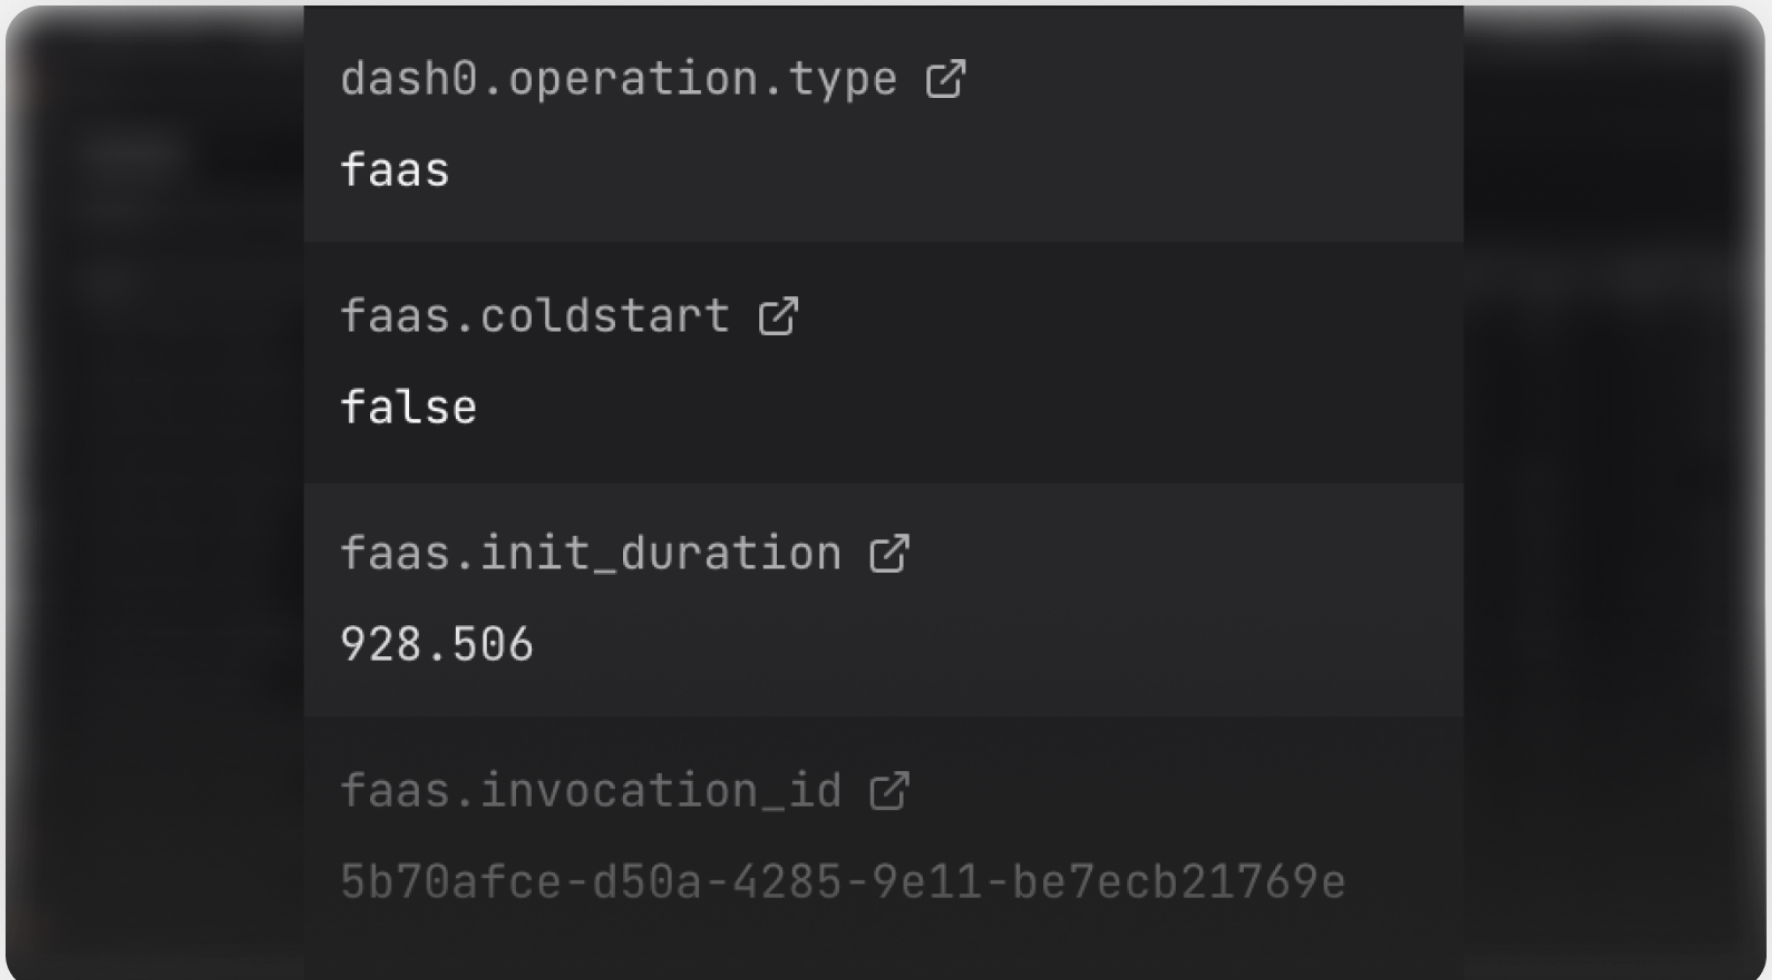
The root span carries invocation ID, event source, and batch record count using standard OTel semantic conventions.
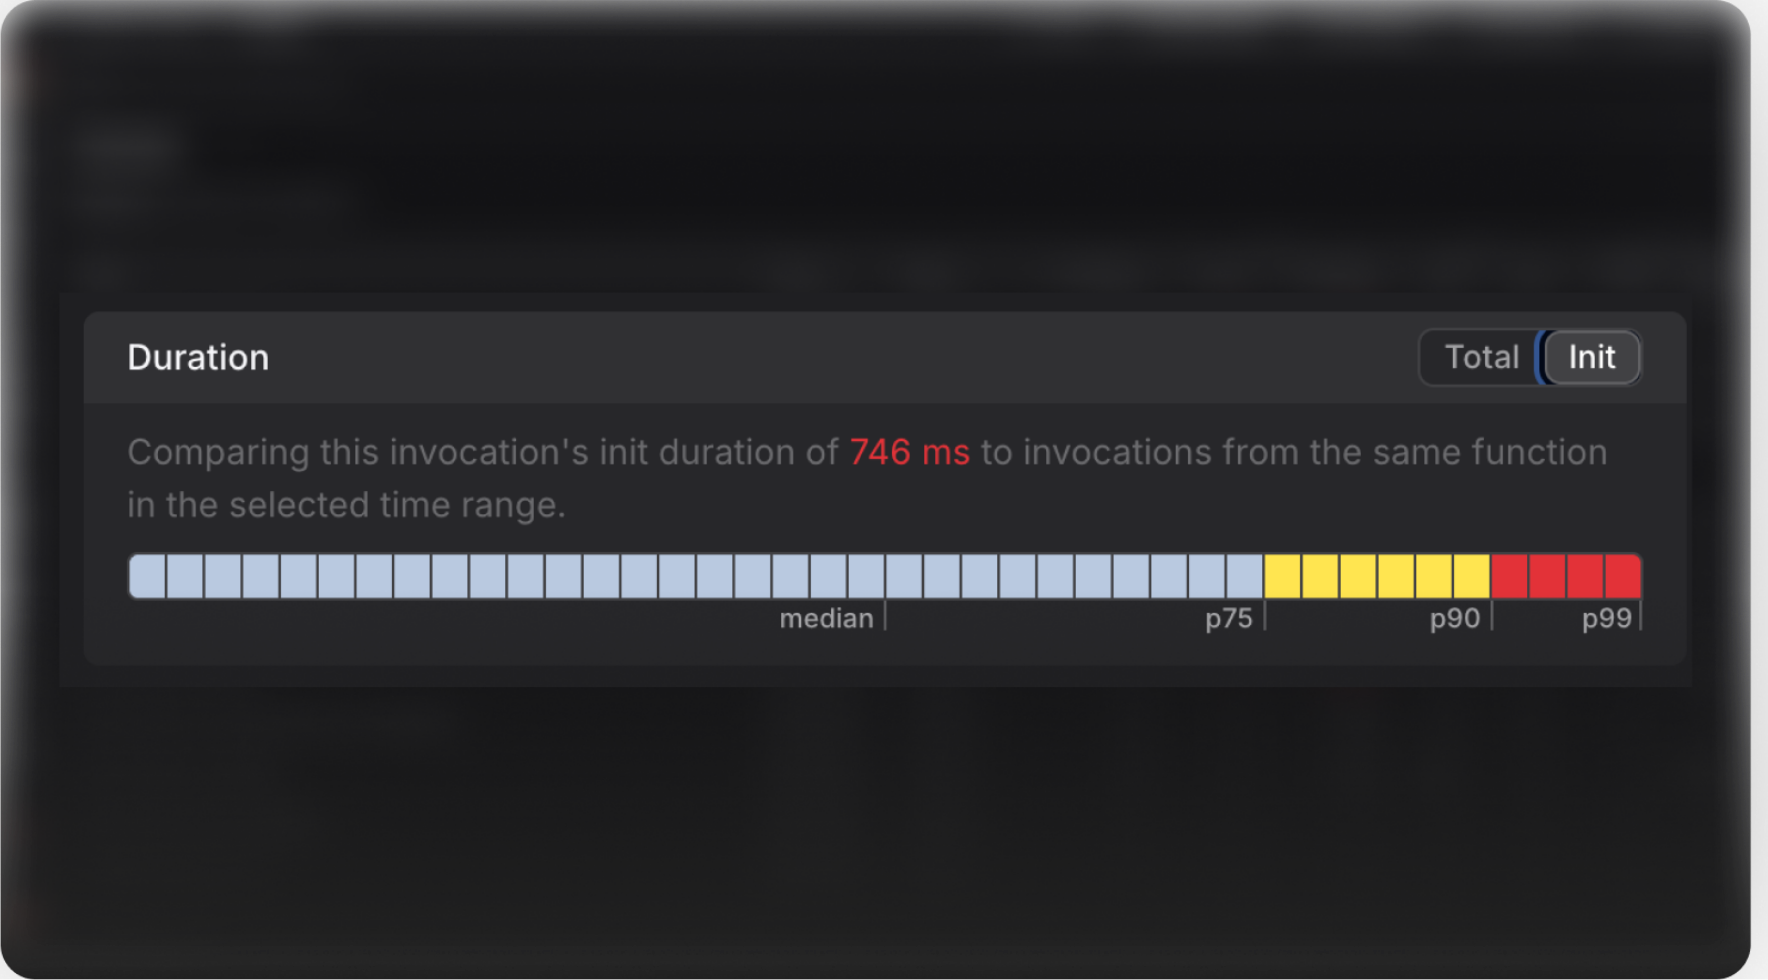
Cold starts get their own metric on the invocation span. Track trends, compare across runtimes and memory configurations, correlate spikes with latency.
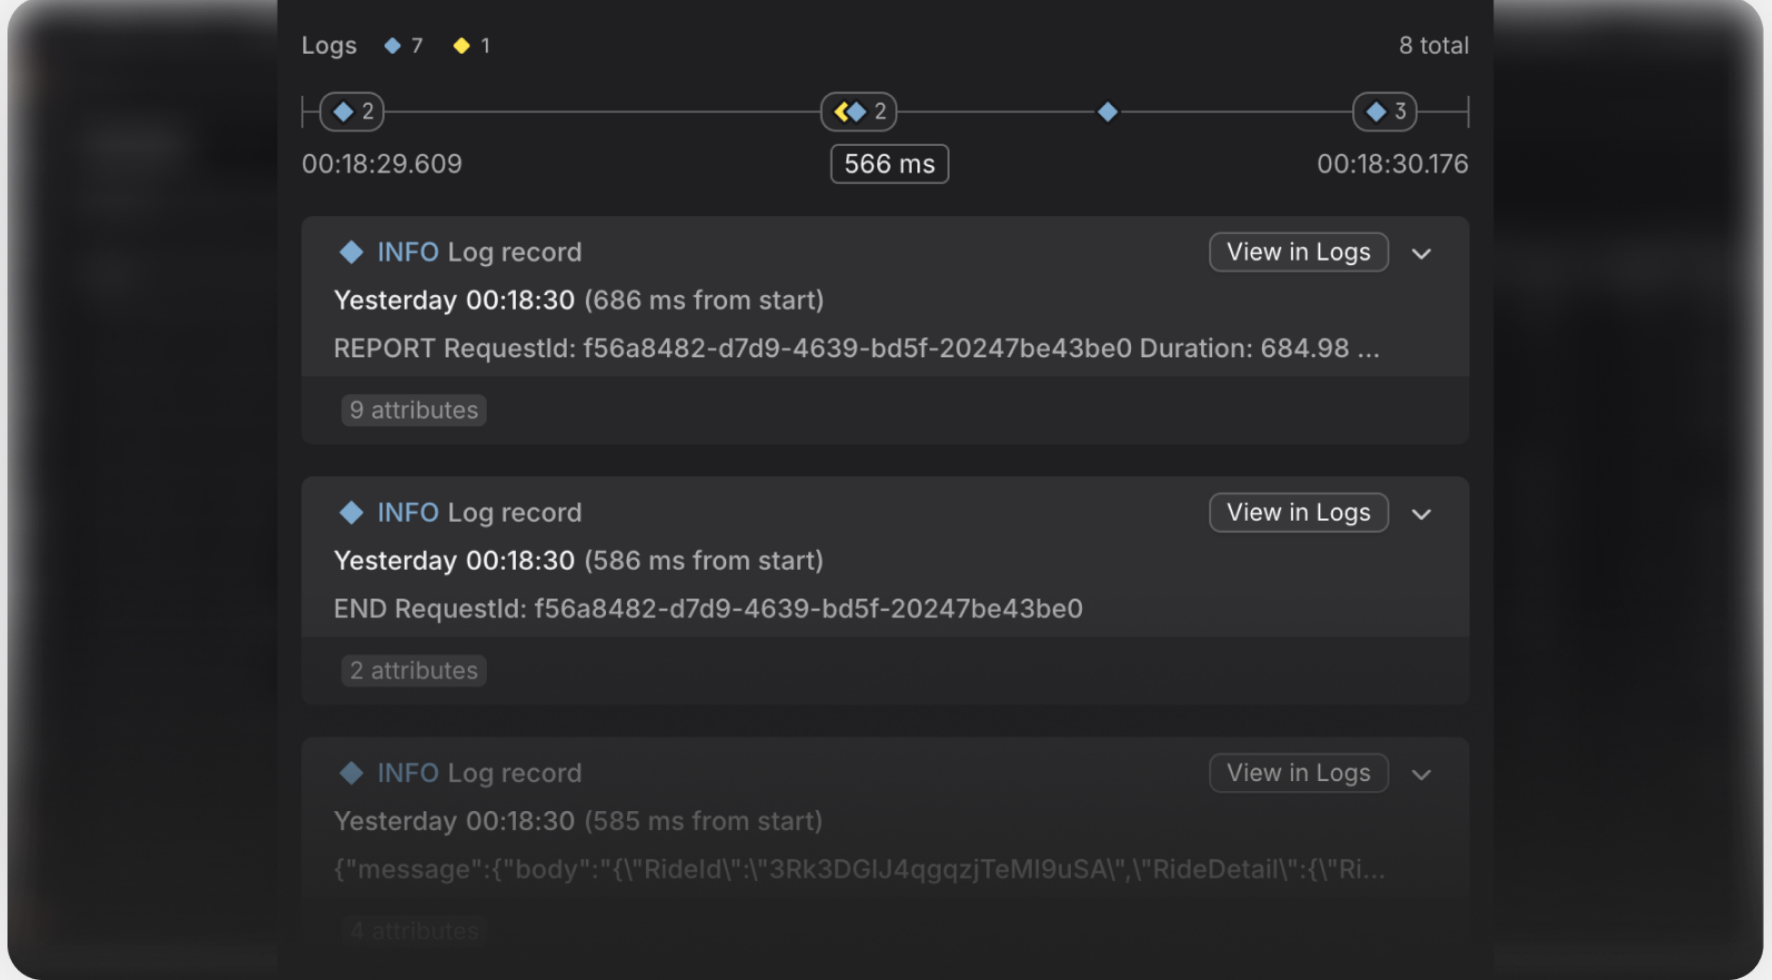
Logs are linked to their invocation trace via a shared invocation ID. Jump from a log line straight to the full trace.
Add the extension from the Lambda functions catalog, or bring your own OpenTelemetry setup.
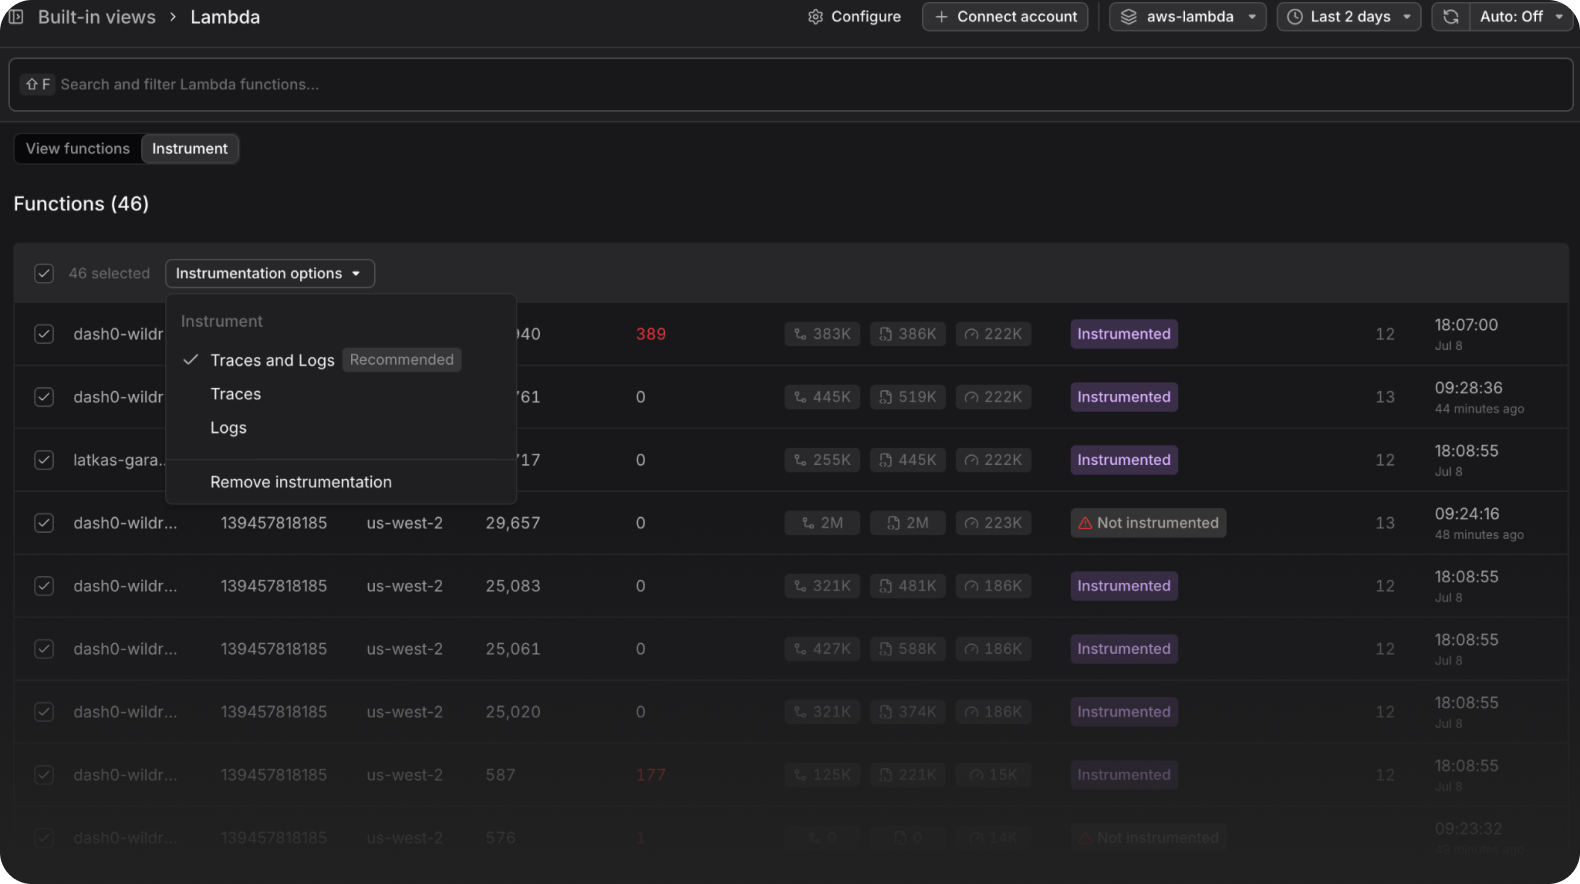
Select functions in the AWS Lambda catalog and Dash0 adds the extension for you.
Point your existing OTLP exporters at the extension’s local endpoint and keep your instrumentation as-is. You get Lambda context, payload capture, and synthetic traces on top, without changing your code.
The serverless-dash0 plugin configures the extension automatically for any function marked in your serverless.yml.
Connect your AWS account first to see every function before deciding what to instrument. See AWS Integration.
Start for free or Book a demo