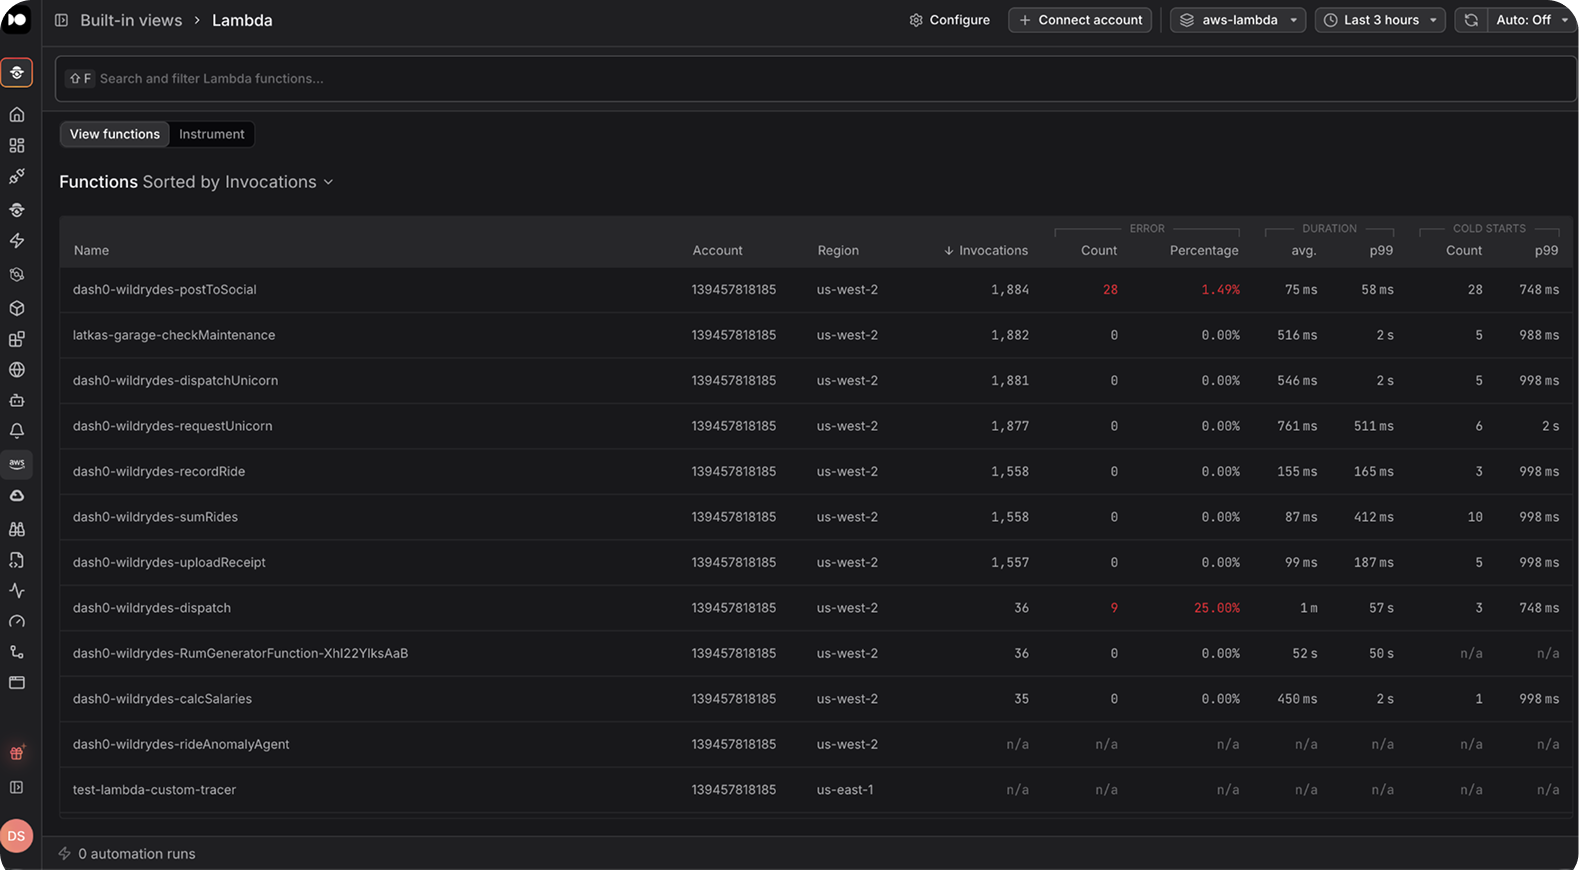
Lambda Resource Catalog
Every function across any regions
Every Lambda function across your connected accounts and regions appears in one catalog: invocation counts, error rates, duration, and cold start metrics.
Dash0 acquires Polar Signals

Connect your AWS account and every Lambda function across every region is visible immediately with invocations, errors, duration, and cold starts.
Start for free or Book a demo


Infrastructure engineer - Chargetrip
In an age of overly complex tools, we find that Dash0 stands out for its simplicity and speed. With simple pricing, easy integration, amazing filtering capabilities, fast handling of large data volumes, and straightforward alerting with clear error messages, Dash0 makes observability a breeze.

CTO - Hayuno AG
Despite being a young company, Dash0 delivers enterprise-grade quality and features—automatic instrumentation, spans, logs with semantic context, PromQL support, AI-powered trace triage—all working reliably from day one.

Senior Full-Stack Engineer - catchHR
Dash0 has significantly streamlined our approach to observability and OpenTelemetry, bringing everything together in one place. The intuitive interface and seamless integration have enabled us to quickly gain valuable insights into our systems and resolve issues efficiently.

Senior Web Developer - CroCoder
What I love most about Dash0 is that it's fully OpenTelemetry native which has significantly improved our software development process. The seamless navigation from logs to traces to metrics streamlines bug diagnosis and troubleshooting, enhancing our team's efficiency.

Software Engineer - Vercel
The tracing UI is amazing. When we switched to Dash0, it significantly cut down the amount of time from a bug being reported to figuring out why it happened and fixing it. Filtering on attributes is extremely intuitive, and the tracing tree UI is awesome.

DevOps Cloud Architect - AV Software Solutions 360° at Bechtle
With Dash0, we have found an OpenTelemetry-native solution that provides the flexibility we need. With the support of the open standard OpenTelemetry, we are able to handle public resources responsibly.

Solution Architect - Porsche Digital
Dash0's foundation on open source standards ensures future-proof and next-gen observability. Their focus on ease of use empowers all of our developers to gain insights quickly.
Connect an account and the picture is already there with no need to write any query or create any dashboard.
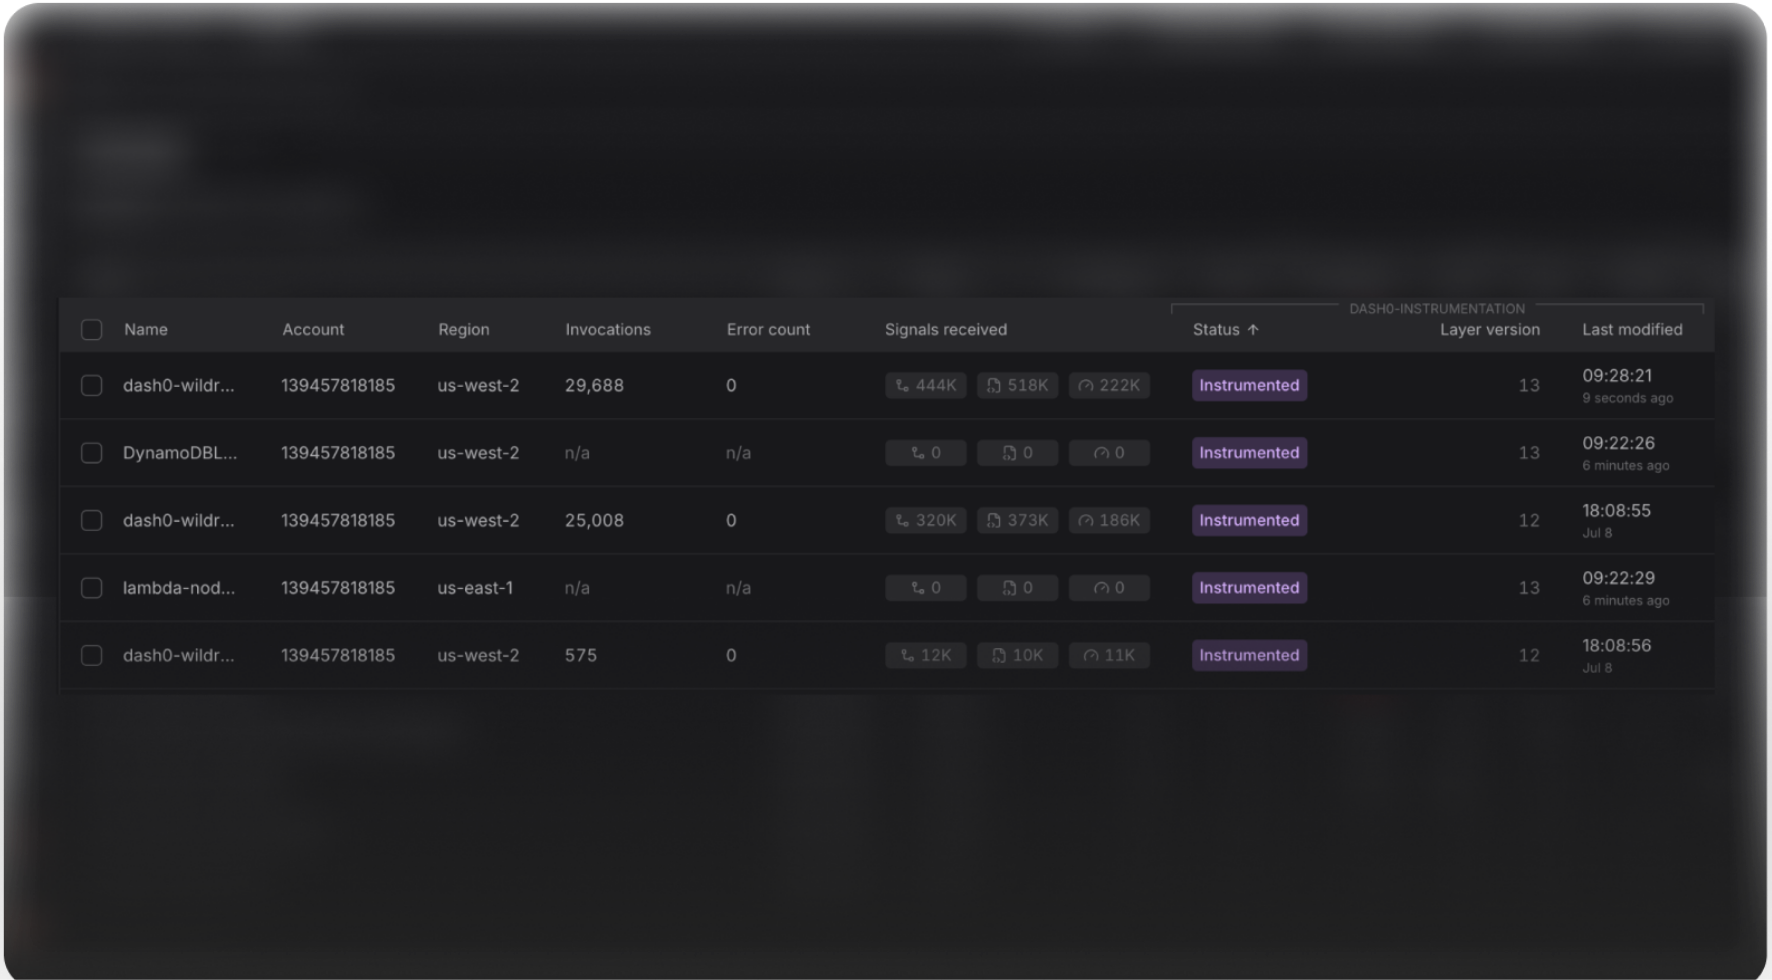
Every Lambda function across your connected accounts and regions appears in one catalog: invocation counts, error rates, duration, and cold start metrics.
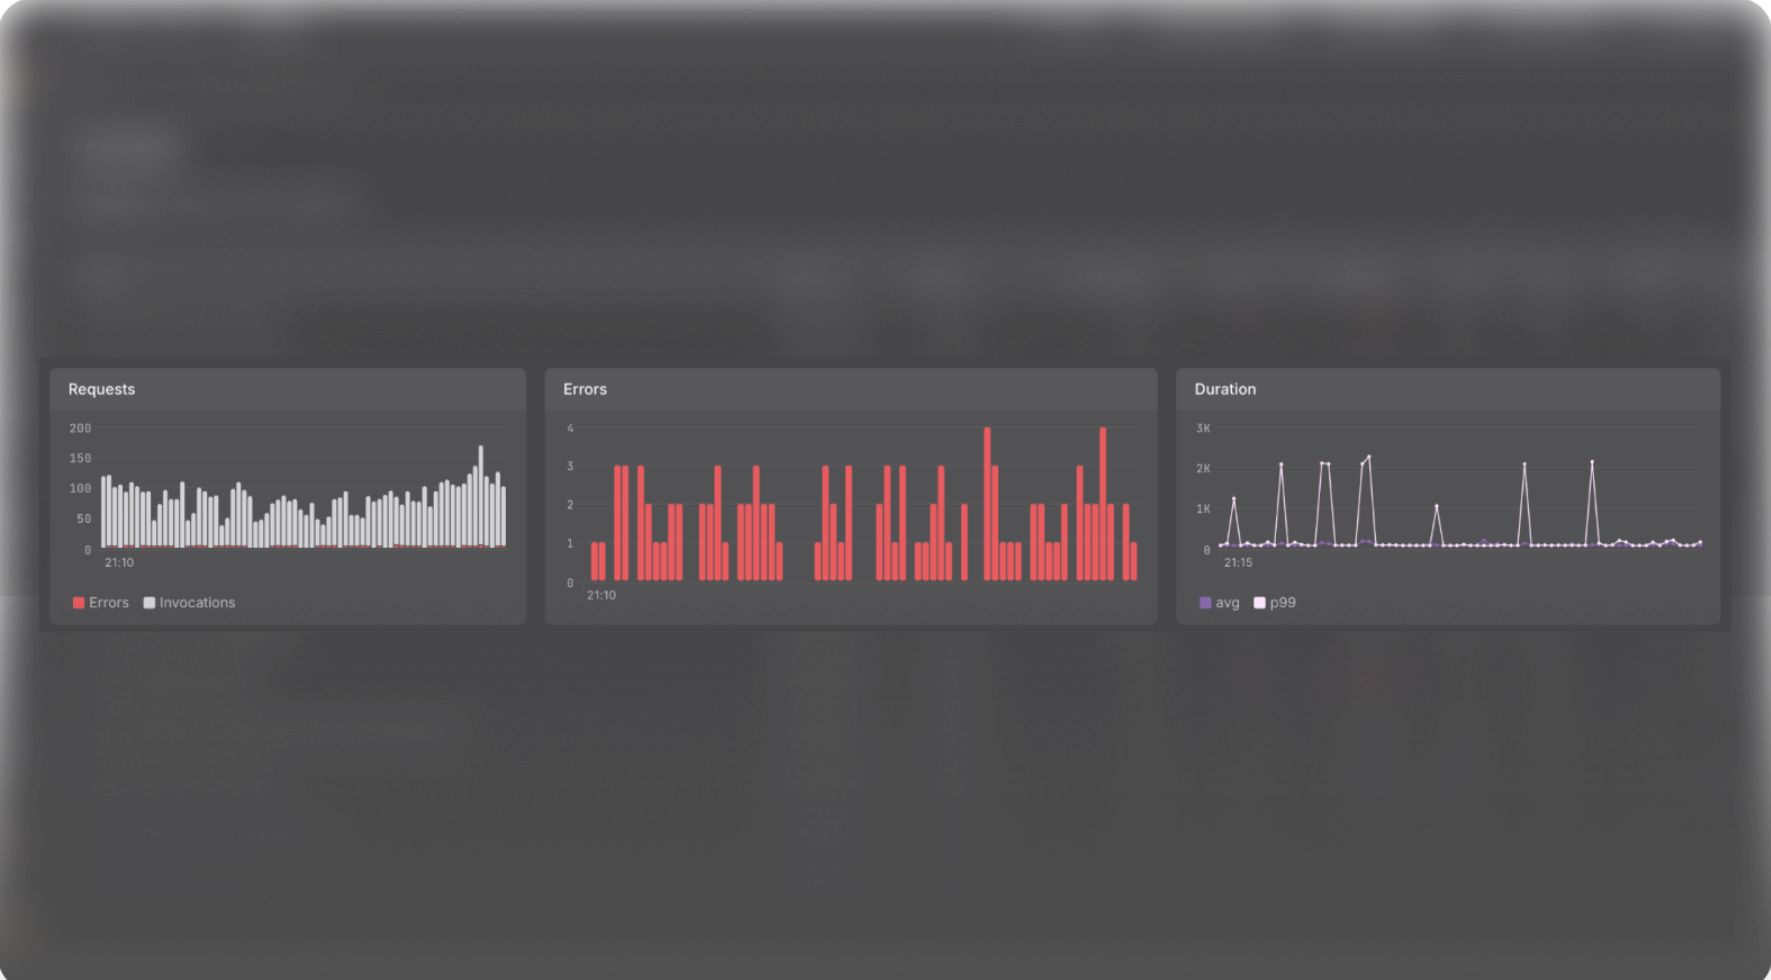
Metrics start flowing the moment you connect, pulled directly from CloudWatch. Nothing to configure or activate.
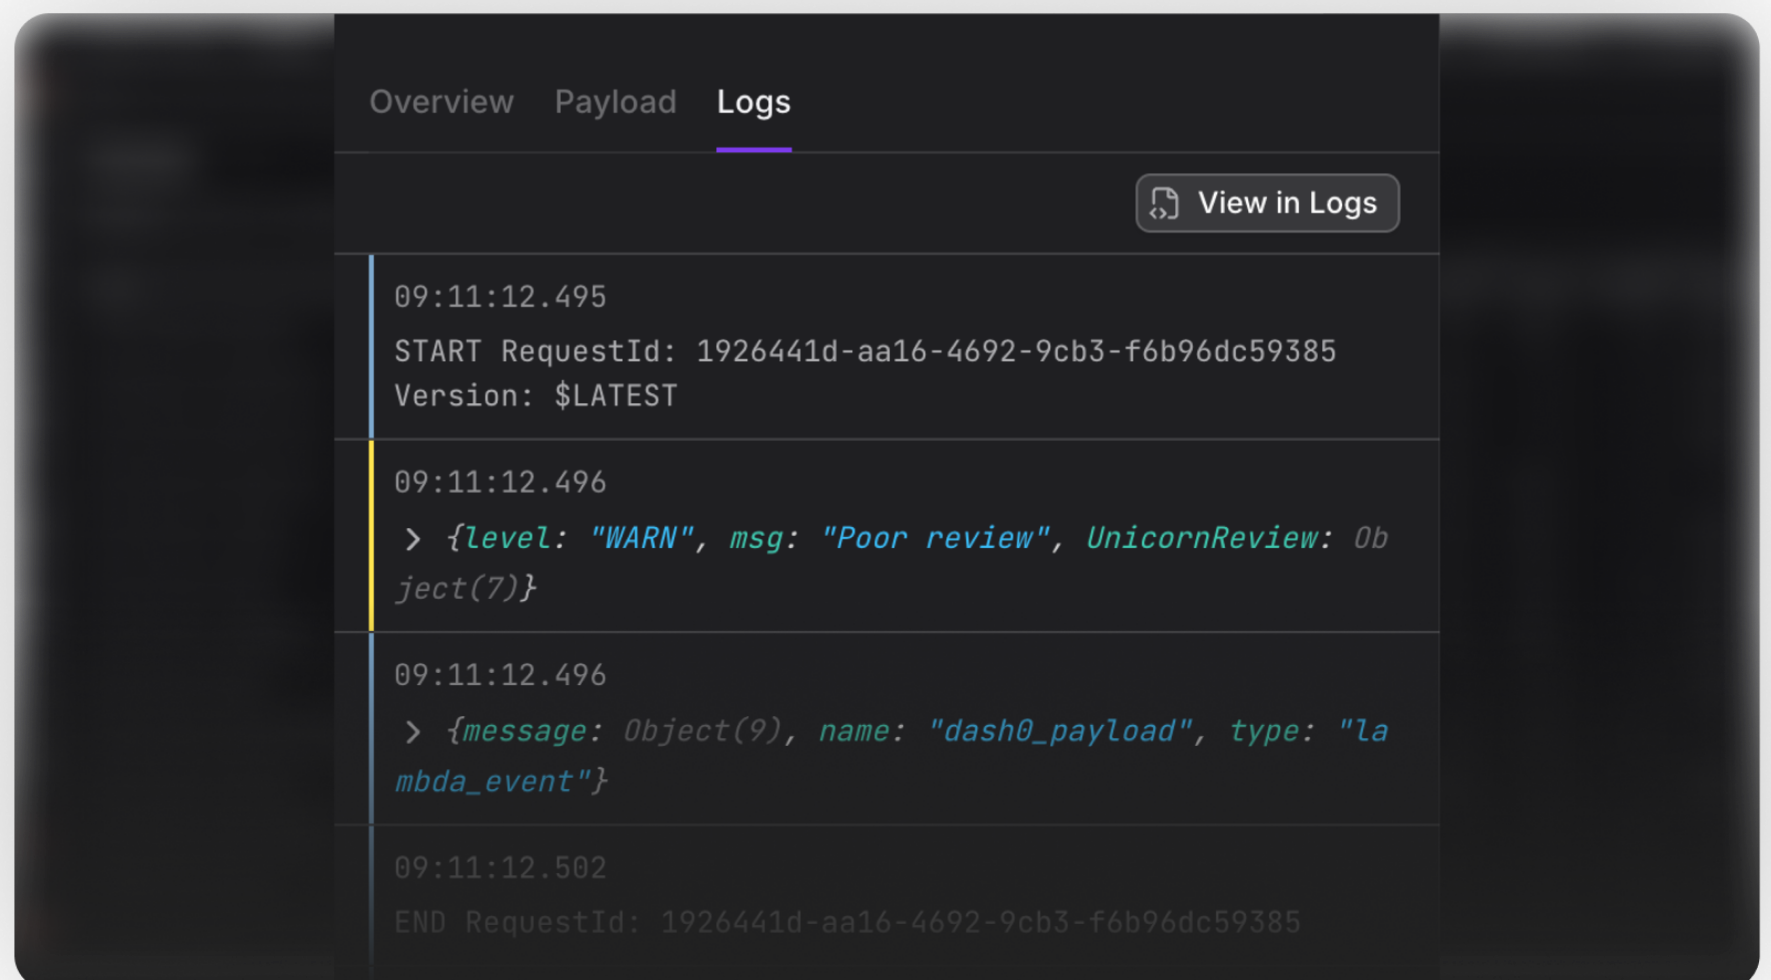
Click any function to open its detail page, then jump straight to its traces and logs in Dash0.
One CloudFormation deployment. No agents, no manual IAM policies, no credentials stored on Dash0’s side.
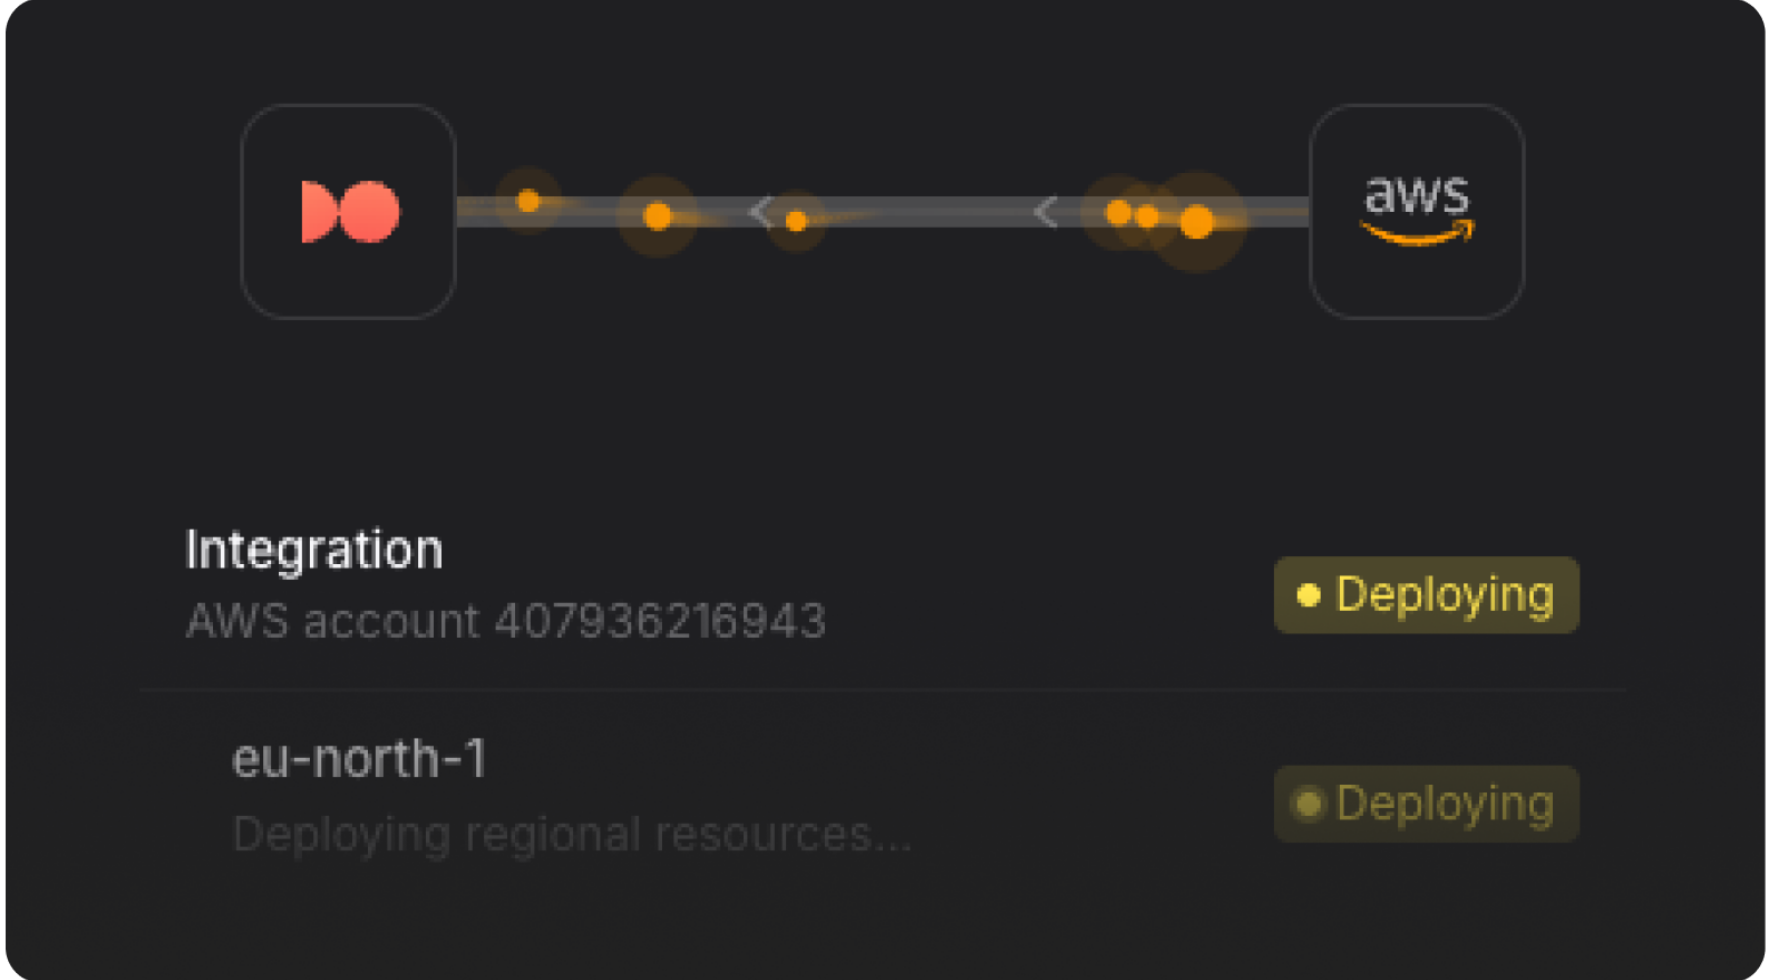
Connect via CloudFormation in under five minutes. Dash0 assumes a cross-account IAM role, so no AWS access keys or secrets ever touch Dash0’s side. Terraform and CDK paths are available.
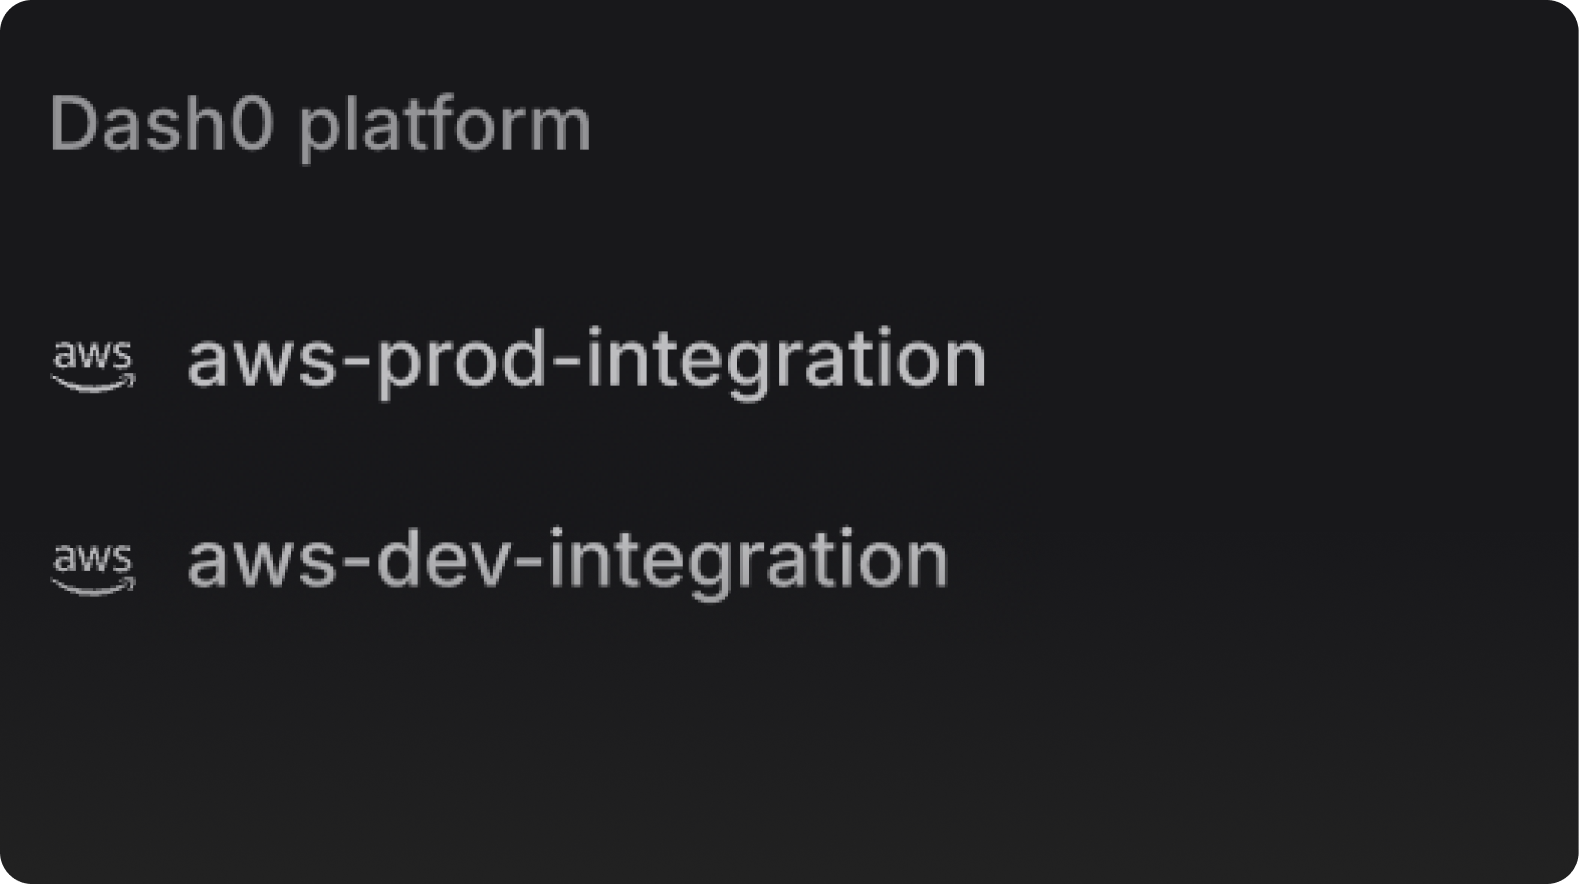
Connect multiple AWS accounts and see all your Lambda functions in a single catalog view, across every account and region you’ve selected.
Every API call Dash0 makes in your account, reading configs, adding layers, assuming roles, is logged in CloudTrail. Security teams can audit exactly what happened, when, and from which role.
Once you can see which functions matter, turn on full observability for them in the same place you found them.
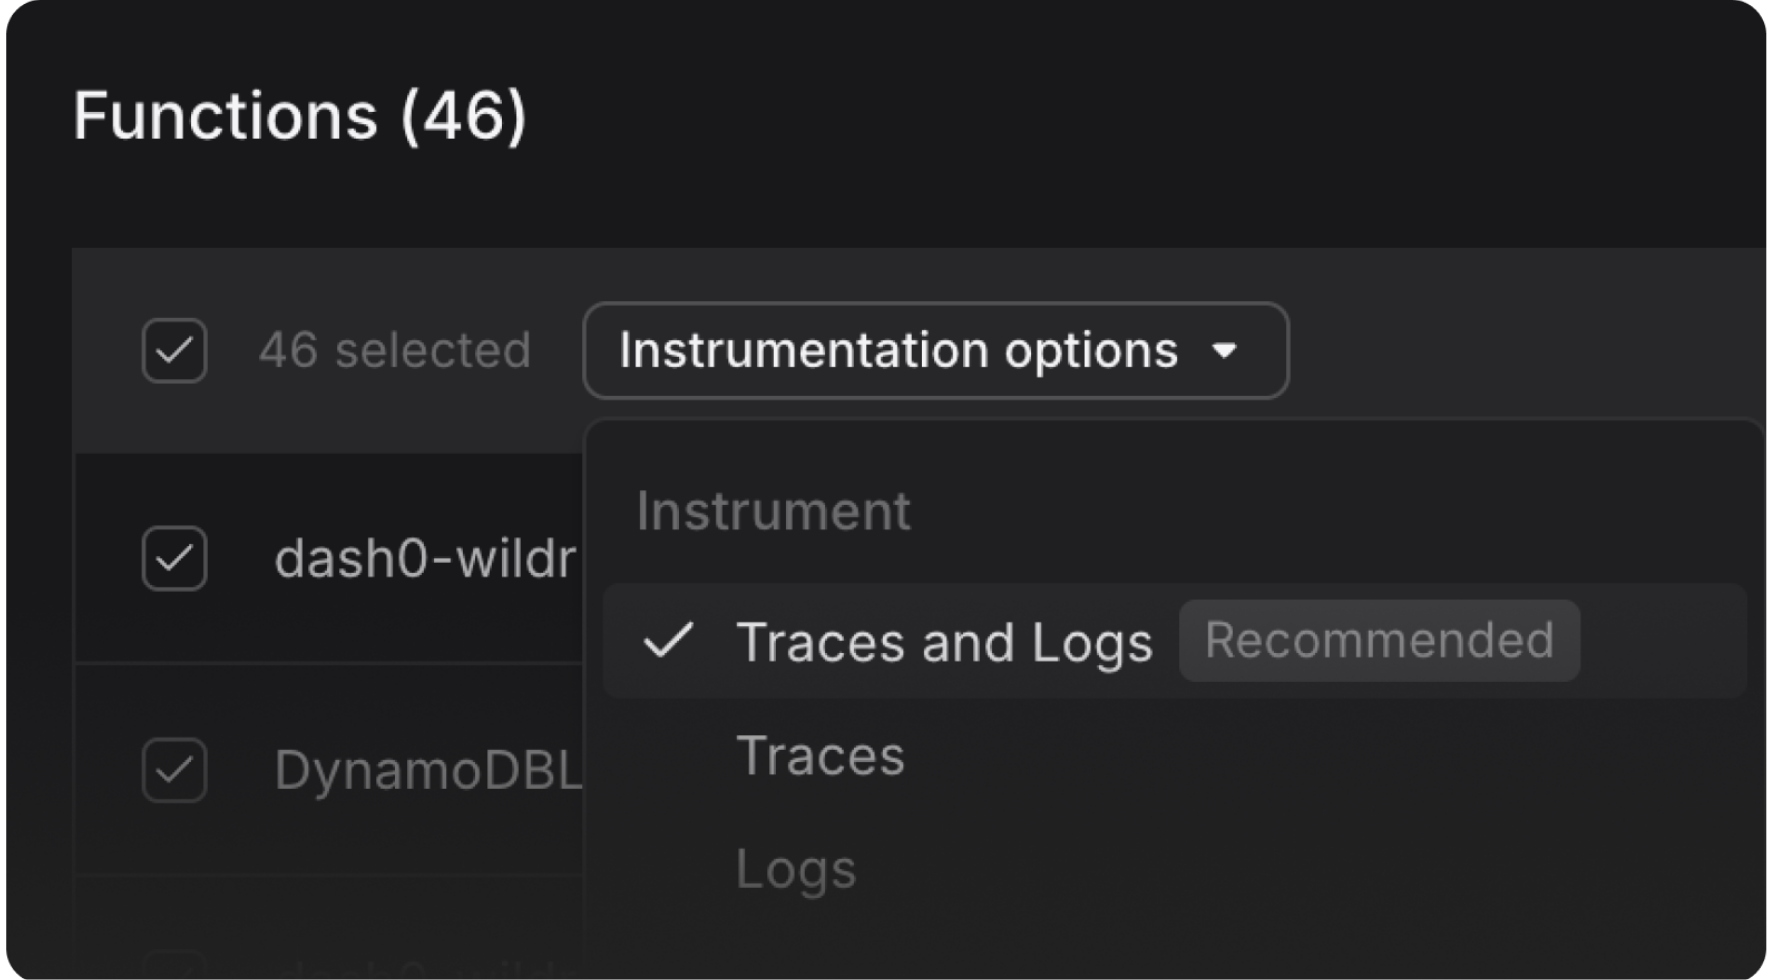
Instrument any function directly from the catalog. Choose traces, logs, or both. Dash0 adds the Dash0 Lambda Extension and configures it.
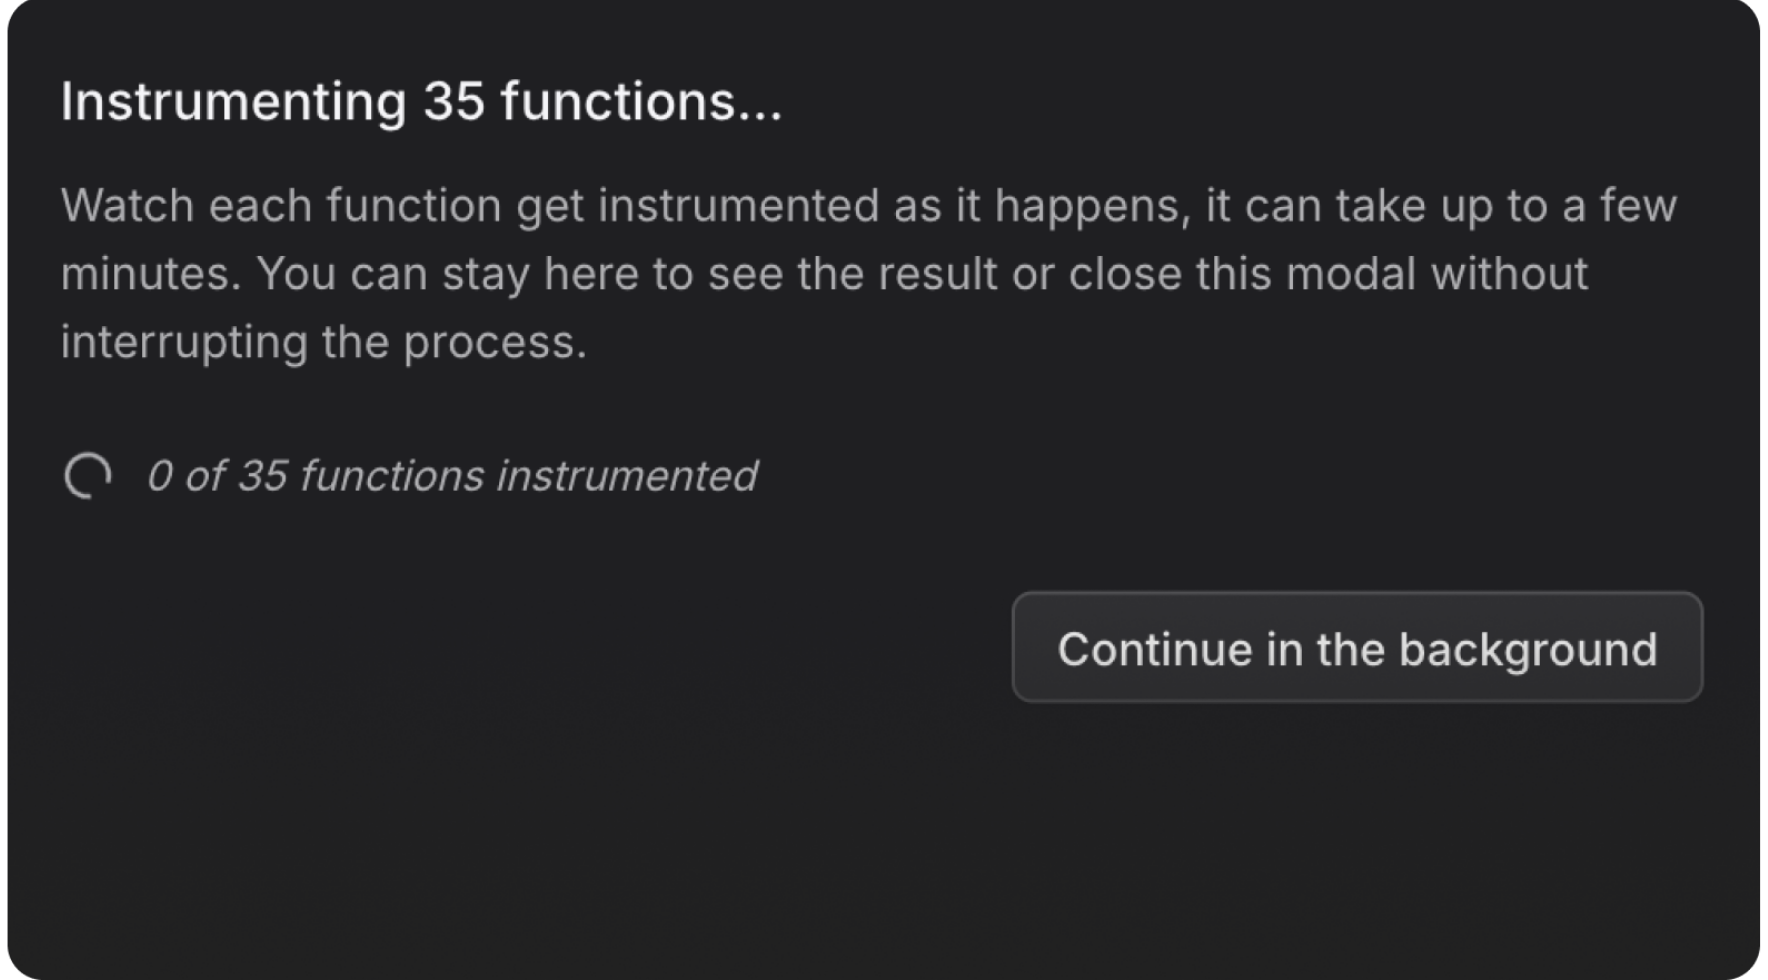
Dash0 checks each function before touching it: container image deployment, code signing, versioned functions, internet access, conflicting vendor layers. If a function can’t be instrumented, you see exactly why.
If a function is redeployed without the Dash0 layer, a manual deploy, a pipeline that missed the config, Dash0 detects the drift and re-instruments automatically.
Instrumented functions get full traces, event payloads, and synthetic traces for timeouts and out-of-memory errors. See Serverless Monitoring for more information.
Start for free or Book a demo