Runtime Metrics
Find the runtime bottleneck behind slow response times
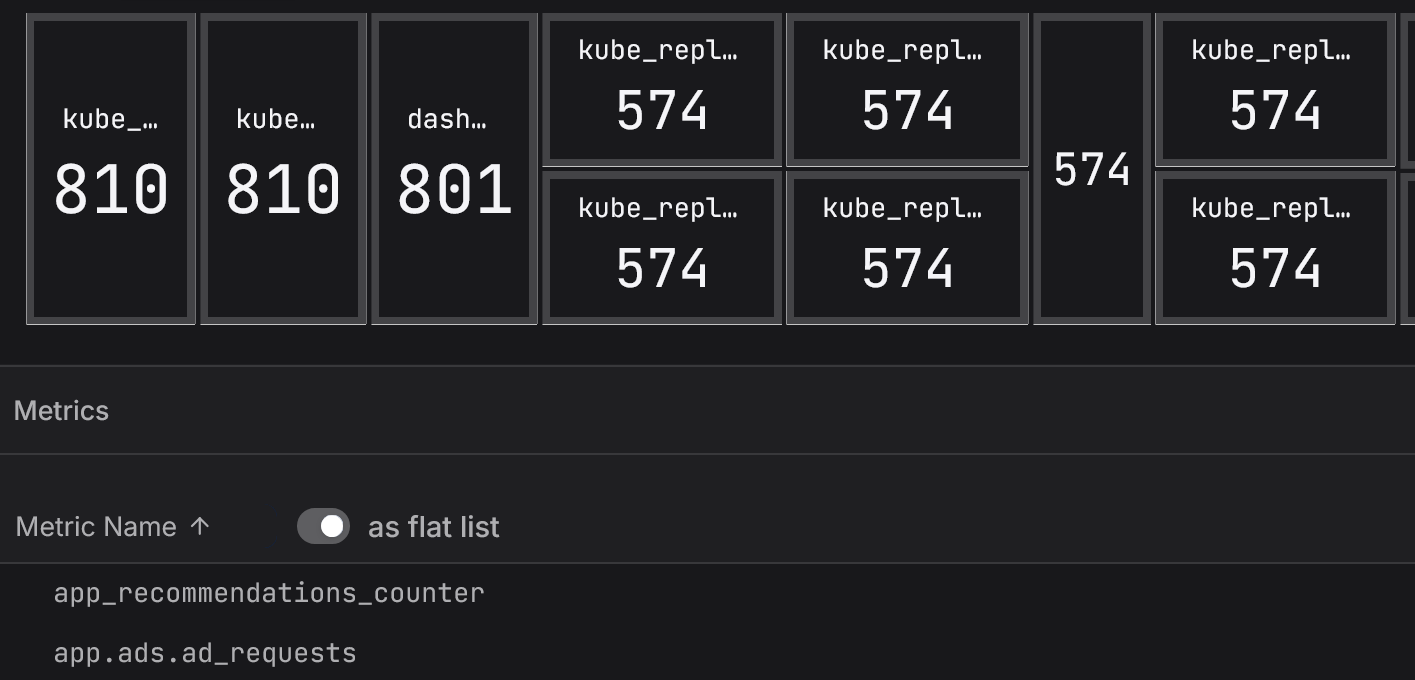
Correlate event loop delay, heap usage, external memory, active handles, and GC pauses with the requests they affected.
Dash0 Raises $110M Series B at $1B Valuation
Debug slow routes, catch memory leaks in long-running services, and trace requests across your entire Node.js stack. Built natively on OpenTelemetry with no proprietary agent or SDK.
Start for free or Book a demo


Infrastructure engineer - Chargetrip
In an age of overly complex tools, we find that Dash0 stands out for its simplicity and speed. With simple pricing, easy integration, amazing filtering capabilities, fast handling of large data volumes, and straightforward alerting with clear error messages, Dash0 makes observability a breeze.

CTO - Hayuno AG
Despite being a young company, Dash0 delivers enterprise-grade quality and features—automatic instrumentation, spans, logs with semantic context, PromQL support, AI-powered trace triage—all working reliably from day one.

Senior Full-Stack Engineer - catchHR
Dash0 has significantly streamlined our approach to observability and OpenTelemetry, bringing everything together in one place. The intuitive interface and seamless integration have enabled us to quickly gain valuable insights into our systems and resolve issues efficiently.

Senior Web Developer - CroCoder
What I love most about Dash0 is that it's fully OpenTelemetry native which has significantly improved our software development process. The seamless navigation from logs to traces to metrics streamlines bug diagnosis and troubleshooting, enhancing our team's efficiency.

Software Engineer - Vercel
The tracing UI is amazing. When we switched to Dash0, it significantly cut down the amount of time from a bug being reported to figuring out why it happened and fixing it. Filtering on attributes is extremely intuitive, and the tracing tree UI is awesome.

DevOps Cloud Architect - AV Software Solutions 360° at Bechtle
With Dash0, we have found an OpenTelemetry-native solution that provides the flexibility we need. With the support of the open standard OpenTelemetry, we are able to handle public resources responsibly.

Solution Architect - Porsche Digital
Dash0's foundation on open source standards ensures future-proof and next-gen observability. Their focus on ease of use empowers all of our developers to gain insights quickly.
See when Node is blocked, leaking memory, or losing async context, with runtime metrics and traces in one place.
Correlate event loop delay, heap usage, external memory, active handles, and GC pauses with the requests they affected.

Traces that propagate through Promises, async/await, and EventEmitters. The full async flow across services, not just HTTP in and out.
Logs, traces, metrics, and alerts in one connected view. Click from one to any other.

Click from a log line to its trace, then jump from a span to the underlying metrics. OpenTelemetry's trace-context correlation and Dash0's resource-centric design make it automatic, no manual linking.
Define checks on Node.js latency, error rates, or event loop lag using PromQL or the query builder. Reuse open-source alert rules from Awesome Prometheus Alerts and get notified via email, Slack, or any webhook.

Install the OpenTelemetry auto-instrumentation package, set a NODE_OPTIONS env var, and point it at Dash0. No code changes required.
Install @opentelemetry/auto-instrumentations-node and activate it via NODE_OPTIONS. The SDK loads before your app and instruments popular libraries automatically.

The open-source Dash0 Operator auto-instruments Node.js pods on Kubernetes. Install with Helm, enable monitoring on your namespace, done.

Open-source skills for Claude Code, Cursor, Windsurf, and 38+ other AI coding agents. Correct resource attributes, span status codes, and Collector patterns from the first commit.
No proprietary agents and no vendor-specific code in your repo, just standard OpenTelemetry from instrumentation to export to query.
Dash0 is designed as an OpenTelemetry-native observability platform. Your instrumentation uses the official OTel JS SDK — semantic conventions and resource attributes preserved as-is, enabling standardized data collection across distributed systems.

Import your existing Prometheus alerts and query traces, logs, and metrics with PromQL or SQL.

Perses-compatible dashboards, PromQL alert rules, and OTel Collector configs. Everything Dash0 produces is an open-standard artifact you can commit to git.
The complete walkthrough: auto-instrumentation setup, custom spans, context propagation across async boundaries, and sending traces to a backend.
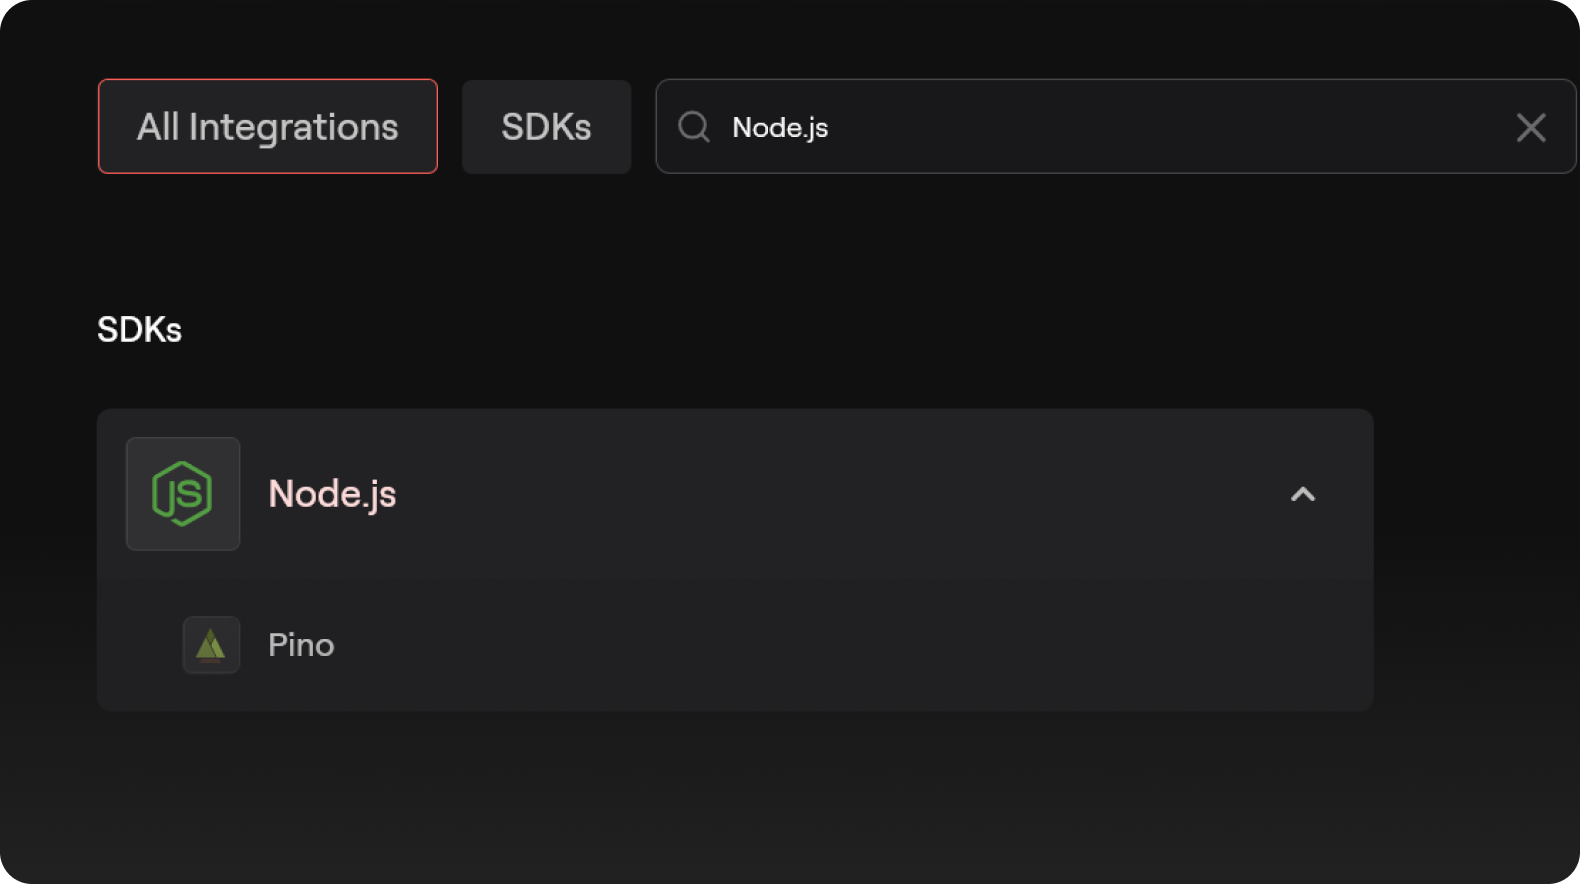
Structured JSON logging with Pino, log levels, redaction, child loggers, and correlating logs with OpenTelemetry traces.
How to use Node.js AsyncLocalStorage to attach request IDs, user context, and trace IDs to every log line without passing loggers around.