Dash0 acquires Polar Signals

Dash0 integrates with AWS Lambda to collect telemetry data such as traces, logs, and metrics.
AWS Lambda is a serverless compute service that lets you run code without provisioning or managing servers. You can integrate AWS Lambda with Dash0 to collect traces, logs, and metrics from your Lambda functions.
Dash0 provides auto-instrumentation for Lambda functions via the Dash0 Lambda Extension. The extension instruments your function with OpenTelemetry and collects traces, logs, and metrics without requiring code changes. It captures event payloads and return values, propagates context across all invocations, and captures timeouts and out-of-memory errors so you can debug failures that never produce a regular trace.
For advanced setups using upstream OpenTelemetry Lambda layers, see Option 3 in the Setup guide.
Dash0 auto-instrumentation requires your AWS account to be connected to Dash0. Dash0 adds the Dash0 Lambda Extension layer and configuration automatically from the Lambda functions catalog. You do not need to look up layer ARNs or configure environment variables manually.
To use UI auto-instrumentation, you need:
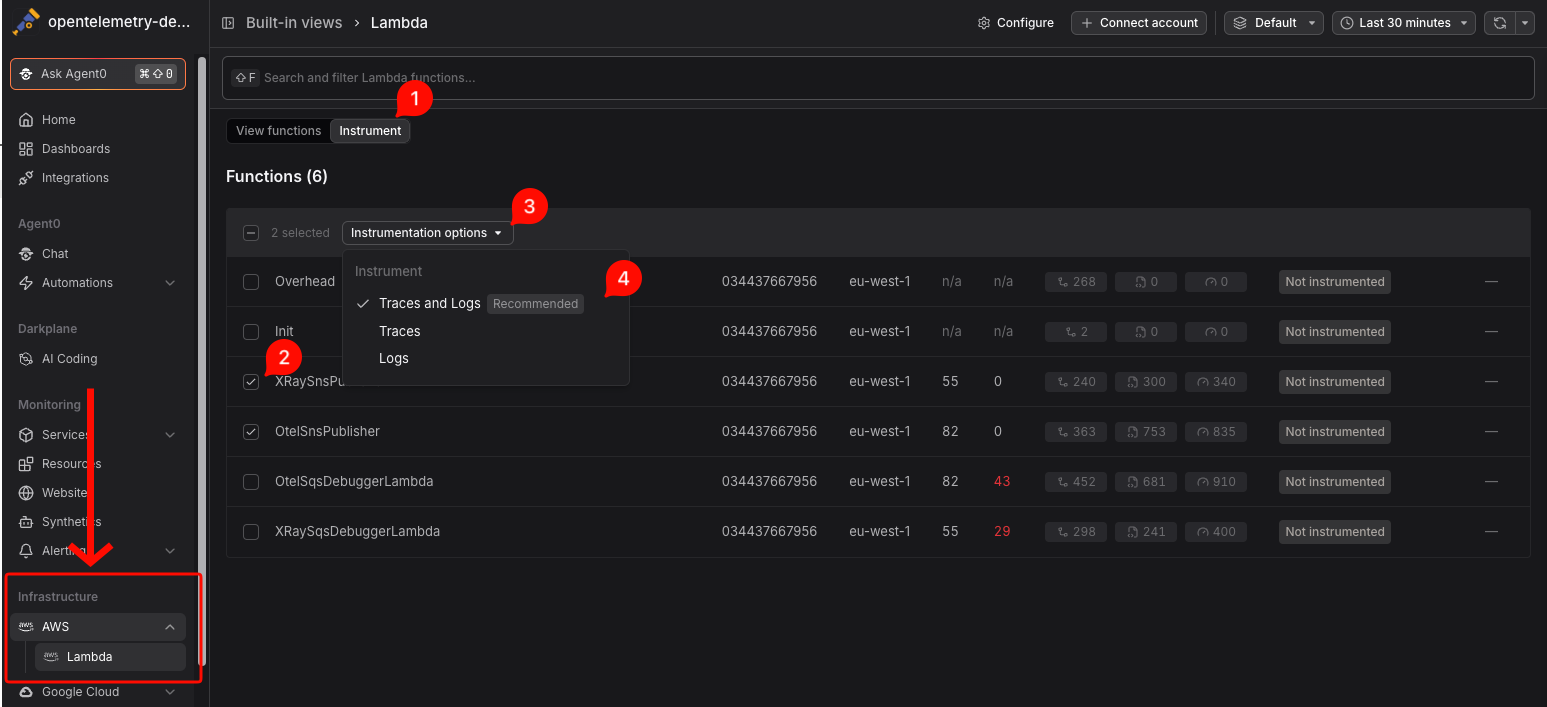
1. Open the Lambda functions catalog
Go to Infrastructure > AWS > Lambda. Every function across your connected accounts and regions is listed with its instrumentation status, invocation count, error rate, and cold start metrics.
2. Select the functions to instrument
Select the functions you want to instrument. You can select multiple functions at once.
3. Choose which signals should be collected and confirm
Select the signals to collect: Traces and Logs, Traces Only, or Logs Only. Dash0 runs pre-flight validations and instruments the eligible functions. Functions that cannot be instrumented are shown with the reason: unsupported runtime, container image deployment, code signing enforced, versioned function (not $LATEST), no internet access, or already instrumented by a different Dash0 organization.
4. Verify
Instrumented functions are marked in the catalog. Telemetry appears in Dash0 the next time the function is invoked. Click any function to open its detail page and navigate to its traces or logs.
Once instrumented, Dash0 monitors each function for configuration drift. If a function is redeployed without the Dash0 layer, Dash0 detects the change and re-instruments automatically.
To remove instrumentation, select the function in the catalog and choose Remove instrumentation. Dash0 removes the layer and environment variables from the function configuration.
Use this path to add the Dash0 Lambda Extension layer directly via the AWS Console, Terraform, CDK, or the serverless-dash0 plugin. This option does not require your AWS account to be connected to Dash0.
To set up AWS Lambda monitoring you will need:
Find the layer ARN for your runtime and region on the Dash0 Lambda Extension releases page and add it to your Lambda function via the AWS Console (Configuration > Layers > Add a layer > Specify an ARN) or your IaC tooling.
For containerized Lambda functions, use the provided Docker images instead. See the extension README for Dockerfile examples.
In the Configuration > Environment variables tab of your Lambda function, add the following:
| Variable | Value |
|---|---|
AWS_LAMBDA_EXEC_WRAPPER | /opt/wrapper |
DASH0_ENDPOINT | {{endpoint_otlp_http}} |
DASH0_TOKEN | {{token}} |
DASH0_DATASET | {{dataset}} |
To avoid storing the token in plaintext, you can instead set DASH0_TOKEN_SECRET_ARN to the ARN of an AWS Secrets Manager secret containing the token.
Invoke your function and verify that telemetry appears in your Dash0 dataset. If you are not seeing data, see the Troubleshooting guide.
For Serverless Framework users, the serverless-dash0 plugin is an alternative to manually adding the layer. It automatically configures the Dash0 Lambda Extension for functions marked with dash0-traced: true in your serverless.yml. See the plugin README for setup instructions.
Use this path when you want the OpenTelemetry Lambda layer stack: a language-specific instrumentation layer, the OpenTelemetry Collector extension layer, and a configuration layer that exports telemetry to Dash0.
Compared to Options 1 and 2, this approach:
Traces, logs, and metrics from the OpenTelemetry SDK inside your function are routed to a local OpenTelemetry Collector, acting as an AWS Lambda External Extension, which then forwards them to Dash0. The collector also collects your function's standard output (stdout) and standard error (stderr) and forwards them as logs.
For Lambda runtime metrics such as throttles and recursive invocations, use the CloudWatch metrics integration.
To set up OpenTelemetry Lambda layers you will need:
x86_64 or arm64)The setup is based on the OpenTelemetry Lambda setup and varies depending on your Lambda function's programming language.
The OpenTelemetry Collector uses a configuration file to determine how telemetry data is received and sent to Dash0. You can store this configuration in three ways:
Create a file named otel-collector-config.yaml with the following content:
The collector configuration should be packaged as a Lambda layer:
otel-collector-config.yaml file so it is located at the root of the ZIP archive (not inside a directory)otel-collector-config)x86_64 or arm64)For detailed instructions, see the AWS documentation on creating layers.
Your Lambda function needs these three layers:
Note: Layer order in the AWS console doesn't affect functionality. The instrumentation wrapper and collector extension are controlled by environment variables, not layer position.
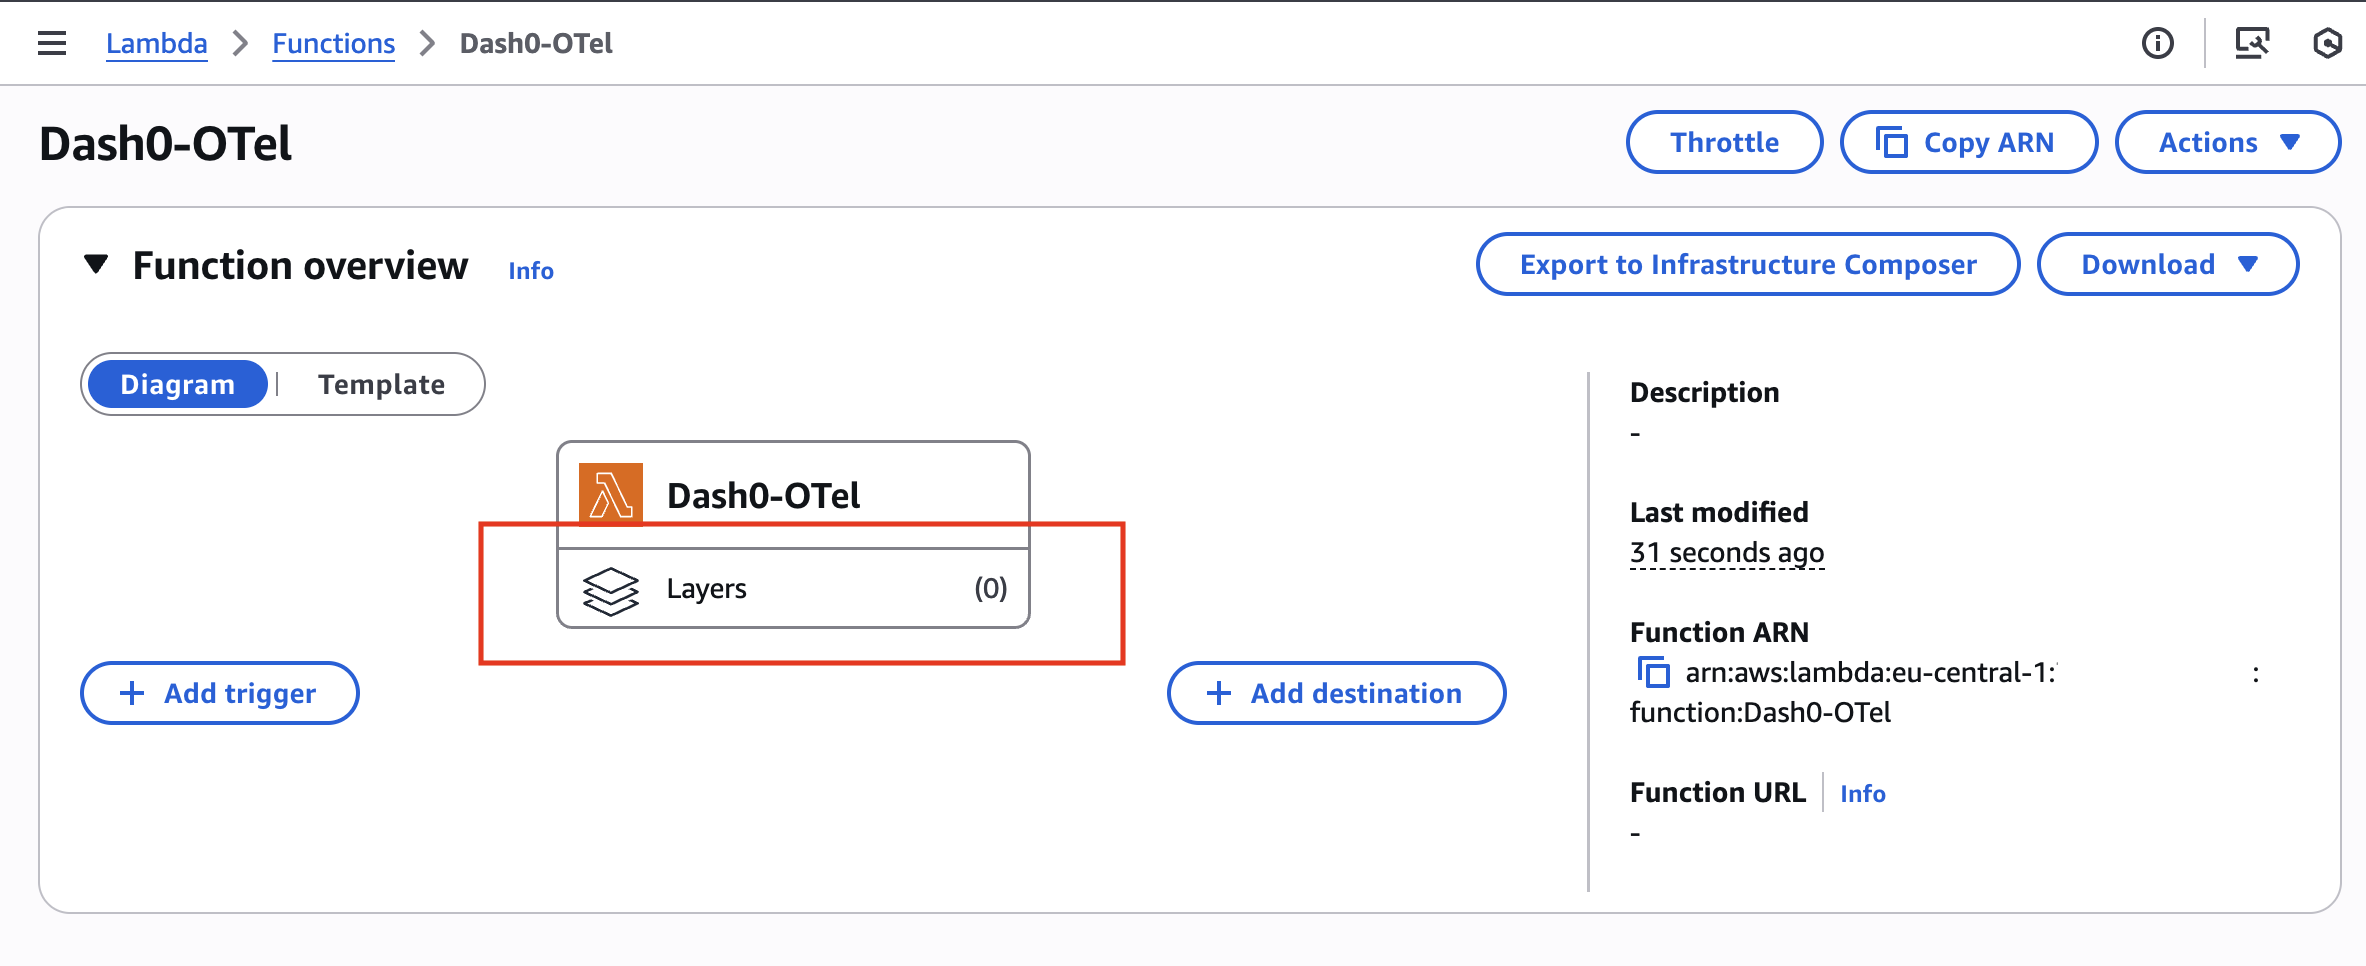

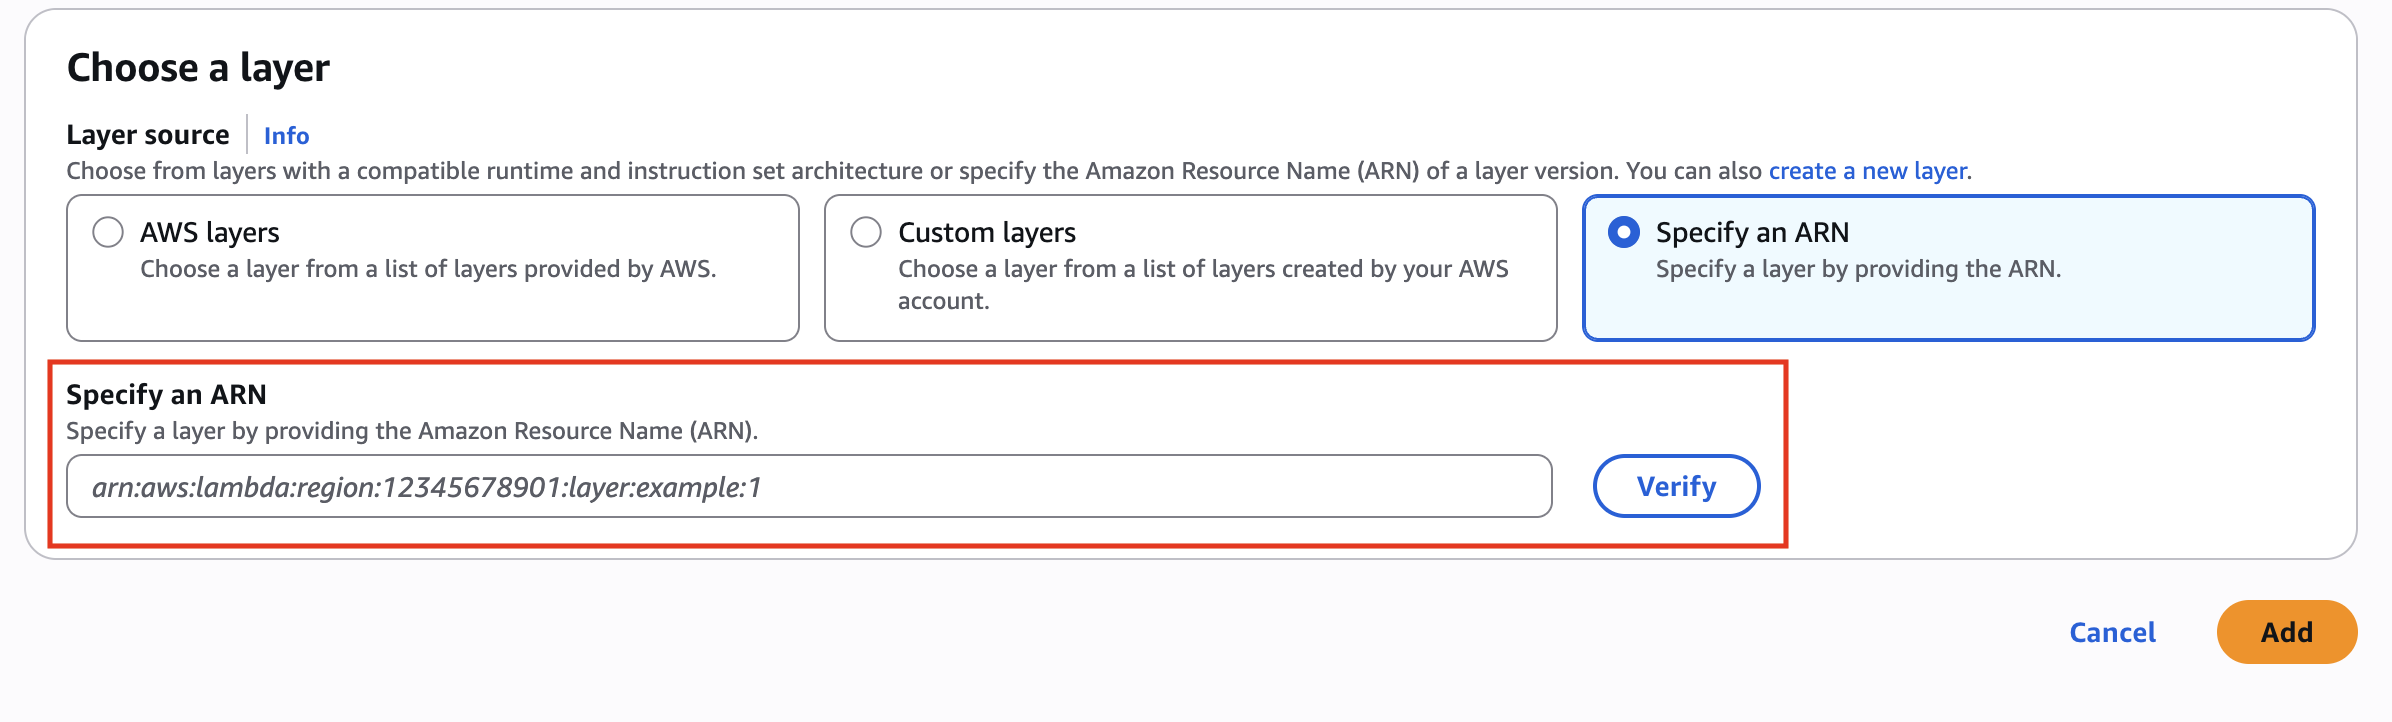
You must edit these values: Replace
<region>with your AWS region and<version>with the latest version number.
| Runtime | Instrumentation Layer ARN | Latest Version | Wrapper Path |
|---|---|---|---|
| Node.js | arn:aws:lambda:<region>:184161586896:layer:opentelemetry-nodejs-<version>:1 | /opt/otel-handler | |
| Python | arn:aws:lambda:<region>:184161586896:layer:opentelemetry-python-<version>:1 | /opt/otel-instrument | |
| Java Agent | arn:aws:lambda:<region>:184161586896:layer:opentelemetry-javaagent-<version>:1 | /opt/otel-handler | |
| Java Wrapper | arn:aws:lambda:<region>:184161586896:layer:opentelemetry-javawrapper-<version>:1 | /opt/otel-handler | |
| Ruby | arn:aws:lambda:<region>:184161586896:layer:opentelemetry-ruby-dev-<version>:1 | /opt/otel-handler |
OpenTelemetry Collector Layer:
arn:aws:lambda:<region>:184161586896:layer:opentelemetry-collector-<amd64|arm64>-<version>:1Common mistake: Using the wrong architecture. Make sure your collector layer matches your Lambda function's architecture (
amd64forx86_64,arm64for ARM).
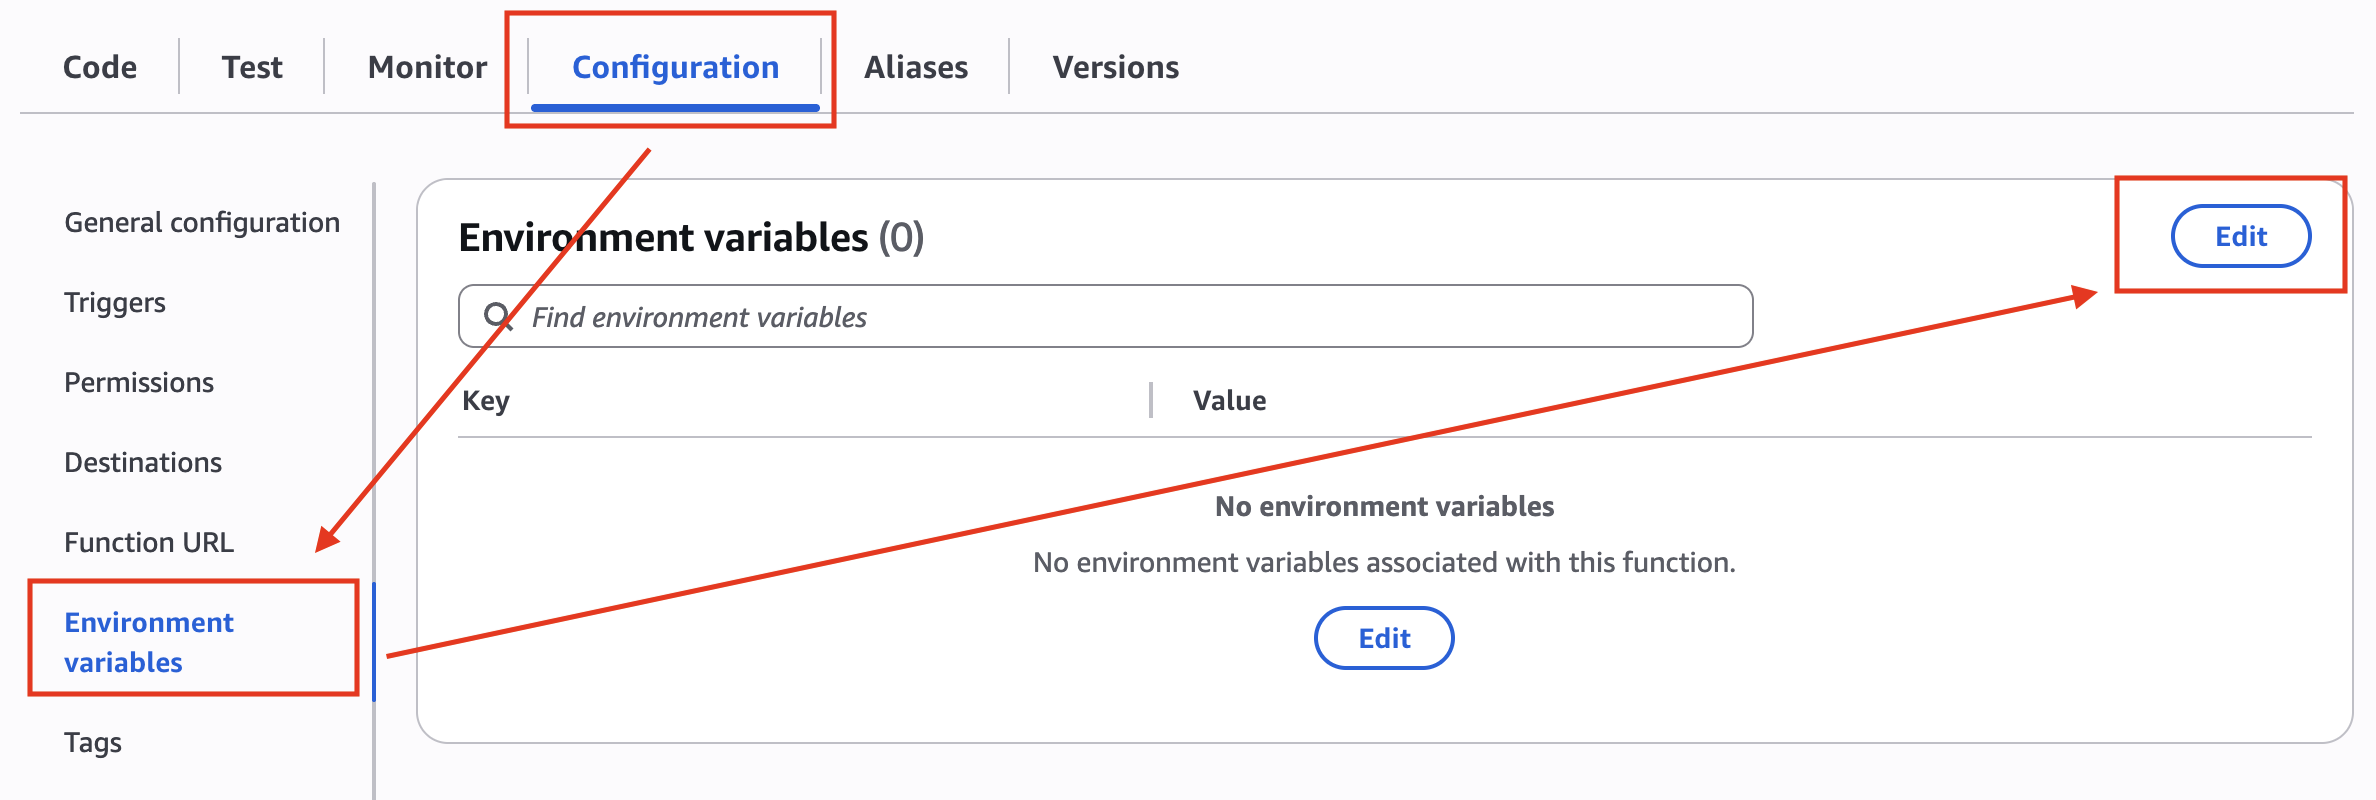
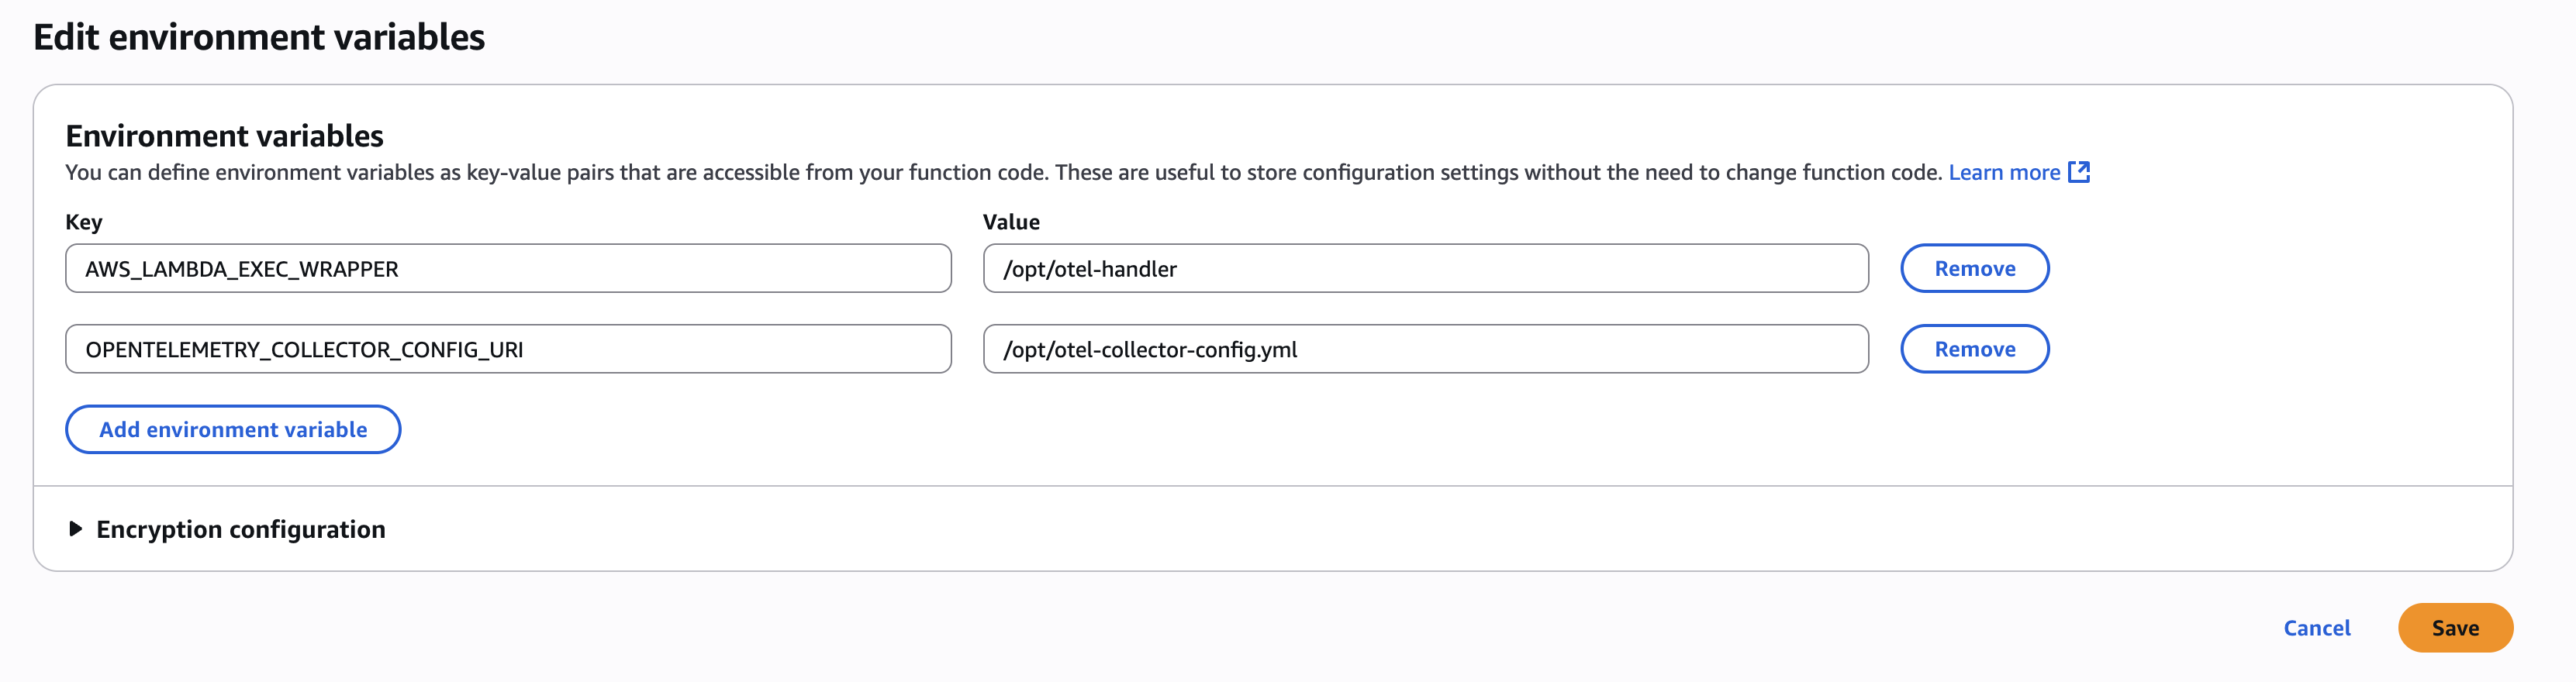
You must edit these values: Use the wrapper path from the table above.
| Variable | Value | Description |
|---|---|---|
AWS_LAMBDA_EXEC_WRAPPER | See table above | Path to the OpenTelemetry wrapper for your runtime |
OPENTELEMETRY_COLLECTOR_CONFIG_URI | See options below | Location of your collector configuration file |
Choose the appropriate URI based on how you stored your configuration file:
/opt/otel-collector-config.yaml/var/task/otel-collector-config.yamls3://<bucket_name>.s3.<region>.amazonaws.com/otel-collector-config.yamlNote: For S3, ensure your Lambda function has permissions to read the bucket and use the full S3 URI including the
s3://prefix.
After completing the setup:
If you are not seeing data, see the Troubleshooting guide.
The OpenTelemetry collector automatically collects Lambda function logs and sends them to Dash0.
Important: To correlate logs with traces, use a logger that supports OpenTelemetry. Your logs should include tracing information as part of their structured output.
Application metrics emitted using the OpenTelemetry SDK are automatically captured by the collector and exported to Dash0.
For Lambda runtime metrics (invocation count, duration, error rates, etc.), use the CloudWatch metrics integration.
The Dash0 authentication token can be stored directly in the OpenTelemetry Collector configuration file.
This configuration file is typically packaged as a Lambda layer or loaded from S3 and is only accessible to the Lambda function via IAM permissions. In this setup, storing the token in the configuration file is considered acceptable and keeps the configuration centrally managed.
For environments with stricter security requirements, you may choose to store the token in a Lambda environment variable or retrieve it from AWS Secrets Manager or Parameter Store. These approaches require additional setup and permissions and may introduce minor cold start overhead.