Last updated: August 21, 2026
What Is MTTD, MTTA, and MTTR?
Every incident follows the same timeline: something breaks, eventually someone notices, eventually someone starts working on it, and eventually service comes back. MTTD, MTTA, and MTTR carve that timeline into three measurable phases, each pointing at a completely different bottleneck.
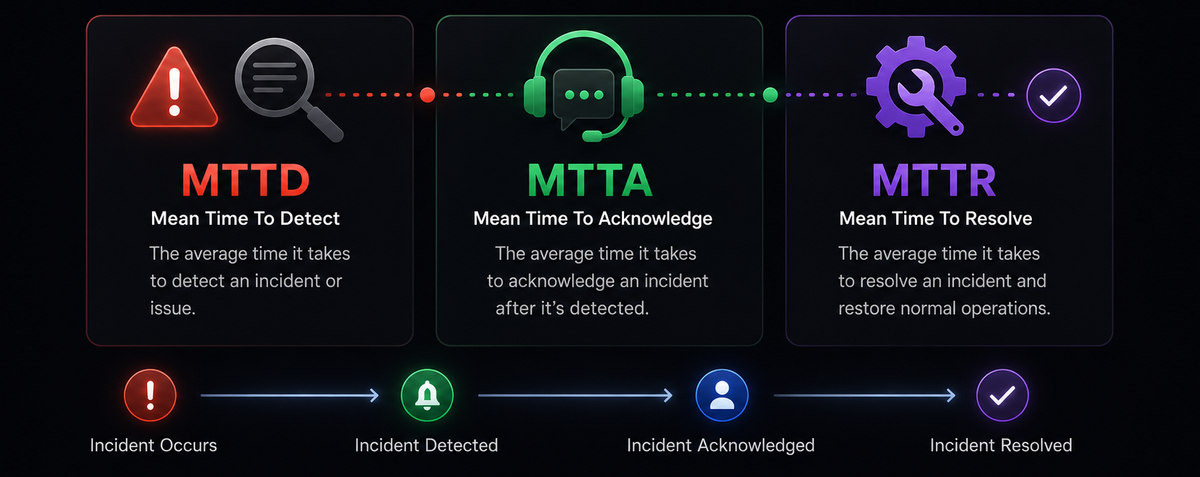 Most teams track MTTR and ignore the other two. That's a problem, because a 15-minute fix doesn't help much if the incident ran undetected for 45 minutes before anyone even opened a laptop. These three metrics together tell you where your time actually goes during an outage, and knowing which phase eats the most time is how you figure out what to improve next.
This article covers what each metric measures, how to calculate it, the non-obvious ways each one misleads you, and a diagnostic for figuring out which one deserves your attention right now.
How the three metrics split the incident timeline
Before diving into each metric individually, it helps to see how they fit together. The incident timeline looks like this:
123456Incident Alert Human starts Servicestarts fires working restored│ │ │ │├───MTTD───►├───MTTA────►├─────MTTR─────►││ │├──────────── Total duration ───────────►│
MTTD (Mean Time to Detect) covers the gap from failure to first alert. MTTA (Mean Time to Acknowledge) covers the gap from alert to a human picking it up. MTTR (Mean Time to Resolve) covers from acknowledgment through service restoration. Total incident duration is roughly MTTD + MTTA + MTTR.
Each metric is owned by different parts of the system. MTTD is a monitoring problem. MTTA is an on-call and paging problem. MTTR is a people-and-runbooks problem. Improving one doesn't touch the others, which is why you need all three to know where to invest.
MTTD: Mean Time to Detect
MTTD measures the average time between the moment an incident starts and the moment your team becomes aware of it. It's the window where something is already broken, users may already be affected, and nobody on your side knows yet.
How to calculate it
Add up the detection delay for every incident in a time window, then divide by the number of incidents:
1MTTD = sum of (detection time − incident start time) / number of incidents
Say you're reviewing a quarter with five incidents. You reconstruct the start time and detection time for each from logs, alert timestamps, and tickets:
123456Incident Started Detected DelayA 09:12 09:18 6 minB 14:03 14:11 8 minC 02:47 03:32 45 minD 11:20 11:24 4 minE 16:55 17:07 12 min
1(6 + 8 + 45 + 4 + 12) / 5 = 15 min
Your MTTD for the quarter is 15 minutes.
What MTTD actually reveals
MTTD is the metric most directly tied to your monitoring coverage. A high MTTD means either your alerting rules don't cover the failure mode that just happened, or they do but the thresholds are too relaxed to fire quickly enough. It's the metric that answers "how fast do we notice when something breaks?"
The hard part isn't the arithmetic. It's deciding what "started" means. You could anchor it to when the fault occurred (a bad deploy went out at 09:12), when impact became measurable (error rate crossed a threshold at 09:15), or when it was detectable (the signal existed in your telemetry at 09:13, whether or not anything alerted on it). The first is technically accurate but you often only learn it in the postmortem. The second is usually the most honest anchor for a reliability metric, since it's when users started feeling it. The third is useful for evaluating whether your alerting could have caught it faster.
Pick one definition and apply it consistently. Switching anchors between incidents makes the trend meaningless. For most SRE teams, measuring from the onset of user-visible impact gives the number that correlates with what customers actually experienced.
How to reduce MTTD
Alert on symptoms, not just causes. Paging on high CPU tells you a machine is busy. Paging on elevated request latency or error rate tells you customers are hurting right now. Symptom-based alerting tied to your service level objectives (SLOs), combined with anomaly detection for the signals where you can't define a fixed threshold, catches classes of failure you never predicted rather than only the specific causes you thought to write a rule for. Google's SRE guidance on alerting on SLOs is the canonical reference here.
Cover the signals you're missing. Detection gaps are usually signal gaps. If a service emits metrics but no traces, a slow dependency shows up as vague latency with no way to localize it. If logs aren't correlated with metrics, an error spike and its root cause sit in two different tools nobody checks at 2 a.m. Bringing metrics, logs, and traces into one correlated view is what turns a faint signal into a fired alert.
MTTA: Mean Time to Acknowledge
MTTA measures the average time between an alert firing and a human starting to work on it. It's the gap between "the system knows" and "a person knows and is doing something about it."
How to calculate it
1MTTA = sum of (acknowledgment time − alert time) / number of incidents
Using the same five incidents, this time tracking from alert to acknowledgment:
123456Incident Alerted Acknowledged DelayA 09:18 09:20 2 minB 14:11 14:14 3 minC 03:32 03:58 26 minD 11:24 11:26 2 minE 17:07 17:09 2 min
1(2 + 3 + 26 + 2 + 2) / 5 = 7 min
Your MTTA for the quarter is 7 minutes. Incident C at 3:32 a.m. dragged the average up because the on-call engineer was asleep and it took three escalation rounds to get a response.
What MTTA actually reveals
MTTA is the most human metric of the three. It's driven by on-call rotation design, escalation policy configuration, and how fatigued your engineers are from noisy alerting. A high MTTA usually traces back to one of two categories.
The first is alert fatigue. If your team gets 200 alerts a day and most of them don't require action, the real ones sit in a queue of noise. The fix isn't "respond faster." A team that gets five alerts a day and acts on all five will have a lower MTTA than a team that gets fifty and triages the first twenty before finding the one that matters.
The second is paging configuration: escalation gaps and routing problems. If the primary on-call doesn't respond in five minutes and there's no automatic escalation to a secondary, the alert just sits there. If a database alert fires to the frontend team because nobody updated the routing after the last reorg, the frontend engineer looks at it, realizes it's not theirs, and forwards it. Both patterns burn pure MTTA time, and both are fixed in your paging tool's configuration rather than by asking humans to be faster.
How to reduce MTTA
The biggest lever is reducing alert volume so the alerts that do fire get immediate attention. Beyond that, escalation policies need tight timeouts (5 minutes to primary, 5 minutes to secondary, then the whole team) and alerts need to route to the team that actually owns the service. It's also worth tracking MTTA by time of day: if it looks fine during business hours but spikes overnight, you have a scheduling problem, not a process problem.
One thing worth noting: MTTA is easy to game. If you set a target of "acknowledge within 3 minutes," on-call engineers will hit the ack button immediately to stop the clock, then go back to sleep. A fast MTTA paired with a slow MTTR is the signature of an ack-and-forget culture. Track both together.
MTTR: Mean Time to Resolve
MTTR measures the average time from when someone starts working on an incident to when service is restored. It's the metric everyone knows, the one leadership asks about, and the one with the most confused definition in the industry.
The acronym problem
MTTR is four metrics wearing one trenchcoat. The "R" can mean repair (time to fix the broken component), recovery (time to restore service to users), resolve (time from detection through permanent fix, including preventing recurrence), or respond (time from first alert to beginning work, which overlaps with MTTA). The DevOps Research and Assessment (DORA) framework uses the recovery definition, and that's the one that maps most directly to customer impact.
This matters because comparing your MTTR to an industry benchmark is meaningless if you're measuring different things. A team reporting a 15-minute MTTR using the recovery definition (service back up) looks very different from a team reporting 15 minutes using the resolve definition (root cause fixed and prevented).
For reliability purposes, recovery is usually the right one to track as your primary MTTR. It's what DORA measures when they report that elite teams restore service in under an hour while low performers take over a week. Track time-to-resolve separately if you want to measure how well your postmortem follow-through works, but don't conflate the two.
Whatever definition you pick, write it down in your incident process and make sure everyone calculates it the same way.
How to calculate it
Using the recovery definition, the clock starts when a human begins working and stops when service is restored:
1MTTR = sum of (resolution time − acknowledgment time) / number of incidents
123456Incident Acknowledged Resolved DelayA 09:20 09:35 15 minB 14:14 14:44 30 minC 03:58 05:13 75 minD 11:26 11:38 12 minE 17:09 17:31 22 min
1(15 + 30 + 75 + 12 + 22) / 5 = 30.8 min
What MTTR actually reveals
MTTR is driven by diagnosis speed, not fix speed. According to DORA's State of DevOps research, the diagnosis phase (figuring out what's actually wrong) typically consumes 40 to 60 percent of total resolution time. The actual repair, whether that's rolling back a deploy, restarting a service, or scaling up capacity, is often fast once you know what to do.
This means the most effective way to reduce MTTR is not faster fingers on a keyboard. It's faster understanding of the system state: better runbooks, richer context in alerts, and observability that lets you pivot from "latency is high" to "this specific database query started scanning the table after yesterday's migration" in minutes instead of hours.
How to reduce MTTR
Build runbooks for your top five recurring incidents. Most teams have a small set of failure modes that account for the majority of pages. If the on-call engineer has to rediscover the diagnosis every time, you're paying the full investigation cost repeatedly. A runbook that says "if you see X, check Y, then run Z" compresses the diagnosis phase for known failure patterns.
Make investigation context available from the alert itself. If an alert says "high error rate on checkout service" and the engineer then spends 20 minutes finding the right dashboard, pulling up logs, and correlating with recent deploys, that's investigation time baked into every incident. Alerts that link directly to the relevant traces and metrics eliminate the first 10 minutes of every response.
Practice with game days and chaos engineering. Teams that have rehearsed failure scenarios respond faster under real pressure because the diagnosis patterns are already cached in their heads. The first time you see a particular failure mode in production, it's slow. The second time, it's fast. Practicing buys you the second-time speed without paying the production-outage price.
Why all three averages lie
This applies to MTTD, MTTA, and MTTR equally, and it's the thing most incident-metrics articles skip.
The mean hides the incidents that actually hurt. Go back to the MTTD example. The mean was 15 minutes, but four of the five incidents were caught in under 12 minutes and one took 45. The 45-minute incident did the real damage, and the mean politely blends it into a reassuring single digit. The same pattern shows up in the MTTA numbers (one 26-minute overnight gap dragging up the average) and the MTTR numbers (one 75-minute investigation while the others were under 30).
Track the p90 and p95 of each metric, or at minimum look at the distribution. A team with a 15-minute mean MTTD and a 45-minute p95 has a very different problem than a team where every incident lands near 15 minutes.
For MTTD specifically, you only measure incidents you detected. MTTD is calculated over incidents that entered your system, which by definition are the ones your monitoring caught. The incident that ran for three days until a customer emailed support, or the slow data-corruption bug nobody noticed until quarter-end, often never gets logged as an incident with a clean start time. So the metric quietly excludes exactly the failures where detection was worst. Your MTTD can look excellent precisely because your blind spots are invisible to the thing measuring them.
The fix for all of this is the same instinct: treat these metrics as distributions to interrogate, not as targets to hit.
Which metric to fix first
If you're looking at all three numbers and wondering where to invest, the diagnostic is straightforward. Put the five incident timelines together:
123456Incident MTTD MTTA MTTR TotalA 6 min 2 min 15 min 23 minB 8 min 3 min 30 min 41 minC 45 min 26 min 75 min 146 minD 4 min 2 min 12 min 18 minE 12 min 2 min 22 min 36 min
For most incidents, MTTR is the largest phase. That's the conventional wisdom: invest in faster resolution. But look at Incident C. Detection took 45 minutes, acknowledgment took another 26, and the fix took 75 minutes. The total was 146 minutes, and 71 of those minutes (nearly half) were burned before anyone even started working. No amount of runbook polish helps with that.
The rule of thumb: look at which phase contributes the most to your worst incidents, not your average ones. Your typical incidents are probably fine. Your tail incidents are where the real damage happens, and the bottleneck in those is often detection or acknowledgment, not resolution.
Here's how to read your own numbers.
If MTTD is your largest phase in the tail, your monitoring has coverage gaps. You're either missing alerts for the failure modes that hurt most, or your alerting thresholds are too relaxed. Invest in symptom-based alerting, SLO-driven burn-rate alerts, and covering the signals (traces, logs) that your current alerting can't see.
If MTTA is your largest phase in the tail, your on-call process has gaps. Alerts are firing but nobody is picking them up quickly enough, especially off-hours. Review escalation timeouts, alert routing, and whether your team is drowning in low-signal noise that delays response to the real pages.
If MTTR is your largest phase in the tail, your diagnosis process is slow. Engineers are getting to incidents fast but spending too long figuring out what's wrong. Build runbooks for recurring failures, improve the context attached to alerts, and invest in observability that lets you go from symptom to root cause without opening six tools.
Most teams, when they first break their incidents down this way, find that MTTD and MTTA together account for more time than they expected, especially in the worst incidents. The conventional focus on MTTR isn't wrong. It just misses the fact that the pre-work phases often dominate the tail.
Final thoughts
MTTD, MTTA, and MTTR measure three distinct phases of every incident, and each one points at a different investment. MTTD tells you whether your monitoring sees the problem. MTTA tells you whether your on-call process gets a human engaged. MTTR tells you whether that human can fix it quickly. Tracking only MTTR, as most teams do, means you're blind to the detection and acknowledgment phases that often dominate your worst outages.
The numbers themselves are only useful if you watch the distribution rather than the mean, define your start times consistently, and focus your improvement effort on the phase that's eating the most time in the tail rather than the average.
Shrinking all three phases is fundamentally an observability problem. MTTD improves when your telemetry covers more failure modes. MTTA improves when alerts are high-signal enough that engineers trust them. MTTR improves when the investigation path from symptom to root cause is fast because logs, metrics, and distributed traces are correlated in one place rather than scattered across tools.
Dash0 is an OpenTelemetry-native observability platform built to compress all three phases. Alerting on SLOs and error-budget burn rates catches incidents faster than static thresholds. Correlated signals mean the investigation starts with context instead of a scavenger hunt. And open standards mean your alerting, dashboards, and data stay portable.
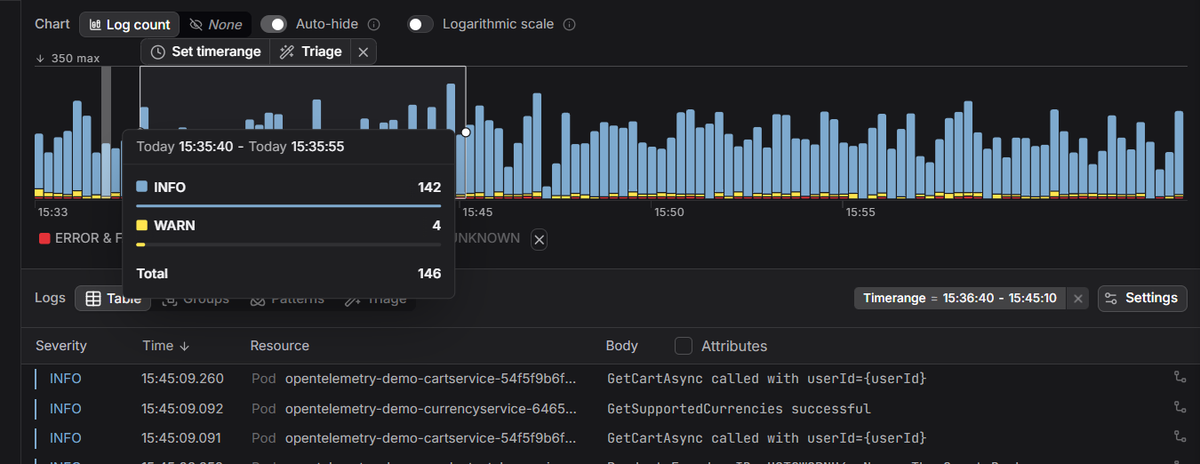 Start a free trial to see your logs, metrics, and traces in one view and cut the time from incident start to resolution. No credit card required.