Your dashboards are green. Every threshold is calm. Then a slow cascade starts: a dependency returns slightly elevated latency, request queues grow, error rates tick up in one microservice. Nothing fires. By the time something does, the blast radius is already wide.
Anomaly detection is the practice of automatically identifying behavior that deviates from what's expected without requiring you to define what "wrong" looks like ahead of time. Instead of asking "did this metric cross 85%?", it asks "does this metric look like it usually does?" That shift sounds subtle but changes the entire operational posture.
How anomaly detection actually works
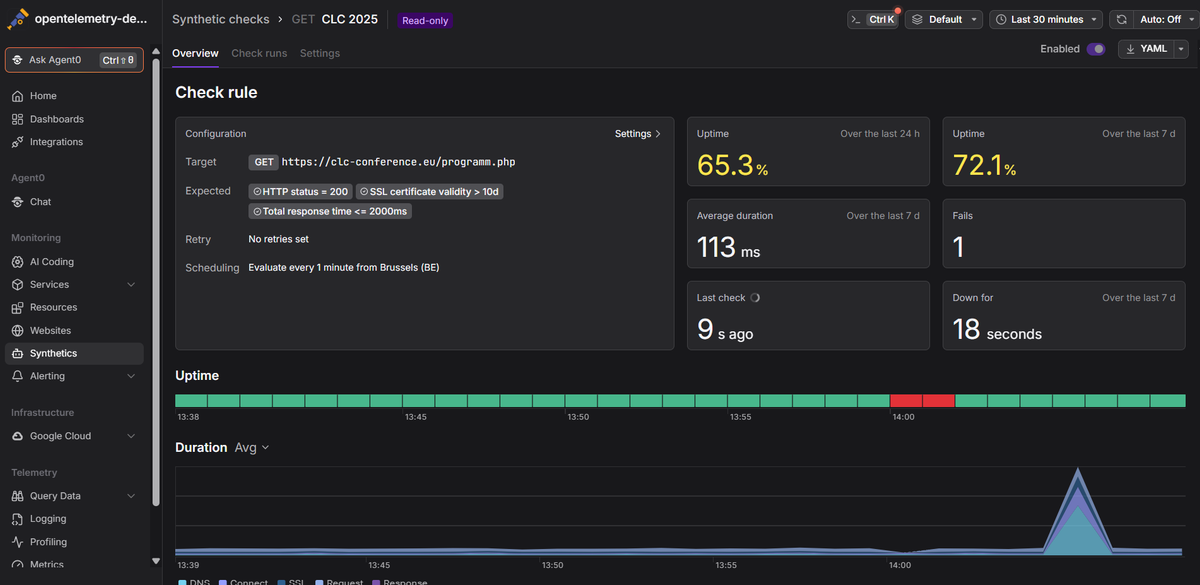
Static alerting is a lookup table. You encode a rule (CPU above 85%, latency above 500ms) and the monitoring system checks whether incoming data crosses that line. It works for things you've already broken in production. It misses the things you haven't.
Anomaly detection replaces the fixed line with a learned model of what normal looks like. The system ingests historical data, builds a baseline, and continuously compares new data against it. Deviations that are statistically unusual relative to that baseline trigger an alert, even if the absolute value would look fine in isolation.
This matters because "normal" is rarely static. CPU utilization that spikes every Monday morning at 9am isn't an anomaly. It's a recurring pattern. A memory leak that climbs steadily from 40% over 36 hours never crosses your 85% threshold until it's already caused a degradation. A model that understands baseline behavior catches both; a threshold catches neither.
Detection algorithms
Different algorithms make different trade-offs between sensitivity, explainability, and computational overhead.
Z-score and rolling median absolute deviation (MAD) are the simplest statistical approaches. They flag data points that fall more than N standard deviations from the mean over a sliding window. They're fast, explainable, and appropriate for well-behaved univariate time series. The weakness is an assumption of roughly normal distributions and no built-in handling for seasonality.
Forecasting models like ARIMA or Holt-Winters explicitly model trends and seasonality. You fit the model on historical data, generate a prediction for each future window, and flag points that fall outside a prediction interval. These are better at distinguishing an unusual Tuesday from an expected Monday spike, though they require more tuning and can drift when patterns change.
Isolation Forest is a tree-based, unsupervised ML algorithm that works on the intuition that anomalies are rare and different, so they're easy to isolate. The algorithm recursively partitions the feature space at random. Anomalous points, sitting far from the cluster of normal data, require fewer cuts to isolate. That shorter path length translates directly to an anomaly score. Isolation Forest scales well to high-dimensional data and requires minimal hyperparameter tuning, which is why it's common in production observability pipelines.
Autoencoders are neural networks trained to compress input data into a small representation and reconstruct it. A network trained only on normal data reconstructs normal inputs well but fails to reconstruct anomalies accurately. The reconstruction error is the anomaly score. Autoencoders work well on high-dimensional, unstructured signals like raw log streams, but they're harder to explain and more expensive to train and run.
Real production systems often combine multiple detectors and surface only points where several methods agree. Combining Isolation Forest with a statistical baseline, for example, tends to cut false positives significantly compared to either alone.
The false positive problem
Here's the thing that bites teams: anomaly detection doesn't reduce alerting toil by default. It can make it dramatically worse.
A model with slightly too high sensitivity will flag every weekly traffic spike, every deployment, every routine maintenance window. Gartner has found that roughly 60% of alerts in IT monitoring environments are false positives. When engineers learn the system cries wolf, they stop investigating. The alerts become noise.
A few things help. Seasonality-aware models that understand weekly and daily patterns generate fewer spurious alerts than simple rolling-window detectors. Alert suppression windows after deployments prevent the model from interpreting known-good behavior changes as incidents. Requiring anomalies to persist across multiple consecutive windows before firing also reduces noise, since transient spikes often self-correct.
The less-discussed failure mode is the opposite: a model that's too conservative misses real degradations because they fall within normal-looking variance. Slow memory leaks, creeping latency in a downstream service, gradual error rate drift. All of these can hide inside the model's learned baseline if the baseline window is too short or the sensitivity threshold is too forgiving.
Tuning anomaly detection is an ongoing operation, not a one-time configuration.
Anomaly detection across telemetry signals
The mechanics apply across all three observability pillars, but the practical considerations differ.
Metrics are the most natural fit. Time series data with clear periodicity, request rates, error rates, latency histograms, CPU and memory, is exactly what statistical and ML-based detectors are designed for. Cardinality is the complication: a service with hundreds of endpoints and dimensions means hundreds of independent models to maintain or a single high-dimensional model that's harder to tune.
Logs present a different challenge. You're not detecting anomalies in numeric values but in the frequency, pattern, or content of log messages. Baseline detection here usually means tracking the rate of specific log patterns or error signatures over time and flagging when a known-quiet endpoint suddenly starts logging at high volume. This requires structured logs or at least consistent log formats to work reliably. If your logs are unstructured, Log AI can assign severity automatically, giving the detector something meaningful to baseline against without you needing to write regex parsers first.
Traces are where anomaly detection gets genuinely useful for distributed systems debugging. Detecting a span that took 10× longer than its p99 latency, or a trace path that includes an unexpected service call, surfaces issues that would be nearly invisible in aggregate metrics. This is also where the combination of anomaly detection and correlation matters most. Identifying that the anomalous spans all share a specific deployment.environment attribute or originate from one particular pod narrows the blast radius fast.
What anomaly detection doesn't do
A few things worth being clear about before you go and replace all your alert rules.
Anomaly detection doesn't replace threshold-based rules for things you know matter. If a payment processing service errors above 0.1%, you want that rule. A model that might need three anomalous windows before it fires isn't fast enough for an SLO breach.
It also doesn't explain why something is anomalous. The detector tells you a span's duration is unusual relative to its baseline. It doesn't tell you why. Root cause analysis still requires correlating the anomaly against changes in related signals, deployment history, and downstream dependencies.
And it doesn't fix poor instrumentation. Models trained on low-cardinality or sparsely labeled telemetry produce poor baselines. Anomaly detection is downstream of instrumentation quality.
Making anomaly detection useful in practice
The best place to start is with signals where static thresholds already cause you pain, either constant false alarms from legitimate traffic patterns, or missed detections because the right threshold is impossible to pin down. Latency and error rates in services with unpredictable traffic are good candidates. Flat metrics with clear SLOs are not.
A detected anomaly in isolation is just noise. It becomes actionable when you correlate it with context: a deployment that went out 10 minutes ago, a dependent service that started behaving strangely, a spike concentrated in one customer segment. Building that correlation layer is what separates useful anomaly detection from an alert that pages you at 3am with no useful information.
The last piece is feedback. When engineers mark alerts as false positives, that signal should feed back into model retraining or threshold calibration. Without it, a deployed model drifts, and drift in a detection model usually means slowly increasing noise until the team disables it.
Once you've resolved an active incident, it's worth reviewing whether a better baseline model would have caught it earlier, or whether it fired so many false positives that the real signal was buried.
Final thoughts
Anomaly detection works best as a complement to threshold-based alerting, not a replacement for it. Use thresholds for things with clear, known failure conditions and SLOs attached. Use anomaly detection for the rest: the signals where the right threshold doesn't exist, where normal shifts with traffic patterns, or where the degradation is too gradual for a fixed line to catch.
The biggest failure mode isn't a bad algorithm. It's deploying a model, walking away, and discovering six months later that the team stopped looking at its alerts. Build in feedback from the start, tune for your actual traffic patterns, and treat the first 30 days as calibration, not production.
For a deeper look at how Dash0 surfaces outliers in trace data specifically, the Outliers Map docs are a good next read.
Dash0 is an OpenTelemetry-native observability platform that unifies logs, metrics, and traces in one place. Agent0 is Dash0's autonomous production AI, with a Seeker agent built specifically for anomaly detection, root cause analysis, and incident investigation against your live telemetry, without you needing to predefine what failure looks like.
 Start a free trial to see your traces, logs, and metrics together. No credit card required.