
A Docker image is a stack of read-only layers, each one a tar archive of filesystem changes. To see what's actually in one (config, environment variables, files inside each layer, secrets that might have been accidentally baked in), you don't run the image, you crack it open.
This matters for security audits, debugging mystery image bloat, and verifying what a base image contains before you build on top of it. There are five practical ways to do it, ranging from a one-liner that takes a second to an interactive layer browser. Pick based on how deep you need to go.
Inspect image metadata with docker image inspect
Start with docker image inspect when you need the image's configuration: entrypoint, command, environment variables, exposed ports, labels, layer digests, and architecture. This is metadata only, not filesystem contents.
1docker image inspect nginx:alpine
That returns a hefty JSON blob. Filter it with --format to get just what you need. To see the environment variables baked into the image:
12docker image inspect nginx:alpine \--format '{{json .Config.Env}}' | jq .
123456["PATH=/usr/local/sbin:/usr/local/bin:/usr/sbin:/usr/bin:/sbin:/bin","NGINX_VERSION=1.27.5","PKG_RELEASE=1","DYNPKG_RELEASE=1"]
Version numbers will differ depending on when you pull the image, since nginx:alpine tracks the mainline branch.
To list layer digests in order (oldest first):
12docker image inspect nginx:alpine \--format '{{json .RootFS.Layers}}' | jq .
12345["sha256:08000c18d16d...","sha256:9534c1fe0a4f...","sha256:2dc4d2c0d8c2..."]
These digests are content-addressable: the same layer in two different images has the same hash. That's how Docker shares storage between images that use the same base, and it's useful for spotting common ancestry across your fleet. What this command won't show you is what files are inside each layer.
View build steps with docker history
docker history shows the layer-by-layer construction of the image as a reconstructed Dockerfile with sizes. It's the fastest way to spot the layer that ballooned your image.
1docker history nginx:alpine
123456789IMAGE CREATED CREATED BY SIZE9aa9b6c8f3e1 2 weeks ago CMD ["nginx" "-g" "daemon off;"] 0B<missing> 2 weeks ago STOPSIGNAL SIGQUIT 0B<missing> 2 weeks ago EXPOSE 80 0B<missing> 2 weeks ago ENTRYPOINT ["/docker-entrypoint.sh"] 0B<missing> 2 weeks ago COPY 30-tune-worker-processes.sh /docker-en… 4.62kB<missing> 2 weeks ago RUN /bin/sh -c set -x && ... 47.8MB<missing> 2 weeks ago ENV NGINX_VERSION=1.27.5 0B<missing> 2 weeks ago /bin/sh -c #(nop) ADD file:9d7c... in / 8.31MB
Read the rows top-to-bottom as newest-to-oldest. The <missing> entries aren't actually missing layers. Docker just doesn't have local IDs for intermediate layers it didn't build itself, and BuildKit moves layer history to the registry manifest anyway. More on that in the pitfalls below.
The "CREATED BY" column is truncated by default. To see the full commands (useful for spotting suspicious RUN curl ... | sh lines):
1docker history nginx:alpine --no-trunc
Combine with --format for a clean view of just the layers that have weight:
12docker history nginx:alpine \--format "table {{.Size}}\t{{.CreatedBy}}" --no-trunc
This is also the right place to start when auditing a third-party image you didn't build. Each RUN and COPY is a chance for something unexpected to land in the filesystem.
Extract the flat filesystem with docker create and export
When you want to see the files, the cleanest approach is to create a container from the image without starting it, then export its filesystem. docker create builds the container's root filesystem on disk but doesn't run anything, so the export reflects exactly what your image would expose to a running process, with no runtime modifications mixed in.
123container_id=$(docker create nginx:alpine)docker export "$container_id" | tar -xC ./nginx-fsdocker rm "$container_id"
That gives you the entire flattened filesystem in ./nginx-fs:
1ls ./nginx-fs
12bin docker-entrypoint.d etc lib mnt proc run srv tmp varboot docker-entrypoint.sh home media opt root sbin sys usr
Now you can grep for secrets, find large files, or diff against a known-good baseline:
1find ./nginx-fs -type f -size +1M -exec ls -lh {} \;
The catch: this is the merged filesystem, with all layers collapsed into one tree. You can't tell which file came from which layer. If that distinction matters, and for layer optimization it usually does, use docker save or dive instead.
One more thing about docker export: it captures the filesystem only, not the image config. ENTRYPOINT, ENV, and CMD are dropped. If you docker import the resulting tar to make a new image, you'll need to specify those again with --change.
Examine raw layers with docker save
docker save exports an image as a tar archive that preserves the layer structure. This is the format Docker itself uses to ship images between hosts, and it's the most faithful representation of what's stored on disk.
1234docker save nginx:alpine -o nginx-alpine.tarmkdir nginx-extractedtar -xf nginx-alpine.tar -C nginx-extracted/ls nginx-extracted
1blobs/ index.json manifest.json oci-layout repositories
That's the OCI image layout, which is what Docker v25 and later produces by default. index.json and oci-layout are the OCI entry points; manifest.json and repositories stick around for backward compatibility with tools that predate the OCI format. Layer tarballs live inside blobs/sha256/ as content-addressable files named by their digest. Older Docker versions (without containerd-snapshotter, on v24 or earlier) produce a different layout with one directory per layer hash containing a layer.tar, plus manifest.json and repositories at the top level.
1cat nginx-extracted/manifest.json | jq .
Either way, manifest.json is the simplest entry point. It lists the layer paths in order, so you can extract a single layer to look at its contents without writing format-specific code:
12345# Get the second layer's path from the manifestlayer=$(jq -r '.[0].Layers[1]' nginx-extracted/manifest.json)mkdir layer-1tar -xf "nginx-extracted/$layer" -C layer-1/ls layer-1
This is where you'll see Docker's whiteout files (.wh.filename) that mark deletions from previous layers. Knowing they're there explains the first pitfall below.
Use docker save when you need to inspect layers programmatically, ship an image to an air-gapped environment, or feed the archive into a vulnerability scanner.
Browse layers interactively with dive
Dive is the tool I reach for whenever I need to understand an unfamiliar image. It's an open-source terminal UI that puts image layers in one pane and the file tree of the selected layer in another, with files color-coded by whether they were added, modified, or removed.
Install it on macOS:
1brew install dive
On Debian or Ubuntu:
12345DIVE_VERSION=$(curl -sL \"https://api.github.com/repos/wagoodman/dive/releases/latest" \| grep '"tag_name":' | sed -E 's/.*"v([^"]+)".*/\1/')curl -fOL "https://github.com/wagoodman/dive/releases/download/v${DIVE_VERSION}/dive_${DIVE_VERSION}_linux_amd64.deb"sudo apt install ./dive_${DIVE_VERSION}_linux_amd64.deb
Or run it from a container without installing anything locally:
123docker run --rm -it \-v /var/run/docker.sock:/var/run/docker.sock \wagoodman/dive:latest nginx:alpine
Then point it at any image:
1dive nginx:alpine
The UI shows layers on the left, the file tree on the right, and an efficiency score at the bottom. That score is the percentage of bytes in the final image that aren't wasted by deletions or duplications in earlier layers. Dive's default fail threshold is 95%, and anything below that is worth investigating.
Dive also has a CI mode that fails a build when efficiency drops below a threshold:
1CI=true dive --lowestEfficiency=0.95 --highestUserWastedPercent=0.10 nginx:alpine
Drop that into a pipeline step and you'll catch image bloat regressions before they ship.
Common pitfalls
Deleted files don't actually leave the image. If a Dockerfile installs a secret, copies a key, or downloads a credential and then deletes it in the same or a later RUN step, the file is still in an earlier layer. The merged view from docker export shows it as gone, but docker save and dive surface it immediately. This is why any image that ever touched a secret should be considered compromised, even if the secret was "removed" in the next instruction. Rebuild from scratch with proper build-time secrets instead.
BuildKit images show <missing> in docker history. This is not a bug. BuildKit moves the CreatedBy history into the registry manifest, and the local Docker daemon can't reconstruct it for layers it didn't build. Use docker buildx imagetools inspect against the registry to get the full history for BuildKit-built images, but you need --format to actually surface the per-layer entries:
12docker buildx imagetools inspect nginx:alpine \--format '{{json .Image}}' | jq '."linux/amd64".history'
1234567891011[{"created": "2026-05-08T13:42:11.123456Z","created_by": "/bin/sh -c #(nop) ADD file:9d7c... in / "},{"created": "2026-05-08T13:42:14.789012Z","created_by": "ENV NGINX_VERSION=1.27.5","empty_layer": true}]
Without --format, the bare command only returns a multi-platform manifest summary, not the per-layer history. The index .Image "linux/amd64" step is needed because nginx:alpine is a multi-arch image; for a single-platform image, .Image.history works directly.
Layer sizes from docker history don't add up to docker images size. Layers shared with other images on your host count toward on-disk image size only once, but docker history reports each layer's logical contribution. Use docker image inspect --format '{{.Size}}' for the actual stored size.
docker export flattens, docker save doesn't. If you import the result of docker export back as an image, you've collapsed all layers into one. That's sometimes useful for shrinking an image, but you throw away the build cache and the audit trail along with it. For exact image transfers, use docker save and docker load.
Final thoughts
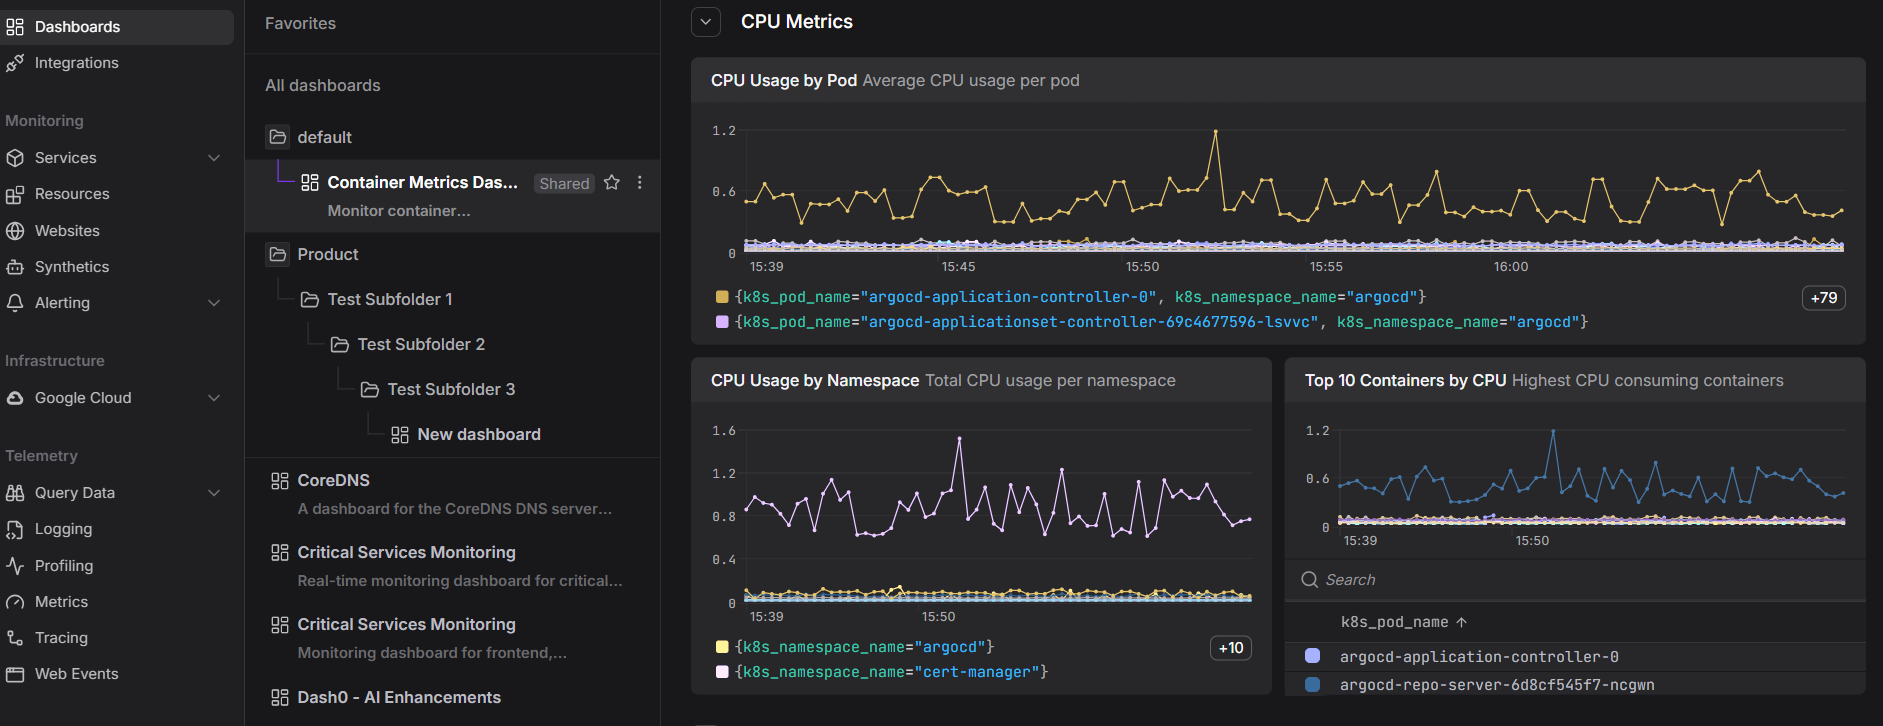
Inspecting an image is a one-time investigation. The harder question is what those images are doing once they're deployed: which containers are restarting, which ones are leaking memory, and which version is actually running where. A clean image audit doesn't help if a stale tag rolls out three weeks later.
Dash0's infrastructure monitoring tracks container resource metrics alongside real-time logs and distributed traces, all OpenTelemetry-native, so container metadata flows through to every signal without a proprietary translation layer. If you're auditing images today, you'll likely want to monitor what they're doing in production tomorrow.
 Start a free trial to see your container metrics, logs, and traces in one view. No credit card required.