Last updated: May 31, 2026
Live Insights
Surface active problems in your environment before you need to look for them.
Live Insights surfaces active problems in your environment before you need to look for them. The Agent0 landing page surfaces what is actively going wrong in your environment, refreshed every 60 seconds, grouped per service.
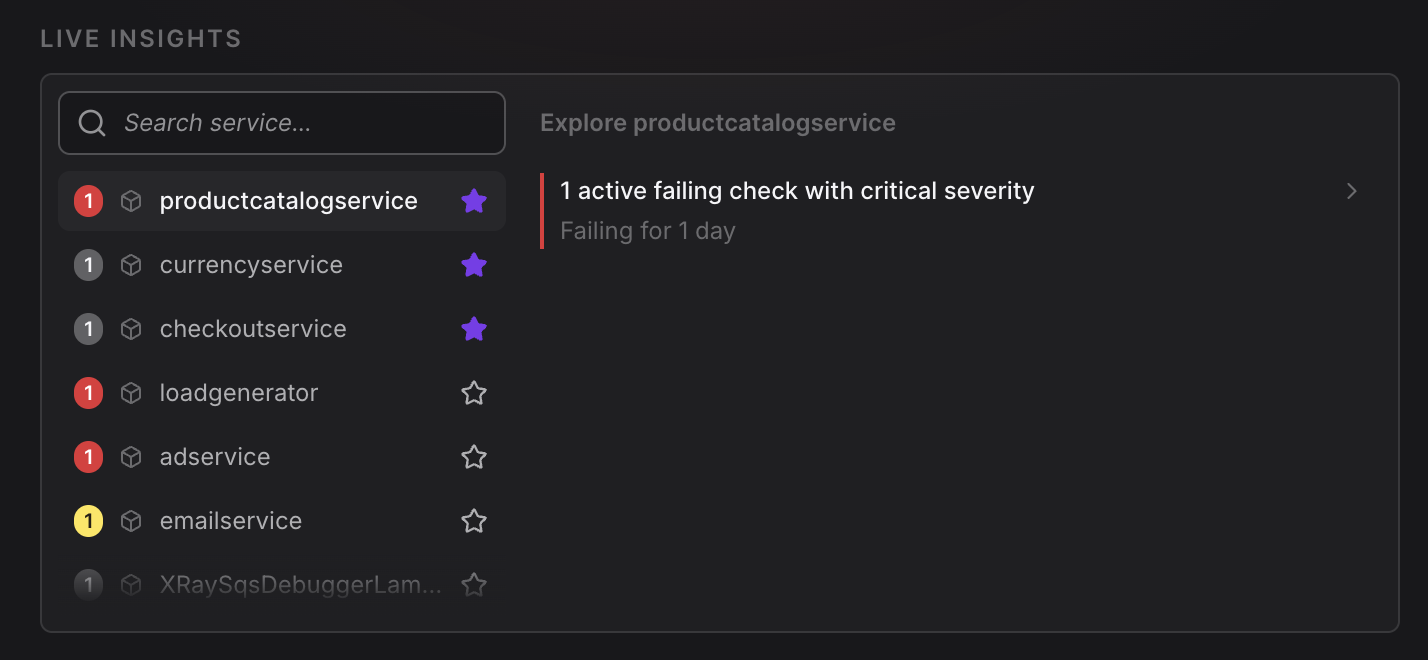
Each Live Insight entry includes the affected service, the signal that triggered it, a severity rating (critical / warning / info), and a template prompt for one-click investigation.
Signal categories
- Failing checks — services with active failing checks, ordered by severity.
- Elevated error rates — services whose error rate has spiked relative to their baseline.
- Elevated latency — services whose p95 latency has spiked relative to their baseline.
- Pod saturation — services with pods under memory or CPU pressure.
- Recent deployments — services deployed in the last 30 minutes, with a comparison prompt to check for regressions.
- Slow database calls — services with database operations that have gotten significantly slower.
- Services with issues but no alerts — services with elevated errors or latency that have no active alert coverage, with a prompt to generate calibrated check rules.
Severity bands
Severity is computed from the current value compared to a 24-hour baseline:
- Critical — at least 5× the baseline ratio, or absolute thresholds breached.
- Warning — at least 2× the baseline ratio.
- Info — below the warning threshold but worth surfacing.
One-click investigation
Each Live Insight entry comes with a template prompt scoped to the identified issue. Click it to start an investigation in Chat.
Further Reading
- About Exploring Agent0 — Overview of Agent0's capabilities
- Asset Creation — Create alerts from insights
- Integrated Experience — Access Agent0 from any page
- Investigation & Analysis — Perform multi-signal root cause analysis