Last updated: May 31, 2026
Investigation & Analysis
Agent0 reasons across your telemetry to answer questions, identify root causes, and produce grounded conclusions backed by live data.
Natural-language queries
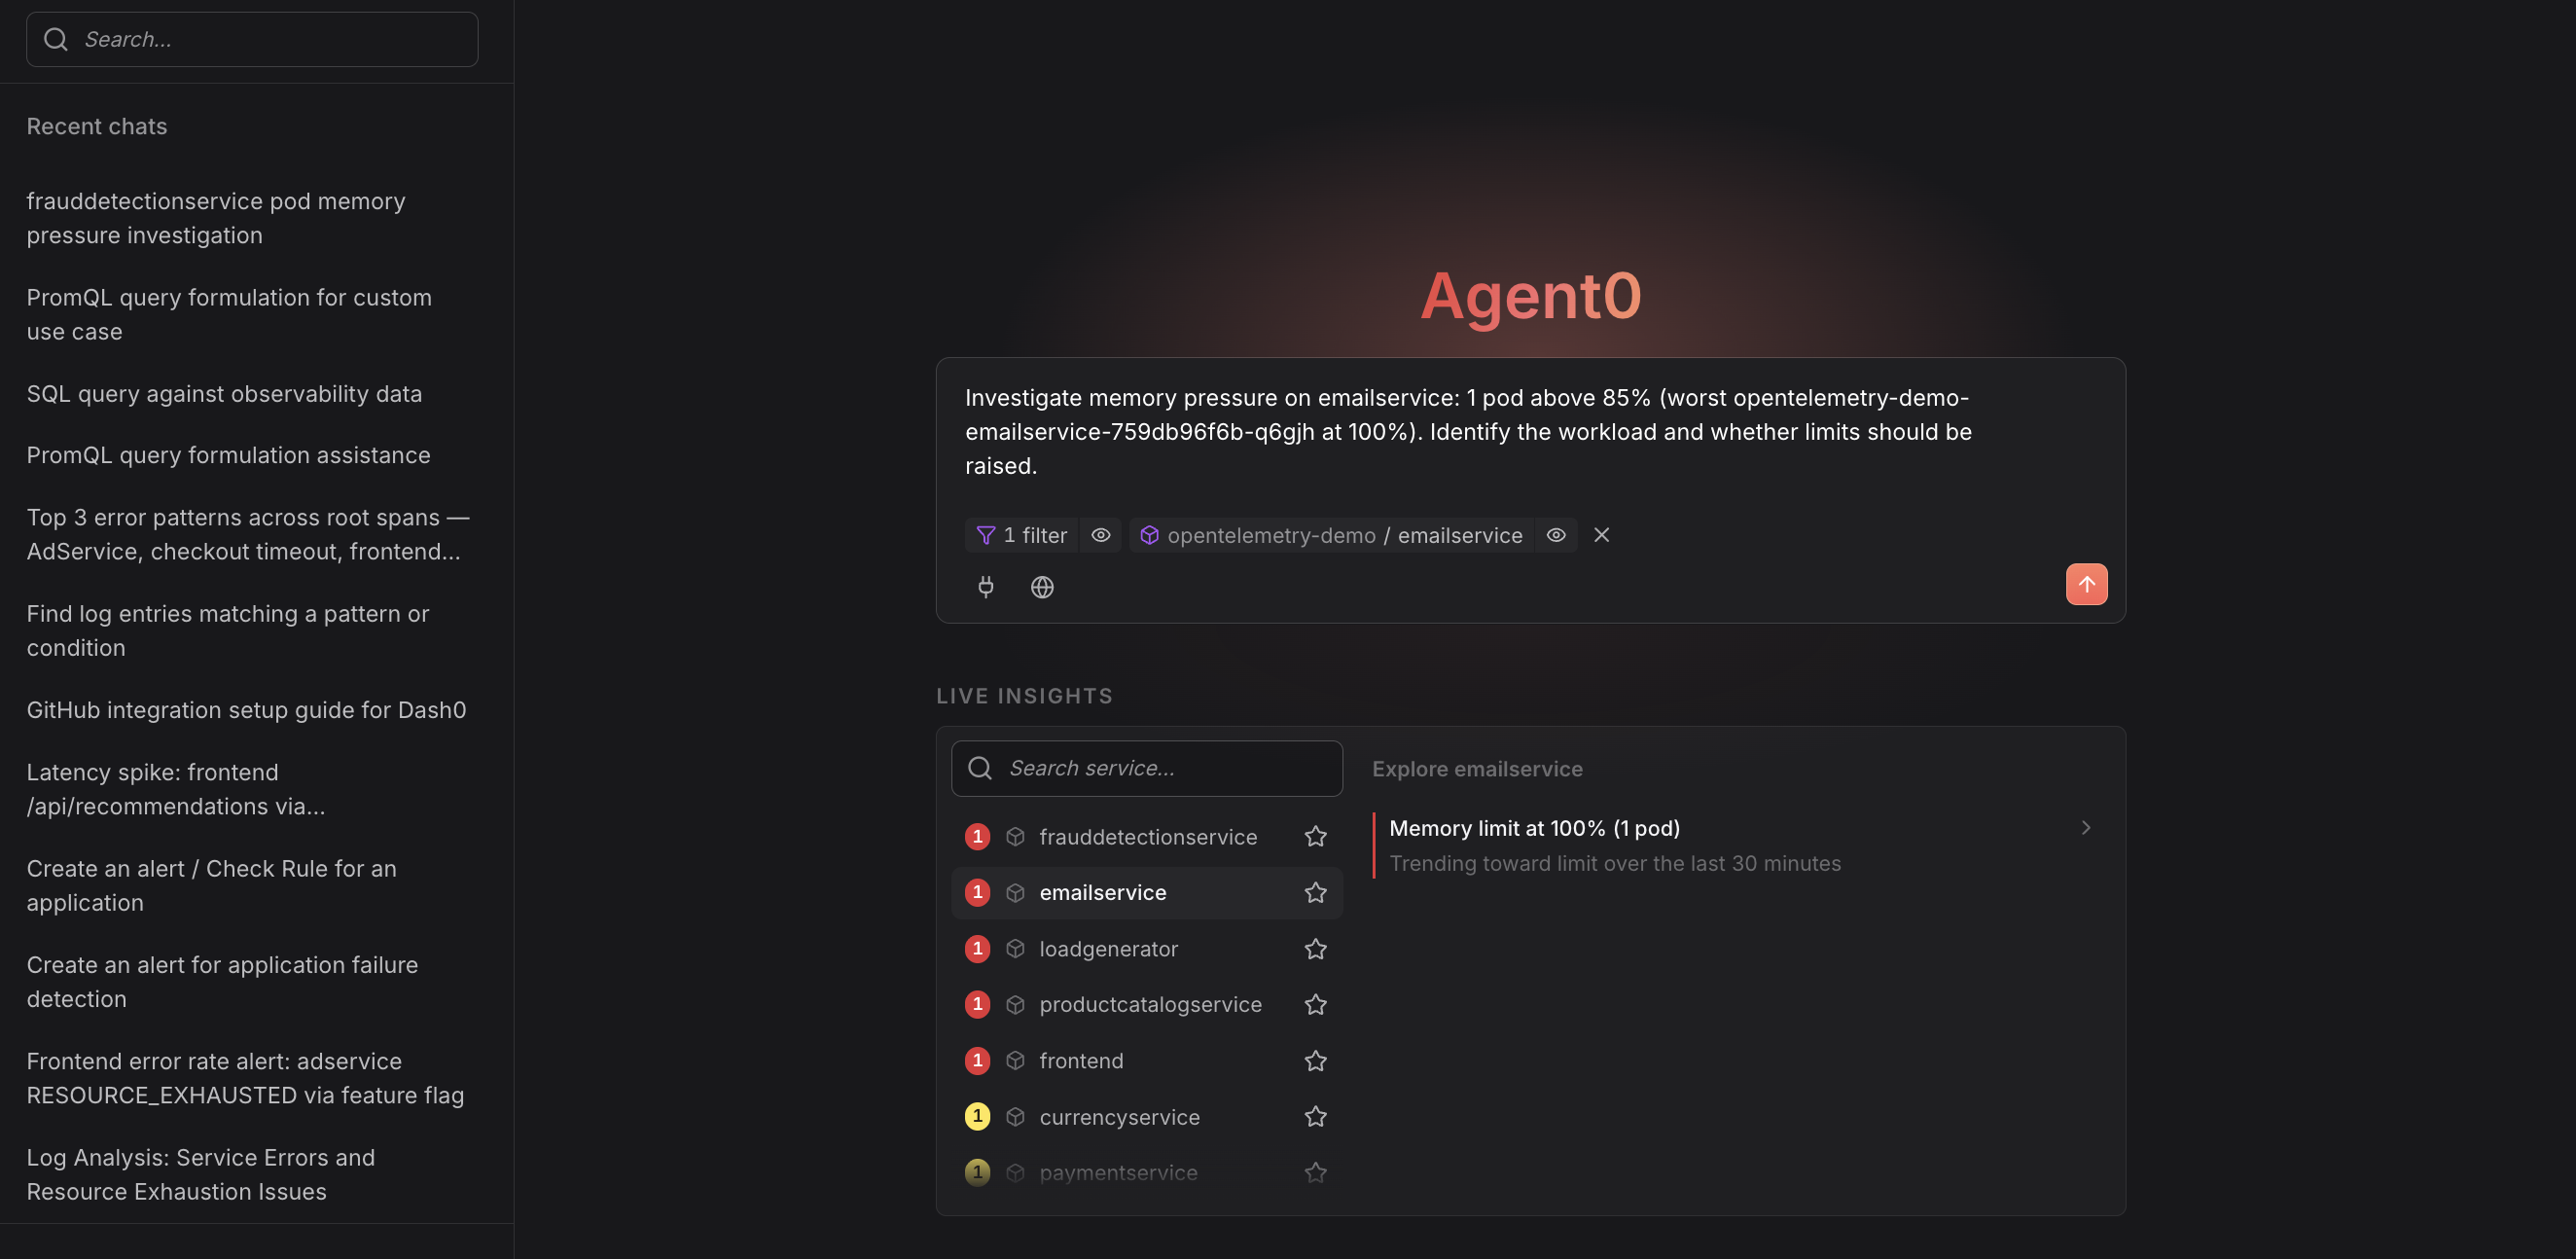
Ask Agent0 about anything in your environment: services, errors, latency, deployments, infrastructure state, code changes. Agent0 reasons across correlated logs, traces, metrics, and Kubernetes data and responds with grounded answers.
Examples:
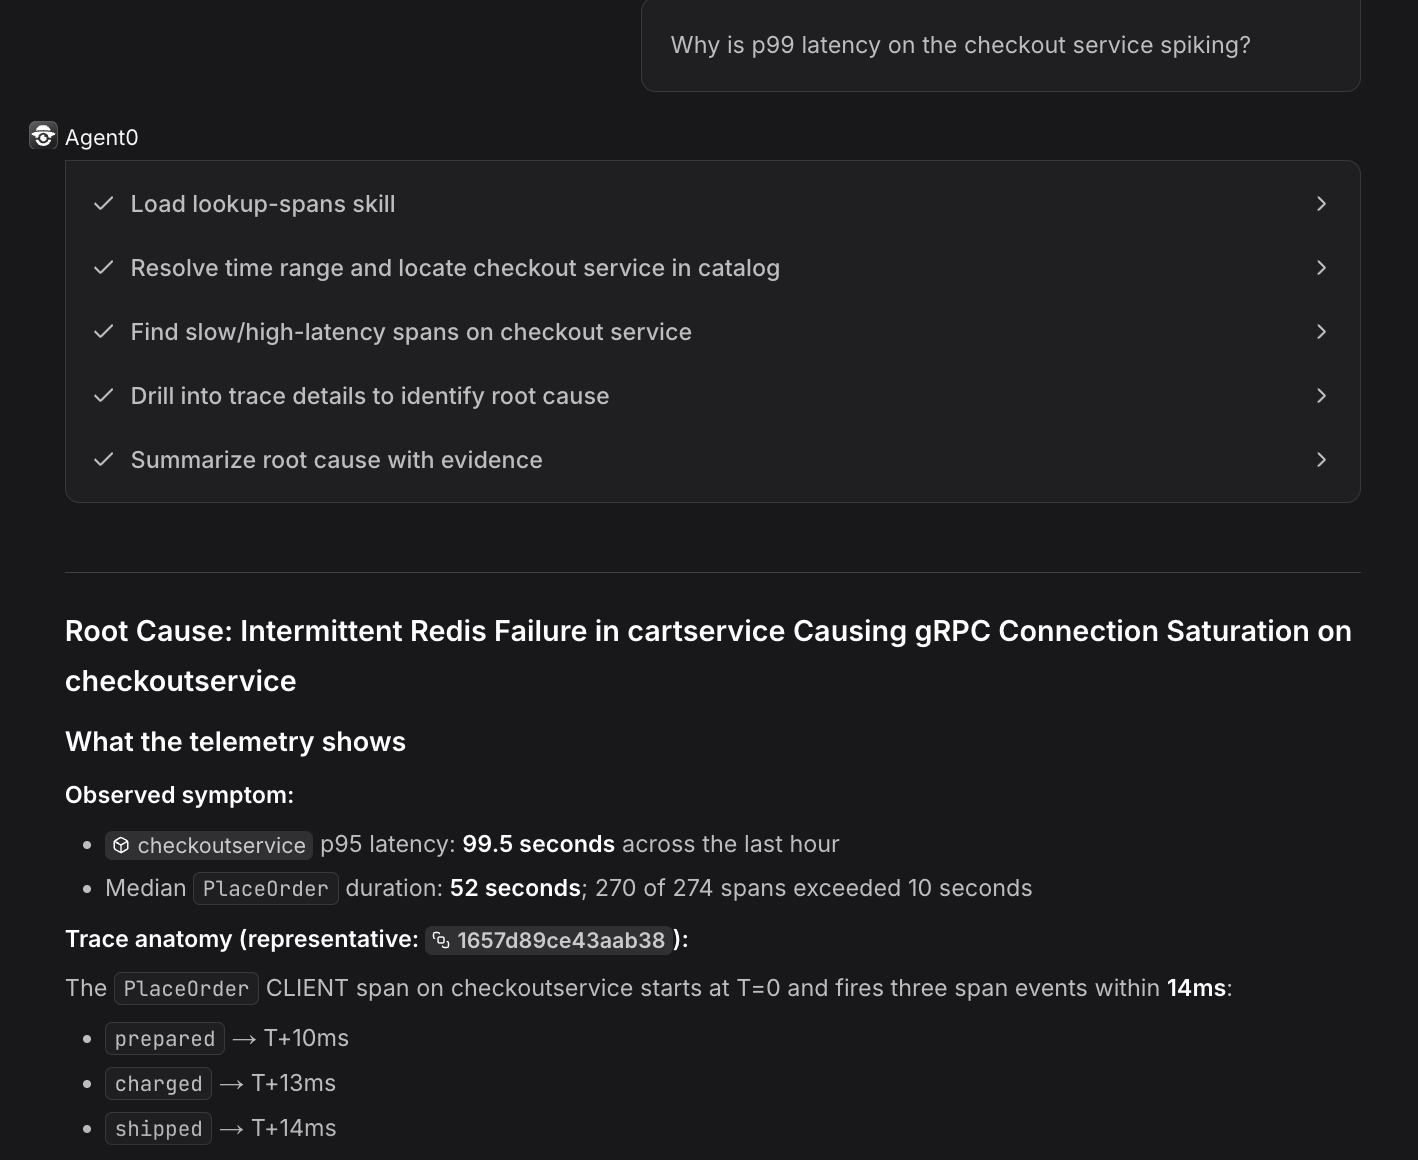
- "Why is p99 latency on the checkout service spiking?"
- "What changed in the last three deployments to auth?"
- "Which services consumed the most error budget this week?"
- "Show me errors in the orders service from the last hour."
Multi-signal root cause analysis
When Agent0 investigates an issue, it correlates across signal types: logs, traces, metrics, deployment events, infrastructure state. It forms hypotheses, tests them against live telemetry, and produces a hypothesis tree showing what it tested and why it reached its conclusions.
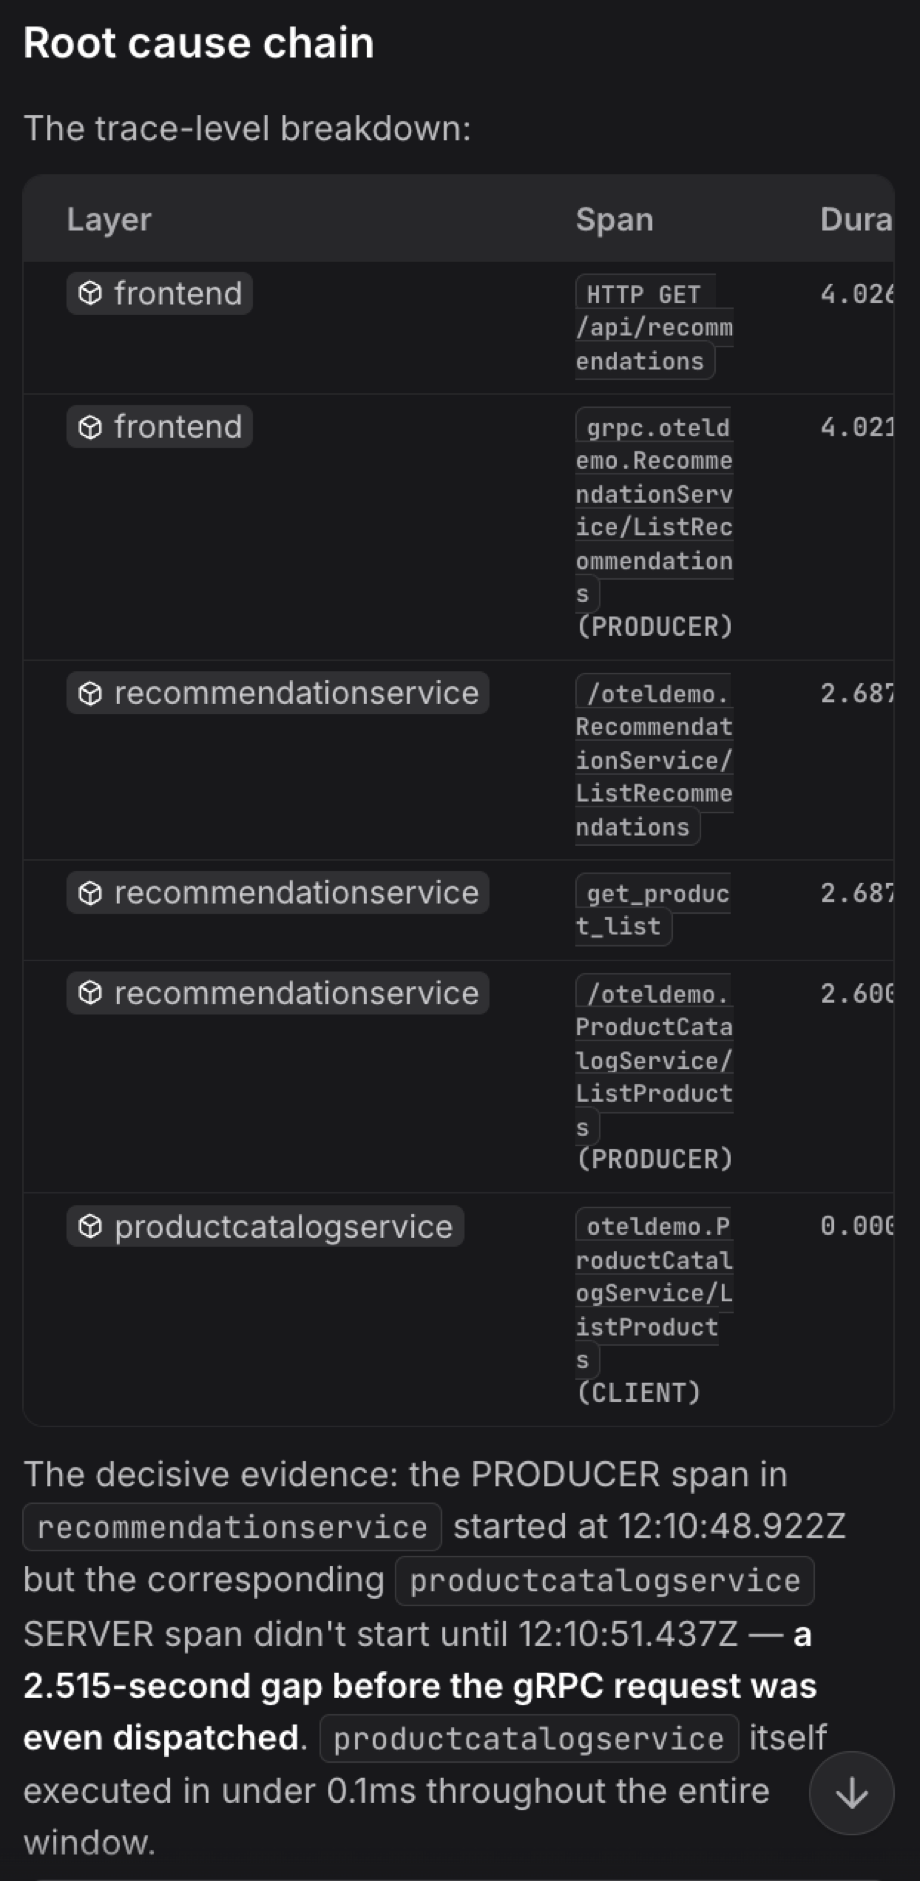
When the root cause traces back to code, Agent0 reads the relevant repository via the GitHub connector and identifies the specific function, method, or configuration responsible.
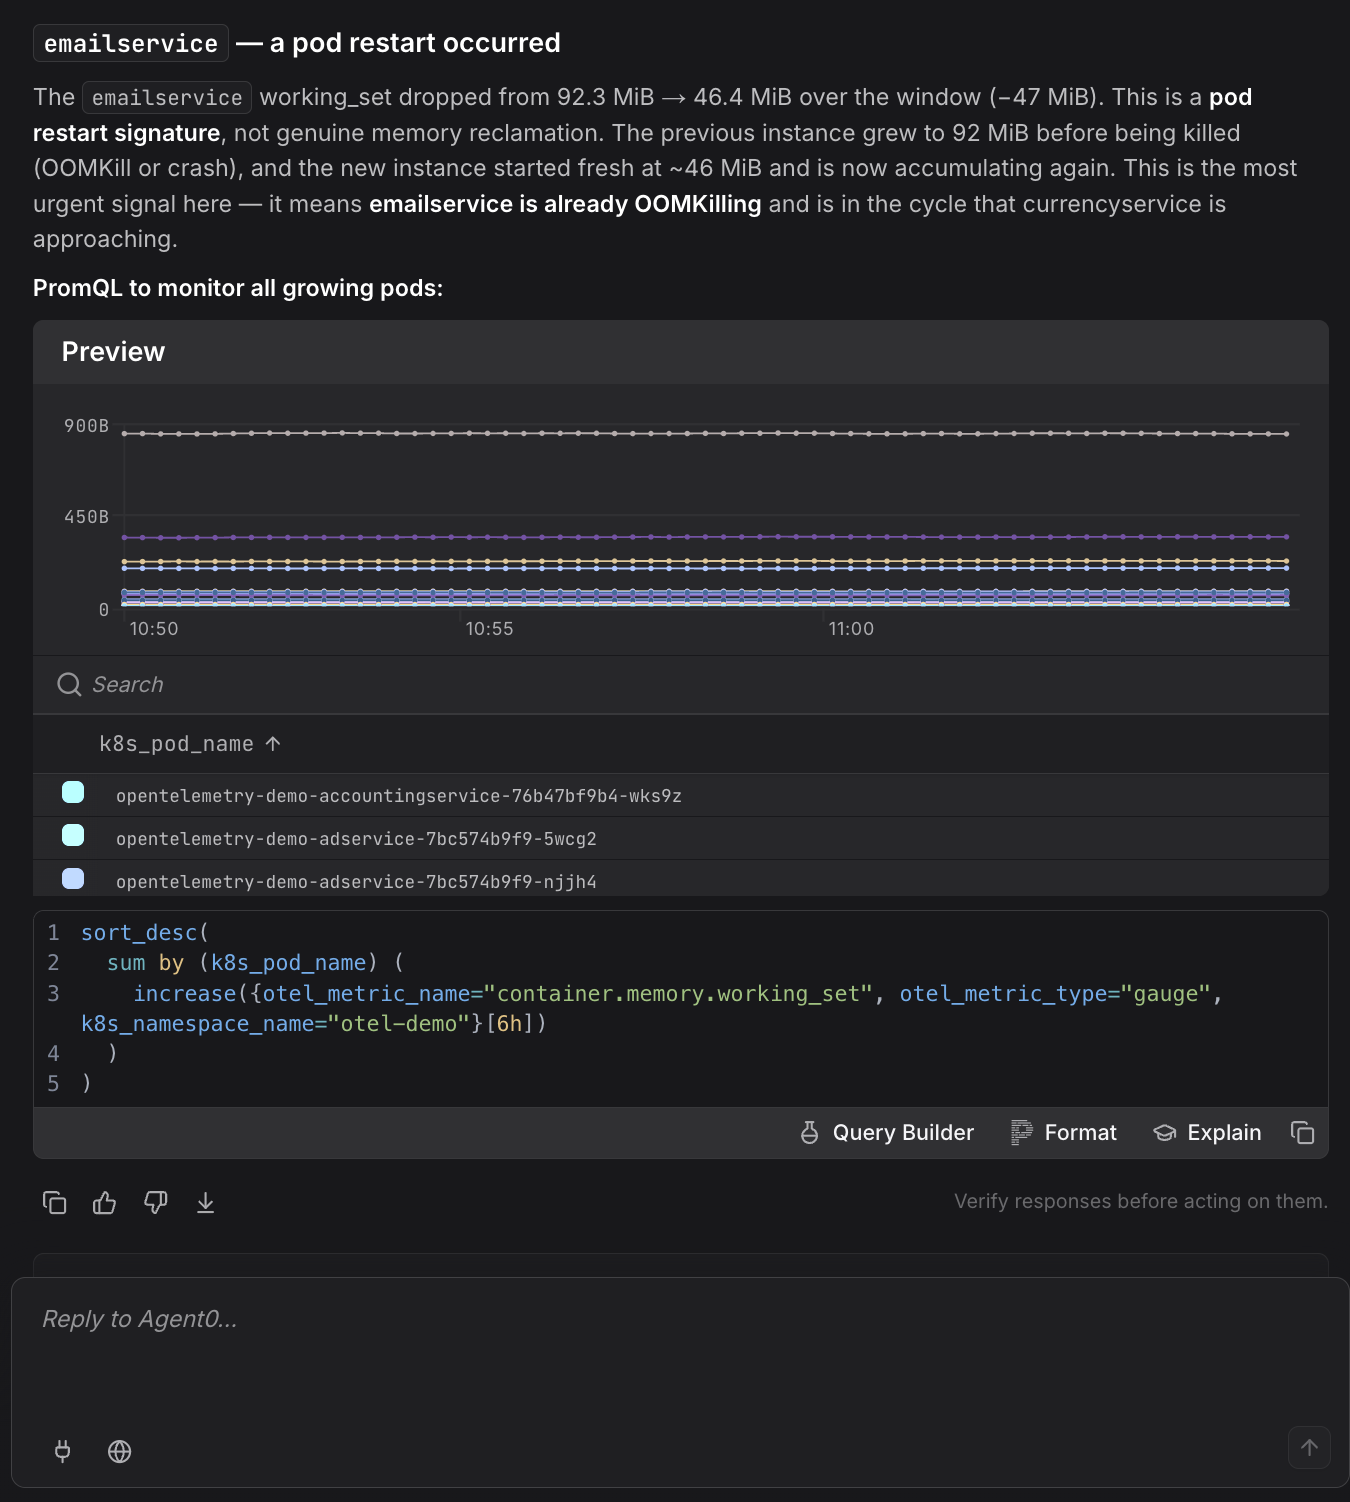
Charts and visualizations in responses
When Agent0's answer benefits from a visual — a time series, a histogram, a service-by-service breakdown — it renders the chart directly in the response rather than referring you to another page.
Further Reading
- About Exploring Agent0 — Overview of Agent0's capabilities
- Asset Creation — Turn findings into alerts, dashboards, and PRs
- Integrated Experience — Context-aware prompts throughout Dash0
- Live Insights — Surface active problems automatically
- Tools and Connectors — Query databases and integrate external systems