

From Noise to Signal: How Uptic Engineered a Repeatable Observability Practice with Dash0

Uptic needed a repeatable way to deliver observability across client environments, close the ownership gap between development and operations, and avoid spending too much specialist engineering time maintaining Prometheus, Loki, and Grafana.
Dash0 gave Uptic an OpenTelemetry-native backend for its observability practice, with Agent0 and MCP helping turn telemetry into intelligence, and filtering and cost controls helping teams manage noise and spend.
Uptic can now standardize observability across customer deployments, reduce operational overhead, improve developer adoption, support stronger feedback loops before production, and control telemetry cost without sacrificing signal quality.
Uptic is a full-stack product development and platform engineering firm with teams in Chicago, Leeds, and Amsterdam. The company helps software-driven businesses build, ship, and operate modern applications, while giving developers more time to focus on rapid feature development and bug fixes.
For Matt Keenan, VP of Marketing and Co-Founder at Uptic, observability has always been more than monitoring. Before co-founding Uptic, he spent 13 years in the observability space at Dynatrace, experience that shaped how Uptic thinks about building reliable software.
Across many mid-market environments, Uptic sees the same problem: observability tooling exists, but nobody truly owns it. It often sits between development and operations, touched by a few people but rarely driven as a proper engineering discipline. The result is Observability tools are purchased but rarely deliver anywhere near their expected value.
At Uptic, observability is now a core part of the company’s AI Development Lifecycle, or AI-DLC. As AI-assisted development becomes more common, Uptic sees observability as a critical layer for understanding what is happening across increasingly complex customer environments.
That also matters to Uptic’s AWS Partner motion. As teams build more AI-enabled applications with services like AWS Bedrock and Kiro, getting the observability foundation right helps customers move faster and gives teams more confidence in what they are shipping.
This is how Uptic standardized on Dash0 to build a repeatable, OpenTelemetry-native observability practice across client deployments.
The Challenge: Too Much Time Maintaining the Stack
Before Dash0, Uptic worked with different observability setups depending on the customer environment. In smaller deployments, that often meant a mix of CheckMK and self-managed open source tooling, including Prometheus, Loki, and Grafana.
The stack worked, but it required too much ongoing maintenance.
“Instrumenting, configuring, and maintaining Prometheus, Loki, Grafana across multiple client environments requires ongoing specialist engineering depth,” Matt says. “That’s time and people that should be focused on delivering value for clients.”
As Uptic scaled many of its customer’s environments in the cloud, the challenge became harder to ignore. Frequent releases, microservices, Kubernetes, and AI-driven workloads all created more telemetry volume and more cardinality.
Uptic also needed observability to support developers earlier in the lifecycle. As a developer-led organization, the team wanted better feedback loops before release, stronger quality gates, and a way for developers to work with telemetry without depending only on platform specialists.
Uptic needed one observability standard that could scale across customer deployments without becoming another platform burden.
The Solution: OpenTelemetry as the Foundation, Dash0 as the Backend
Uptic’s move toward standardization started with OpenTelemetry. It gave Uptic a consistent instrumentation standard across customer environments and allowed clients to own their telemetry pipeline instead of being tied to proprietary agents or vendor-specific data models.
That open standards approach also aligns with how Uptic supports customers across cloud environments, partner-led deployments, and the AWS ecosystem. AWS’s own Distro for OpenTelemetry, ADOT, reinforced Uptic’s view that OpenTelemetry had become the right foundation for modern observability.
But OpenTelemetry still needed the right backend.
OTel was the foundation we were looking for and Dash0 was the backend that made it the obvious choice.
For Uptic, not all OpenTelemetry support is equal. Some vendors accept OTel at the collection layer, but still route telemetry into proprietary backends and data models. In those cases, the lock-in does not disappear. It simply moves to another layer. The real test is whether OpenTelemetry is the core architecture, or just the on-ramp.
Dash0 stood out because it was built natively on OpenTelemetry, not retrofitted to support it. For Uptic, that meant the team could keep the flexibility and ownership of OTel, while adding the backend layer needed to make telemetry actionable: querying, correlation, Agent0, MCP, filtering, and cost controls.
“OTel gives us a single consistent instrumentation standard,” Matt says. “Dash0 turns that telemetry into something actionable.”
For Uptic, that combination made Dash0 more than another observability tool. It became the foundation for a repeatable practice across client deployments.
The Impact: Turning Telemetry Into Intelligence
Uptic was not looking for more telemetry. It needed a way to turn telemetry into intelligence that engineers could use across customer deployments.
“We don’t need more metrics, traces, and logs,” Matt says. “We need intelligence.”
That is where Agent0 fits into Uptic’s practice. Instead of asking engineers to start every investigation from a blank query, Agent0 helps surface relevant context and suggest investigation paths. For developers, it also makes telemetry more approachable by allowing them to ask questions in plain language instead of learning query syntax from scratch.
MCP extends that value into Uptic’s AI-DLC workflow by connecting observability to AI-assisted investigation. For Uptic, that means Dash0 is not just where telemetry is stored. It becomes part of how teams investigate, understand, and improve software.
Dash0’s MCP capability is what makes that intelligent investigation layer real rather than theoretical.
It also helps Uptic bring observability closer to development. Developers can use telemetry earlier in the lifecycle, improve feedback loops before release, and make observability part of how software quality is managed, not just how incidents are investigated. That adoption is deep: “Dash0 is approachable enough that developers engage with it directly,” Matt says, “with developers now nearly as active in Dash0 as the dedicated platform team.”
Results: Less Maintenance, Better Signal, Lower Cost
For Uptic, the result is a more scalable observability practice: less time maintaining infrastructure, more time using observability to deliver value for clients.
In complex customer environments, that matters. Telemetry volume can grow quickly, and keeping everything by default creates both cost and noise. Uptic uses Dash0’s filtering and drop rules to decide what to keep and what to discard based on operational value.
“The filtering and drop rule capabilities let us make principled decisions about what to keep and what to discard,” Matt says.
The cost impact is significant, especially when customers move from legacy environments into cloud-native architectures.
In one client environment, Ray Allen had used New Relic’s free tier, but the combination of pricing and lengthy contract commitments made a paid plan difficult to justify. At the same time, the team was running LeanSentry for IIS monitoring in its legacy environment.
With Dash0, Ray Allen’s full observability spend for its new cloud-native environment is now lower than what it was paying for the legacy monitoring tool it is in the process of deprecating.
“The by-product of tuning out the noise is almost always cost reduction,” Matt says. “And the by-product of cost reduction is almost always better signal quality. They’re two sides of the same coin.”
The bigger story is not just the lower bill. It is that Uptic can apply the same practice across customer deployments: control the signal, reduce waste, and make observability more useful for the teams relying on it.
Built for the AWS Ecosystem
As an AWS Partner, Uptic needed an observability layer that aligned with where AWS itself is heading. For Matt, that alignment was decisive.
“We’re an AWS Partner, and the direction of travel is clear: OpenTelemetry is becoming the standard. AWS’s own Distro for OpenTelemetry, ADOT, is a signal in itself. When your cloud provider maintains and distributes their own OTel build, the debate about whether OTel is the standard is largely over.”
Because Dash0 is OTel-native, it fits that direction in a way legacy vendors cannot. Three things make Dash0 a practical fit for AWS clients:
-
Portable instrumentation. You own your telemetry pipeline. Instrument once against OTel and that work travels with you, outliving any single vendor contract.
-
Correlation across infrastructure and AI. OpenTelemetry’s framework and semantics correlate telemetry from AWS services like EKS, EC2, and RDS in one view alongside agent metrics like latency per agent, model behavior, and regional execution patterns.
-
Frictionless procurement. Dash0 is available on AWS Marketplace, so customers can buy through existing AWS agreements and spend commitments.
For Uptic, the AWS angle is not separate from the observability story. Helping clients unblock their AI-DLC also supports greater adoption of AWS services such as Bedrock and Kiro, because teams can move faster when the observability foundation is already in place.
From Tooling Choice to Repeatable Practice
With Dash0, Uptic spends less time maintaining observability infrastructure and more time using observability to deliver value for clients.
That shift is what makes Dash0 more than another tool in the stack. For Uptic, it is the foundation for a repeatable observability practice across customer deployments.
Uptic can standardize on OpenTelemetry, give developers a more approachable way to work with telemetry, bring Agent0 and MCP into AI-assisted investigation workflows, support feedback loops before production, and use filtering and cost controls to keep signal quality high.
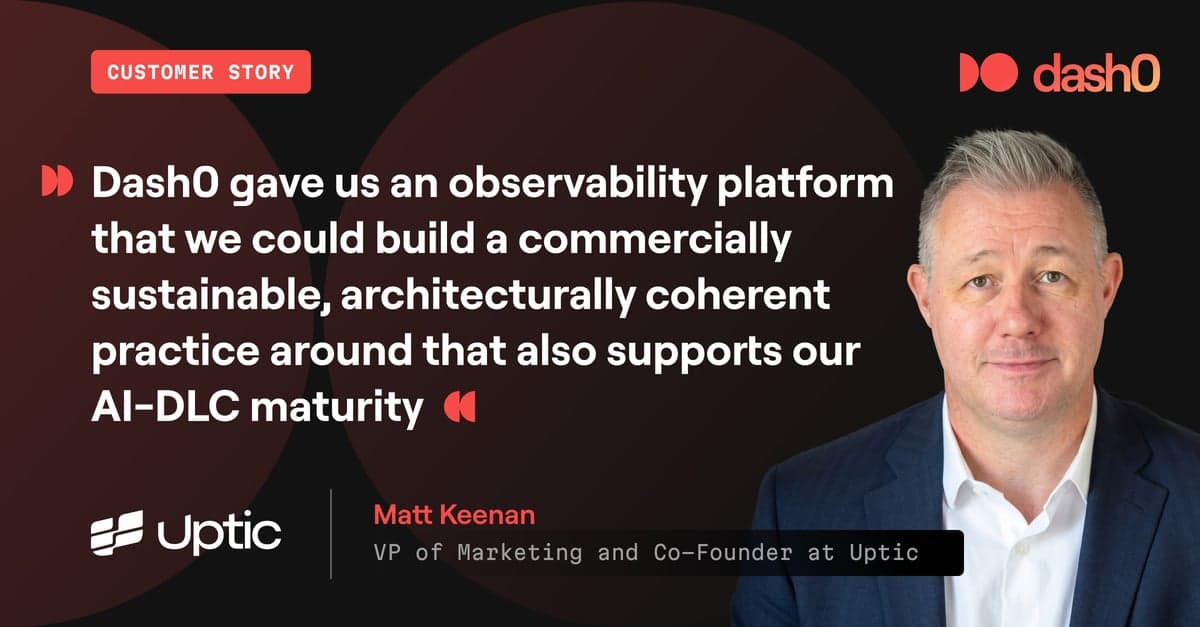
Dash0 gave us an observability platform that we could build a commercially sustainable, architecturally coherent practice around that also supports our AI-DLC maturity.
Keep a copy for your records or read it offline
Download PDFKeep a copy for your records or read it offline
Download PDF- Share
Ready to build your observability practice on open standards?
See how Dash0 helps teams reduce noise, control cost, and turn telemetry into intelligence without the overhead of self-managing the stack.



