
Almost every article comparing Prometheus and Grafana opens with the same premise: they're complementary, not competitors. Then the author spends 3,000 words comparing them in a feature table anyway. You've probably read a few of those already.
But here's the thing: Prometheus and Grafana aren't alternatives. Prometheus collects and stores metrics while Grafana visualizes them, and you'll almost certainly run both. The more useful question, and the one most articles skip, is what this architecture actually looks like once you're past the getting-started tutorial: how the stack grows, where each tool's limits show up, and when the combination stops being the right fit.
So this article isn't about which one you should pick. It's about what the Prometheus-plus-Grafana architecture actually looks like at scale, where it breaks, and when it makes sense to reconsider the whole approach.
The 60-second version
If you're here for a quick summary:
-
"I need to collect and store metrics" → Prometheus. It scrapes targets over HTTP, stores time series in its built-in TSDB, and evaluates alert rules on a schedule. It's the default metrics backend for Kubernetes environments and has deep CNCF ecosystem support.
-
"I need to visualize metrics" → Grafana. It connects to data sources like Prometheus and renders dashboards. It doesn't collect or store data itself, but it can pull from over 100 backends into a single dashboard.
-
"Do I need both?" → Yes, and you'll likely need more. Alertmanager for notification routing, Loki for logs, Thanos or Mimir for long-term metric retention, Jaeger or Tempo for tracing and a proper telemetry pipeline. You'll need to budget resources and time for operating all of it.
-
"I'm standardizing on OpenTelemetry" → The calculus changes when you're adopting the OpenTelemetry Protocol (OTLP) is your instrumentation standard for unified observability across logs, metrics, and traces.
What Prometheus actually does
Prometheus is three systems in one binary: a scraping engine, a time-series database (TSDB), and an alerting evaluation engine. It was built at SoundCloud around 2012, donated to the CNCF in 2016, and has since become the default metrics backend for Kubernetes environments.
The core mechanic is pull-based scraping. You configure targets, or let
Prometheus discover them automatically through service discovery, and it hits
their /metrics HTTP endpoints on a schedule. A typical scrape config for a
Kubernetes service looks like this:
1234567891011121314scrape_configs:- job_name: "my-api"kubernetes_sd_configs:- role: podrelabel_configs:- source_labels:- __meta_kubernetes_pod_annotation_prometheus_io_scrapeaction: keepregex: true- source_labels:- __meta_kubernetes_pod_annotation_prometheus_io_pathaction: replacetarget_label: __metrics_path__regex: (.+)
New pods annotated with prometheus.io/scrape: "true" get picked up
automatically, which saves a lot of manual toil for platform teams running
dozens of services across multiple namespaces.
Where Prometheus gets interesting is PromQL, its query language. It's one of the more expressive query languages in observability, and if you're doing metrics work seriously, you'll need to learn it whether you planned to or not. Here's a p99 latency calculation over a 5-minute window:
1234histogram_quantile(0.99,sum(rate(http_request_duration_seconds_bucket[5m])) by (le))
That's a common query, but it's not a cheap one. On a high-traffic service,
http_request_duration_seconds_bucket can have dozens of le
(less-than-or-equal) buckets per label combination. If this query runs every
time someone loads a dashboard, it puts noticeable load on Prometheus. The
standard fix is a recording rule that pre-computes the result:
1234567891011groups:- name: latency_rulesrules:- record: job:http_request_duration_seconds:p99_5mexpr: |histogram_quantile(0.99,sum(rate(http_request_duration_seconds_bucket[5m])) by (le, job))
This runs on a schedule and stores the result as a new time series, so your dashboard queries hit the pre-computed series instead of crunching raw histogram buckets on every page load.
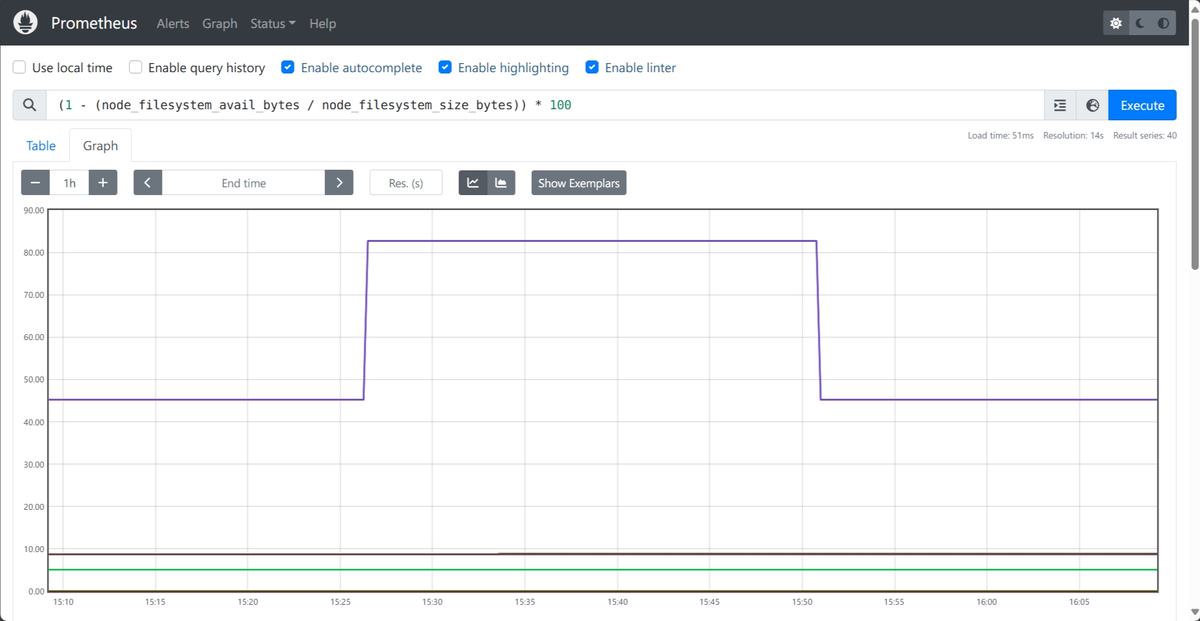
Prometheus also ships its own expression browser at localhost:9090, which
works for ad-hoc queries but is bare-bones: a text input, a graph panel, and not
much else. Nobody uses this as their production monitoring interface. For that,
you need a visualization layer, which is where Grafana enters the picture.
What Grafana actually does
"Grafana" can refer to two different things depending on context. Grafana the open-source project is a visualization tool, while Grafana Labs the company builds and maintains that tool, but also develops a full observability stack: Loki for logs, Tempo for traces, Mimir for long-term metrics storage, Alloy as a telemetry collector, and Grafana Cloud as a managed platform that bundles all of it.
When people say they use Grafana, they sometimes mean the dashboard tool and sometimes mean the entire Grafana Labs ecosystem, usually referred to as the LGTM stack. This article is about the standalone metric visualization tool.
Grafana doesn't scrape metrics, doesn't store time series, and doesn't evaluate alert rules against raw data, with one exception we'll get to. What it does is connect to backends and render their data as dashboards.
The data source model is Grafana's core abstraction. You configure a connection to Prometheus, and Grafana sends PromQL queries to it and renders the results as panels. But you can also connect Elasticsearch, InfluxDB, PostgreSQL, Loki, and many other backends in the same Grafana instance. A single dashboard can combine Prometheus metrics in one panel with Loki log counts in another and PostgreSQL connection pool stats in a third.
That multi-source capability is what most teams actually use Grafana for. When you're debugging an incident and want error rates, log patterns, and database latency on the same screen, Grafana is the tool that makes that possible without switching between five browser tabs.
The exception is Grafana's own alerting system. Unified alerting, introduced in Grafana 9, lets you write alert rules that query any connected data source directly from within Grafana, which means you can define alerts against Loki logs, Prometheus metrics, and even SQL databases in one place with a single notification routing policy.
For pure metrics-based alerting, though, most teams stick withPrometheus Alertmanager since alert rules defined in Prometheus YAML live in version control, and evaluation also runs in-process inside Prometheus rather than over a network hop to Grafana, which means your alerts don't stop firing because of a connectivity blip between the two.
The stack nobody planned to build
Every Prometheus-plus-Grafana deployment starts simple. Two containers, a scrape config, a couple of dashboards. It works, it's fast, and you feel good about your monitoring setup. But that feeling has a shelf life.
You need logs, because metrics tell you something is broken but not why, so you add Loki. Traces come next, because distributed call chains across 30 microservices aren't debuggable from logs alone, and that means Tempo or Jaeger.
Then the VP of engineering wants to compare this quarter's latency to last quarter's, which means more than 15 days of retention, necessitating Thanos or Mimir with an object storage backend.
Alert routing that doesn't wake up the wrong team at 3am requires Alertmanager with a routing tree. And once you want to filter, transform, and route telemetry before it hits storage, you're adding the OpenTelemetry Collector or Grafana Alloy.
The architecture that started as two boxes now looks like this:
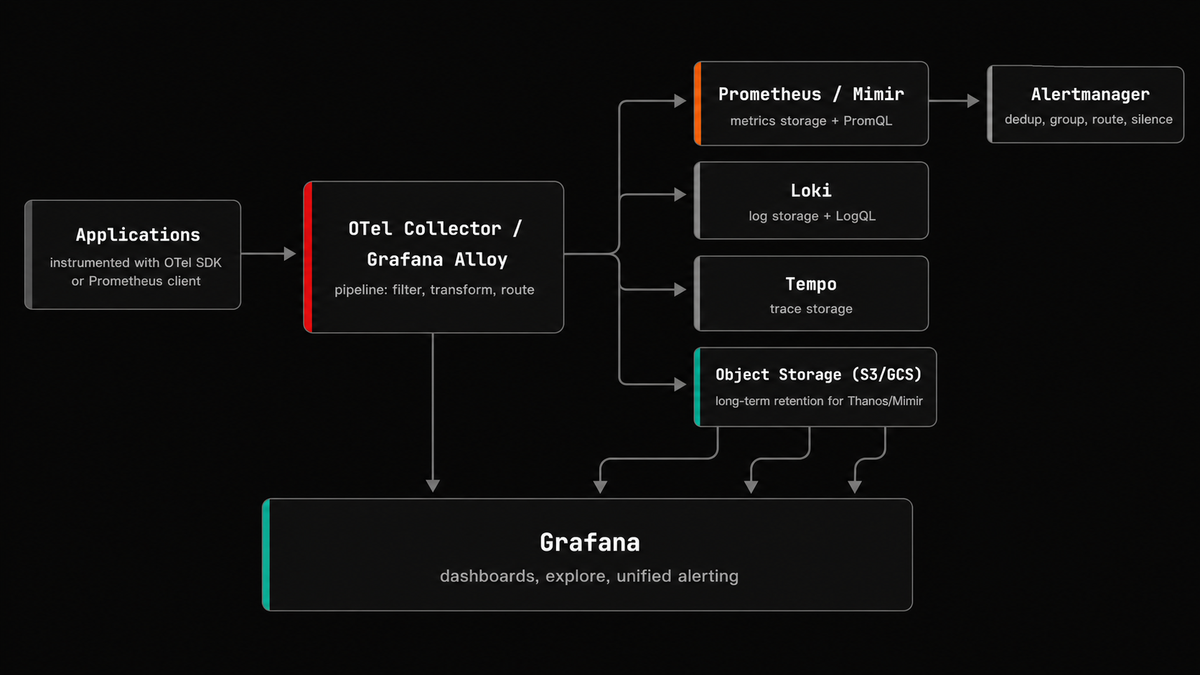
That's six or seven components, each with its own configuration format, its own scaling characteristics, and its own failure modes. They're all solid tools individually, but operating them together is a different kind of problem.
Grafana Labs' own 2025 Observability Survey found that 39% of engineering teams cite complexity and operational overhead as their number one observability obstacle. Teams reported juggling an average of eight different observability tools, and alert fatigue was the top barrier to faster incident response, outpacing the next closest challenge by nearly 2
.Hitting the cardinality wall
Prometheus has a fundamental scaling constraint, and teams hit it faster than they expect: cardinality.
Every unique combination of metric name and label values creates a distinct time series, and the math is multiplicative. Take a common counter:
1http_requests_total{method, path, status, pod}
With 4 HTTP methods, 50 API paths, 5 status code classes, and 20 pods, you've got:
14 × 50 × 5 × 20 = 20,000 series
That's completely fine. Prometheus can handle 20,000 series without breaking a
sweat. Now a well-meaning developer adds a customer_id label to debug a
per-tenant issue:
14 × 50 × 5 × 20 × 10,000 customers = 200,000,000 series
Your Prometheus instance is now dead or dying. It ran out of memory because every active series lives in the TSDB head block in RAM, and there's no graceful degradation. In Kubernetes the pod restarts, and depending on your write-ahead log (WAL) configuration, you may lose recent data.
A healthy mid-sized Prometheus sits somewhere between 100,000 and 2 million active series. Once you're past 5 million, you're actively managing a cardinality problem. You can diagnose it with this PromQL query:
1sort_desc(count by (__name__) ({__name__=~".+"}))
Fair warning: this query is expensive in its own right. Run it during off-peak hours, because on a large instance it can cause the very performance problems you're trying to diagnose.
The fixes are all trade-offs. You can drop labels with metric_relabel_configs,
but that means losing query dimensions. You can shard across multiple Prometheus
instances with federation, but now you need a global query layer.
You can move to a scalable Prometheus- compatible backend for horizontal scaling and long-term storage: Thanos and Mimir are the most common choices in the CNCF ecosystem, and VictoriaMetrics is another widely used option in this space.
Each of these works, but each one also moves you further from the simplicity that made Prometheus attractive in the first place.
The OpenTelemetry shift
Both Prometheus and Grafana predate OpenTelemetry as a serious standard, and both are adapting to it with varying degrees of friction.
Prometheus 3.0 added a native OTLP receiver, enabled through the
--web.enable-otlp-receiver flag. Once enabled, you can push OTLP metrics
directly to a Prometheus instance at /api/v1/otlp/v1/metrics without routing
through a Collector first. The endpoint only speaks HTTP/protobuf rather than
gRPC, but that's a minor constraint most teams work around easily enough.
The more consequential limitation is how Prometheus handles delta temporality. OTel SDKs can emit metrics as either cumulative (the counter tracks the total since process start) or delta (each export contains only the change since the last export). Prometheus only understands cumulative, so when delta metrics arrive at the OTLP endpoint, they're silently dropped.
The bigger problem is the fundamental data model mismatch. OTel metrics have
three distinct attribute layers: resource attributes (like service.name),
scope attributes (like the instrumentation library version), and datapoint
attributes. Prometheus flattens all of this into labels. Resource attributes are
dropped by default and must be explicitly promoted through configuration:
12345otlp:promote_resource_attributes:- service.name- service.version- deployment.environment.name
There are also naming issues. OTel allows dots and dashes in metric names
(http.server.request.duration) while Prometheus historically only supported
underscores and alphanumeric characters. Prometheus 3.0 added UTF-8 support, but
this results in
four different translation strategies
to choose from, each with its own trade-offs around suffix handling and
collision risk.
Since Grafana is a visualization tool, it doesn't need to understand OTLP directly. Even in Grafana Cloud, when you send OTLP data to the managed endpoint, it gets split behind the scenes: metrics go to Mimir, logs go to Loki, traces go to Tempo. Grafana then queries each backend separately using its native query language (PromQL, LogQL, TraceQL). Either way, you're running a multi-backend architecture. The difference is whether you operate those backends yourself or Grafana Labs operates them for you.
On the collection side, Alloy (the successor to Grafana Agent) supports OTLP, but its pipeline configuration uses a custom syntax called River, not the standard OTel Collector YAML. If you later want to switch to a different backend, you're rewriting your pipeline configs, not just changing an exporter endpoint. The defaults also steer you toward Grafana's own backends, which creates a soft lock-in that's easy to miss during initial setup.
When to use what
The Prometheus + Grafana stack is a strong fit when your metric volume is moderate (under a couple million active series) and your team has the platform engineering bandwidth to operate it. Prometheus has particularly deep integration with Kubernetes through service discovery, but it works equally well with static targets, Consul, or EC2 discovery. There are pre-built Grafana dashboards for almost everything, and PromQL, once you learn it, is expressive enough to justify the investment.
But metrics are only one piece of the picture. Modern distributed systems generate traces, logs, and metrics, and debugging production incidents increasingly requires correlating across all three. If your error rate spikes, you need to go from the metric to the specific traces that caused it to the log lines that explain why. That correlation is where single-signal tools run into trouble.
Prometheus and Grafana don't give you that visibility on their own, so you end up adding more tools to cover traces and logs. Once you do, you'll quickly run into the fact that correlating across those tools means stitching together backends that were never designed to share a data model. A metric label in Prometheus, a trace attribute in your tracing backend, and a structured log field don't automatically line up. Making them line up is a maintenance burden that grows with every team and every service, and it's brittle in exactly the ways you don't want your incident response to be.
This is where standardizing on OpenTelemetry changes the equation. With a single instrumentation standard for all three signals and a shared data model (OTLP), cross-signal correlation is built into the foundation rather than bolted on after the fact.
If you're moving toward OTel, it's worth looking at backends that are OpenTelemetry-native from the ground up rather than those that accept OTLP and convert it into an internal format. That distinction matters because conversion is where things get lost: resource attributes get flattened into labels, delta temporality metrics get silently dropped, and the semantic richness of the OTel data model gets reduced to fit a schema that predates it. An OpenTelemetry-native backend doesn't have that translation layer, so the data you send is the data you query.
Dash0 takes this approach: metrics, logs, and traces share the same OTLP data model without translation layers, so resource attributes work as first-class concepts rather than requiring manual promotion to labels. PromQL still works for querying, but the underlying storage doesn't require the cardinality workarounds a traditional Prometheus deployment does. Dashboards are built on Perses, a vendor-neutral open standard, so your dashboard definitions aren't locked to a single backend.
If you're coming from Grafana, Dash0 has a built-in conversion utility that imports Grafana dashboard JSON and converts it to Perses format. Panel types, variables, and layout are mapped automatically, and PromQL-based panels carry over directly. Some specialized panels like heatmaps may need manual adjustment, but for most teams the bulk of the migration is handled by the importer.
And your existing Prometheus instrumentation doesn't need to change. The OTel
Collector's
Prometheus receiver
scrapes your /metrics endpoints exactly as Prometheus would and converts the
data to OTLP, so your application code stays the same. You can migrate service
by service, at whatever pace makes sense, without a flag day.
Final thoughts
The Prometheus-Grafana architecture is proven, well-supported, and good at what it does. It's also an architecture that quietly grows from two components to seven, and the operational weight of those components is something teams should plan for honestly rather than absorb incrementally until half the team's time is spent maintaining the monitoring stack.
If you're running this setup and it's working, there's no reason to tear it down. But if you're hitting cardinality ceilings, outgrowing metrics-only visibility, or spending more time debugging your monitoring setup than the applications it's supposed to monitor, then it's time to stop patching around the architecture and rethink the foundation.
If you're curious how your existing Prometheus setup maps onto an OTel-native setup, our Prometheus receiver guide walks you through it step by step.

