- 20 min read
8 Best Sematext Alternatives in 2026
Sematext Cloud combines infrastructure and service monitoring, logs, distributed tracing, real user monitoring (RUM), and synthetic checks in a SaaS platform. Its agent discovers services and log files, while app-scoped plans let teams choose different retention and capacity settings for each workload. That makes Sematext particularly useful for small and midsize operations teams that want broad coverage without assembling several backends.
The best Sematext alternatives solve different problems rather than merely reproducing its checklist. New Relic and Dynatrace offer broader enterprise platforms; Grafana Cloud favors open-source query ecosystems; Dash0 centers the workflow on OpenTelemetry; Site24x7 adds deeper network and website monitoring; Better Stack joins telemetry with incident response; Honeycomb specializes in high-cardinality investigation; and Elastic provides the most deployment control. This ranking reflects how completely each option can replace Sematext for a typical buyer, not overall product quality. Before switching, compare instrumentation effort, investigation workflow, deployment constraints, and the billing unit that grows with your architecture.
Quick picks
| Tool | Best fit |
|---|---|
| New Relic | Teams wanting the broadest self-service SaaS replacement with mature APM and digital experience monitoring |
| Dynatrace | Large enterprises that prioritize automatic topology, governance, and guided root-cause analysis |
| Grafana Cloud | Prometheus and Grafana users who want managed open-source backends without running them |
| Dash0 | Cloud-native teams standardizing on OpenTelemetry and PromQL-oriented investigation |
| Site24x7 | IT operations teams that need network, server, website, and synthetic monitoring in one package |
| Better Stack | Lean teams that want logs, uptime, on-call, and status pages close together |
| Honeycomb | Developers debugging high-cardinality distributed systems through traces and wide events |
| Elastic Observability | Teams that value Elasticsearch search, flexible deployment, and control over the data layer |
What to look for in a Sematext alternative
- Replacement scope. Decide whether you need all of Sematext's monitoring, logs, tracing, RUM, and synthetics, or whether depth in two or three signals matters more to you. A specialist can be the better tool and the worse one-for-one replacement.
- Instrumentation path. Check whether you can replace existing Sematext agents with standard OpenTelemetry SDKs and Collectors, another proprietary agent, or both. Portable collection reduces future migration work, but queries, dashboards, alerts, retention policies, and incident workflows still create switching costs.
- Investigation workflow. A single screen is not necessarily a single data model. Test whether you can move from an alert to the relevant resource, trace, and logs without rewriting filters or learning several query languages.
- Deployment and data control. Sematext is SaaS, although it can monitor private environments. If self-managed storage, private networking, or a particular data region is mandatory for you, validate the complete data path rather than the UI alone.
Operational overhead matters just as much. Managed platforms reduce backend work, while open or self-hosted stacks trade that convenience for control, so weigh collectors, sampling tiers, index or shard management, and upgrades before you commit. And look past the sticker price to the billing unit itself: the market splits across hosts, active series, ingested bytes, telemetry records, users, and committed platform consumption. Model the unit your own workload multiplies, whether that's ephemeral hosts, verbose logs, or high-cardinality metrics, rather than trusting the vendor's smallest advertised entry price.
1. New Relic
Best for: Teams that want a broad, self-service SaaS platform with mature application and digital experience monitoring
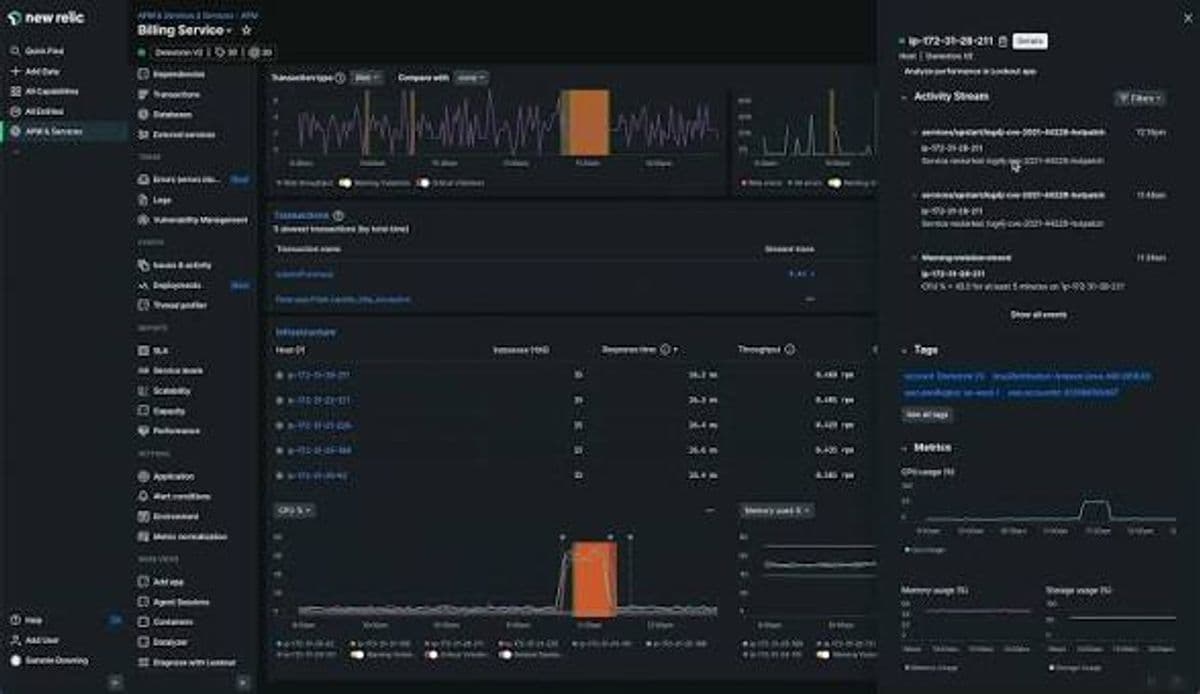
New Relic gets you closest to a general-purpose replacement for Sematext in this list. It covers application performance, infrastructure, logs, browser and mobile monitoring, synthetics, dashboards, and alerting, while its OpenTelemetry Protocol (OTLP) endpoint accepts OpenTelemetry traces, metrics, and logs. The product is a strong fit when several engineering teams need one managed platform and a large integration catalog.
The main difference is commercial and operational scale. New Relic pricing combines data ingest with either user access or compute consumption, and optional advanced capabilities add another cost dimension. That avoids host counting but makes team size, ingest volume, and enabled features part of your forecast. OpenTelemetry instrumentation remains portable, but you'll still rebuild NRQL queries, dashboards, alerts, and New Relic's entity model.
Worth exploring if: You need a credible one-vendor replacement for most of Sematext and want a usable free tier for evaluation.
Give it a pass if: You want self-managed deployment or a single telemetry-only billing dimension with no user or compute component.
2. Dynatrace
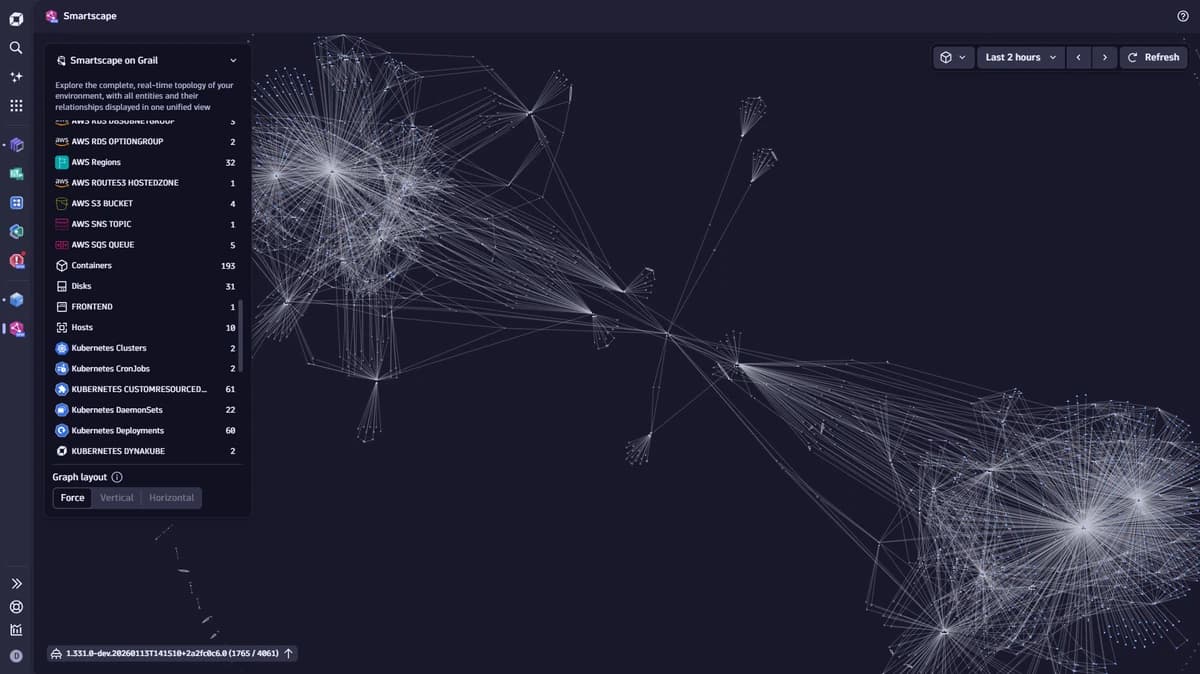
Best for: Large hybrid or multi-cloud estates that need automatic discovery, topology, and governed enterprise operations
Dynatrace is the enterprise automation choice. OneAgent, Smartscape topology, Grail storage, and the platform's analytics are designed to maintain a live model of services and dependencies, which is valuable when manual dashboard navigation no longer scales. Dynatrace also supports OTLP ingestion for traces, metrics, and logs, so teams can combine OpenTelemetry with its proprietary instrumentation.
The tradeoff: the most differentiated experience locks you into Dynatrace's own entity model, DQL, and automation layer. Its Platform Subscription uses a minimum annual spend commitment consumed against capability-specific usage; additional consumption continues on demand rather than stopping at the commitment. A 15-day free trial is available, but production buying is still a heavier motion than Sematext's self-service, app-scoped plans.
Worth exploring if: Automatic topology and root-cause guidance matter more than keeping the stack lightweight or fully open.
Give it a pass if: You are a small team seeking low-commitment purchasing, minimal platform onboarding, or a self-hosted open-source backend.
3. Grafana Cloud
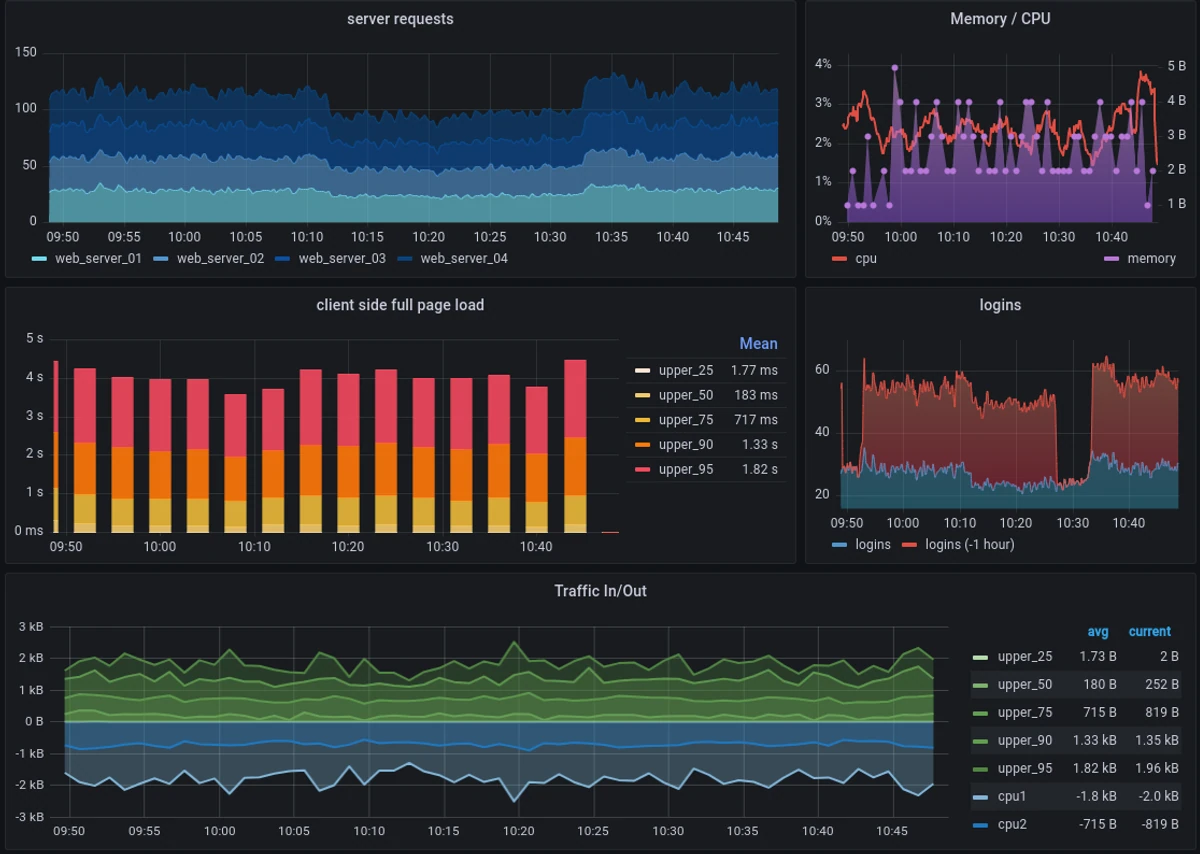
Best for: Teams already fluent in Grafana and Prometheus that want a managed, composable observability stack
Grafana Cloud packages managed metrics, logs, traces, profiles, visualization, and application observability around the Grafana ecosystem. Its OTLP endpoint routes OpenTelemetry signals into the relevant backends, making it a natural destination for teams already using Prometheus exporters, Grafana dashboards, or upstream collectors.
That flexibility comes with conceptual seams. Metrics, logs, and traces retain distinct storage and query patterns, so advanced investigations may span PromQL, LogQL, and TraceQL rather than one query model. Billing follows those signal boundaries too: active metric series and telemetry volume are important cost drivers, and generated application metrics can increase usage. Grafana Cloud offers both a limited free plan and self-service paid access, but you should model cardinality and retention instead of treating the base subscription as the total cost.
Worth exploring if: Your team values ecosystem choice, already knows Grafana, and wants managed backends without surrendering familiar collection standards.
Give it a pass if: You want one opinionated query workflow or expect an all-in-one product to hide the boundaries between telemetry backends.
4. Dash0
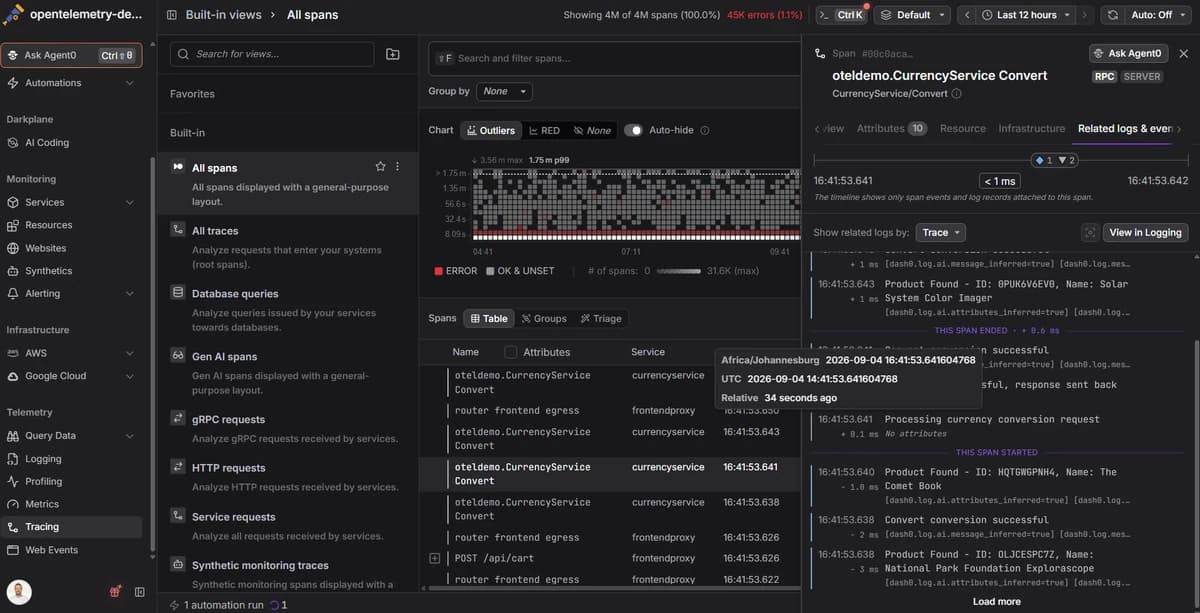
Best for: Cloud-native teams that want an OpenTelemetry-native backend with a consistent PromQL-oriented workflow
Dash0 treats OpenTelemetry resources, metrics, logs, traces, and web events as the starting point rather than an added ingestion route. Engineers can use a visual query builder or PromQL across signals, and Perses-based dashboards keep the configuration closer to open ecosystem standards. This reduces your instrumentation lock-in, although saved queries, dashboards, alerts, and investigation habits remain product-specific.
Dash0 pricing is consumption-based: metric data points, spans or span events, log records, web events, and synthetic API checks are metered directly, without separate host or seat charges. That makes the bill traceable to telemetry volume, though noisy logs, spans, and high-frequency metrics are the surprise-cost drivers to watch. Budget limits, forecasts, and filtering controls help teams manage that exposure, and a 14-day trial is available without a credit card.
Dash0 is less complete as a literal Sematext replacement when browser-journey monitoring is central. Its current synthetic monitoring focuses on HTTP endpoint checks from multiple regions rather than scripted browser transactions.
Worth exploring if: You are standardizing collection on OpenTelemetry and want signal correlation without adopting several backend-specific query languages.
Give it a pass if: Scripted browser journeys are a non-negotiable part of the replacement today.
5. Site24x7
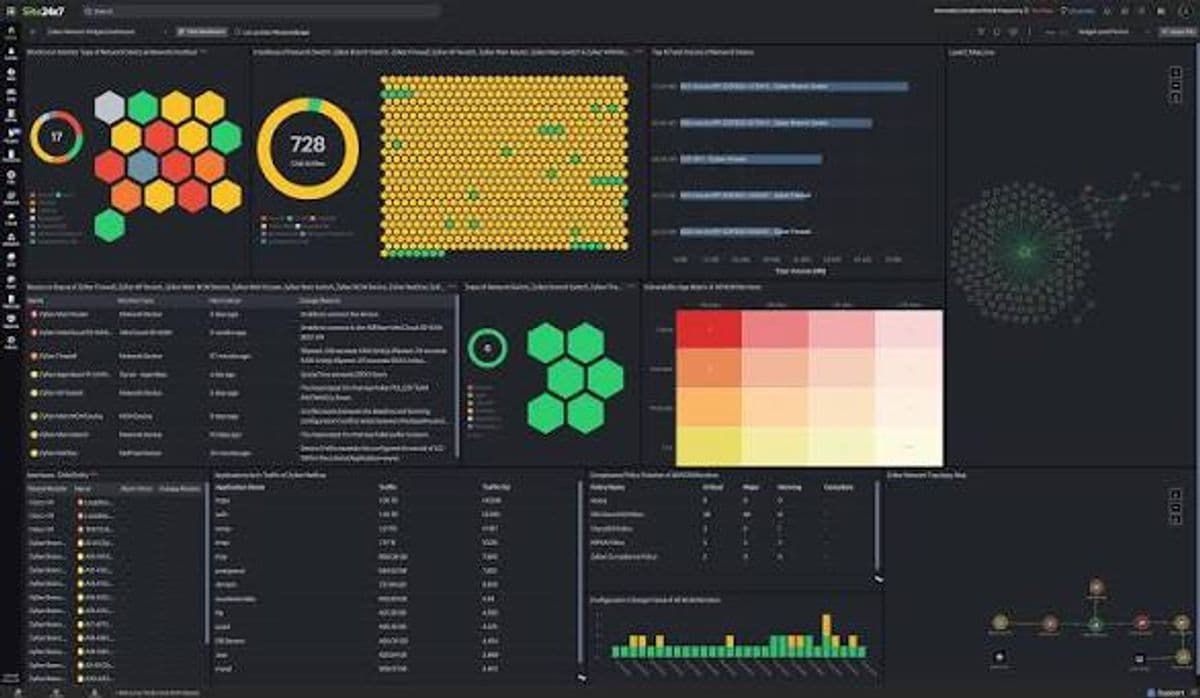
Best for: IT operations teams monitoring networks, servers, websites, and business transactions alongside applications
Site24x7 is the strongest infrastructure-and-digital-experience alternative on this list. Its catalog spans multi-cloud and on-premises servers, network devices, virtualization, Kubernetes, APM, logs, RUM, and browser-based synthetic transactions. An on-premises poller reaches devices and internal services behind a firewall, making Site24x7 more suitable than developer-first platforms for classic IT estates.
Its OpenTelemetry story is narrower than the product breadth suggests: the documented Site24x7 OpenTelemetry backend focuses on trace ingestion for APM. If you want standard logs, metrics, and traces to share one OTel-native model, test the full workflow carefully before committing.
Pricing is public and package-based, with included quantities for applications, servers, websites, logs, network components, and page views; additional monitors and capacity are purchased as add-ons. It is approachable for mixed monitoring needs, but forecasting gets harder when several included allowances and add-ons grow at different rates.
Worth exploring if: Network monitoring, private-location checks, RUM, or real-browser synthetics matter as much as application telemetry.
Give it a pass if: An OpenTelemetry-first, cross-signal data model is your primary requirement.
6. Better Stack
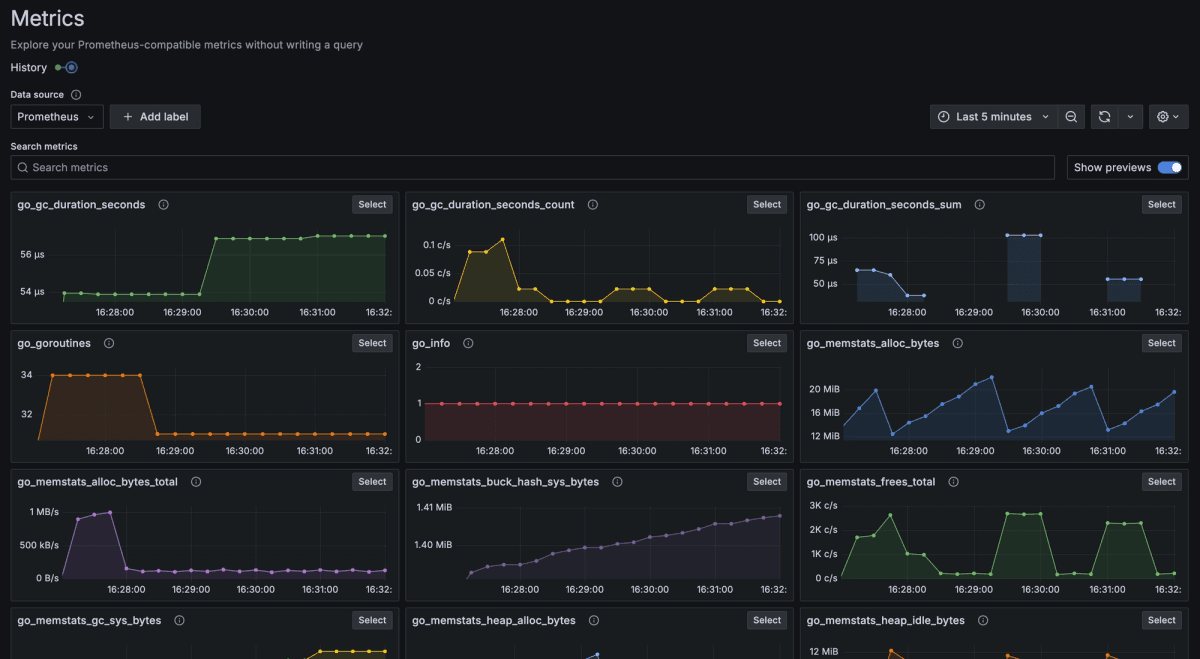
Best for: Lean product teams that want telemetry, uptime, on-call, and public status communication in one service
Better Stack links logs, metrics, traces, error tracking, RUM, uptime checks, incidents, on-call scheduling, and status pages. Its collector uses OpenTelemetry and adds eBPF-based traces and metrics for supported environments, which can shorten time to useful service visibility. Telemetry lives in a ClickHouse-backed warehouse exposed through a read-only SQL API, a practical advantage for teams that want to analyze or visualize their data outside the built-in UI.
The platform's strength is workflow compression rather than the deepest APM or infrastructure inventory. Better Stack pricing exposes a free plan and separate dimensions for telemetry ingestion and retention, uptime checks, incident responders, and enterprise features. That makes selective adoption easy, but if you're replacing several Sematext modules, model the combined bill rather than one product tile.
Worth exploring if: A small operations team wants monitoring, alert response, and status communication to live close together.
Give it a pass if: You need deep network-device monitoring, a long tail of infrastructure integrations, or enterprise-scale APM governance.
7. Honeycomb
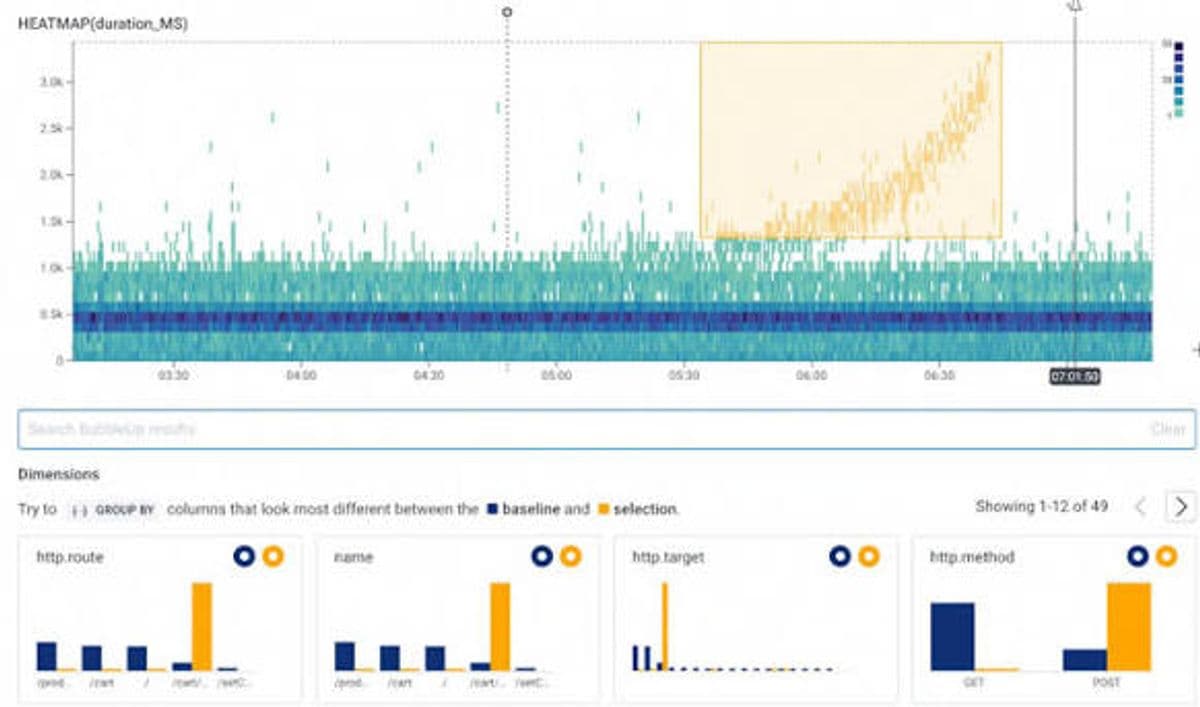
Best for: Software teams debugging high-cardinality microservices and distributed traces
Honeycomb is the specialist choice for exploratory debugging. It accepts OpenTelemetry traces, metrics, and logs and stores telemetry as wide events, allowing engineers to group and filter on high-cardinality dimensions during an incident. Its BubbleUp workflow compares an outlier selection with the baseline across available fields, which is particularly effective when the decisive question was not anticipated in a dashboard.
Cost control is tied closely to data modeling. Honeycomb pricing uses event volume and metric data points, with a free plan and public paid tiers, while the open-source Refinery proxy provides trace-aware tail sampling. Refinery can retain rare or erroneous traces at a higher rate than routine traffic, but operating it introduces another production component and sampling policy to maintain.
Honeycomb now covers all three primary OpenTelemetry signals, yet it is not the most direct replacement for Sematext's infrastructure inventory, network monitoring, RUM, or browser synthetics. Choose it because the investigation model fits your services, not because the checklist is identical.
Worth exploring if: Your hardest incidents require ad hoc questions across high-cardinality request context and complete traces.
Give it a pass if: You primarily need traditional host, network, website, or synthetic transaction monitoring out of the box.
8. Elastic Observability
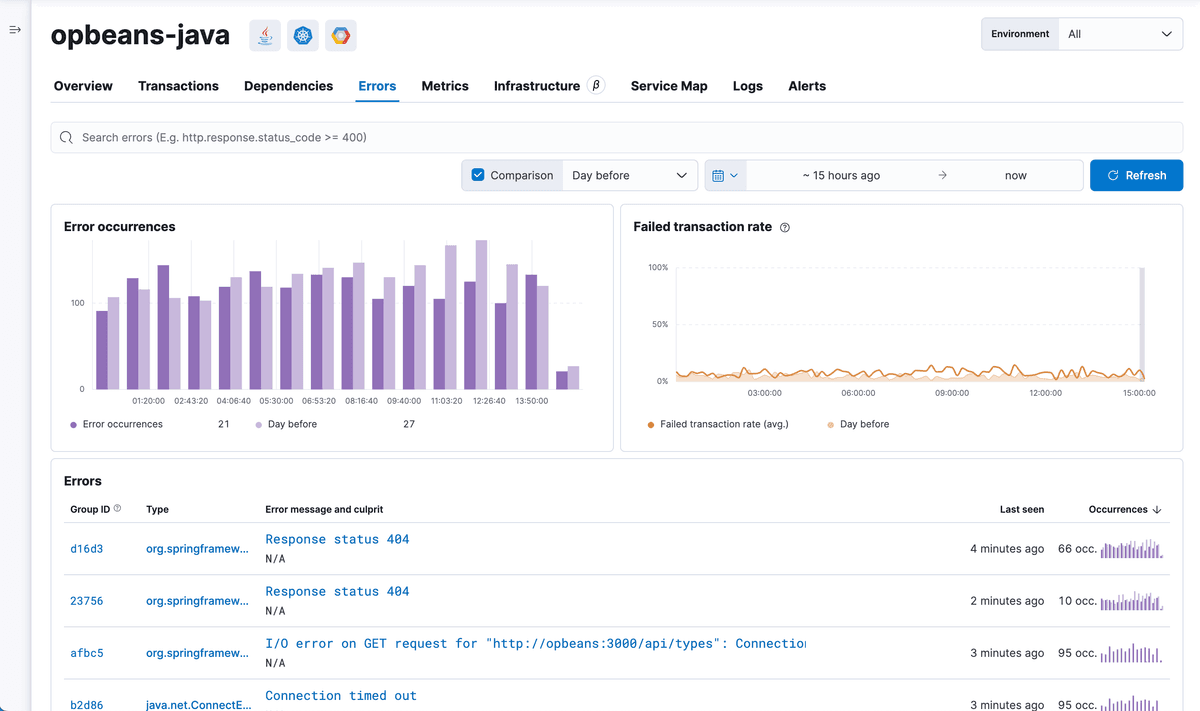
Best for: Teams that want search-led observability, flexible deployment, or control over the underlying data platform
Elastic Observability combines logs, infrastructure monitoring, APM, RUM, synthetics, and search in Elasticsearch and Kibana. It is the broadest deployment choice here: Elastic Cloud offers hosted and serverless services, while the stack can also be self-managed. Teams already using Elasticsearch for logs or security can consolidate operational data and reuse ES|QL and Kibana expertise.
Elastic's OpenTelemetry support spans serverless, hosted, self-managed, and hybrid paths, but OTel-native fields may require content packs for compatible dashboards; existing Elastic integrations often use the Elastic Common Schema instead. That distinction matters during migration because portable instrumentation does not automatically make dashboards and queries portable.
Serverless pricing meters ingest and retained data, while hosted deployments are priced from provisioned cloud resources. Self-managing it replaces a vendor bill with your own responsibility for sizing, upgrades, shard behavior, retention, and availability. Elastic can be economical and flexible when a team already has that discipline; it is rarely the simplest path away from Sematext.
Worth exploring if: Search, deployment control, or an existing Elasticsearch footprint outweighs the desire for a turnkey SaaS experience.
Give it a pass if: Your main goal is to eliminate data-platform operations and simplify the number of query and schema concepts engineers must learn.
Comparison table
| Tool | Best fit | Telemetry model | Pricing model | Deployment | Main tradeoff |
|---|---|---|---|---|---|
| New Relic | Broad SaaS replacement | Proprietary platform with OTLP ingestion | Ingest plus users or compute | SaaS | Multiple commercial dimensions and proprietary workflows |
| Dynatrace | Governed enterprise estates | OneAgent and OTel data in Grail | Annual platform commit consumed by usage | SaaS with private data-path options | Heavier adoption and buying motion |
| Grafana Cloud | Grafana and Prometheus teams | OTLP routed to signal-specific backends | Active series and signal volume | SaaS | Several data and query models remain visible |
| Dash0 | OTel-standardized cloud-native teams | OpenTelemetry-native, PromQL-oriented | Telemetry records and data points | SaaS | HTTP synthetics do not replace scripted browser journeys |
| Site24x7 | IT, network, and website operations | Product agents plus OTel trace ingestion | Packages, monitors, and add-ons | SaaS with on-premises pollers | OTel coverage is not equally deep across signals |
| Better Stack | Lean product operations | OTel and eBPF into ClickHouse | Ingest, retention, monitors, and responders | SaaS | Less depth for network and large-enterprise APM |
| Honeycomb | High-cardinality debugging | OTel wide events and traces | Events and metric data points | SaaS; optional self-run sampling tier | Not a like-for-like IT monitoring suite |
| Elastic Observability | Search and deployment control | Elastic and OTel schemas in Elasticsearch | Ingest/retention or provisioned resources | Serverless, hosted, or self-managed | Highest potential operating complexity |
Final thoughts
The Sematext alternatives divide into approaches, not a simple quality ladder. New Relic and Dynatrace are the strongest broad SaaS replacements; Site24x7 is better when networks and browser transactions dominate; Grafana Cloud and Elastic favor ecosystem or data-layer control; Honeycomb prioritizes exploratory debugging; and Better Stack compresses monitoring and incident workflows for lean teams. Dash0 is the most direct choice when the migration is also an opportunity to standardize on OpenTelemetry and a consistent PromQL-oriented investigation model, but it should not outrank a tool whose browser, network, or self-hosting coverage better matches the requirement.
Before replacing Sematext, run a representative service through the entire incident path: collection, enrichment, alerting, resource context, trace-to-log navigation, and retention. Then replay one month of host churn, active series, log volume, span volume, users, and synthetic checks against each vendor's billing units. Finally, inventory the Sematext dashboards, alerts, browser journeys, and app-specific retention policies that must be rebuilt; those product artifacts, not the telemetry SDK, usually define the real migration cost. If an OpenTelemetry-native SaaS path fits that test, the Dash0 free trial is a practical way to validate the workflow with production-shaped data. No credit-card required.