LogicMonitor is a SaaS monitoring platform for hybrid IT estates. Teams use collectors inside their networks to discover and monitor servers, network devices, storage, virtualization, cloud resources, and applications without installing an agent on every target. That collector model, broad protocol support, and Active Discovery make LogicMonitor particularly effective for mid-market and enterprise infrastructure teams managing a mix of data centers and cloud environments.
The best LogicMonitor alternative depends on what you want to change. Dynatrace and Datadog go deeper into application and cloud observability; Checkmk adds deployment control without giving up hybrid infrastructure depth; and Dash0 is a cleaner fit when the destination is OpenTelemetry, Prometheus, and Kubernetes. PRTG, ScienceLogic, Site24x7, and Zabbix cover different network, IT-operations, budget, and self-hosting priorities. Pricing is another reason to compare: LogicMonitor now uses tiered platform packages and Hybrid Units, so buyers should model their exact mix of devices, IaaS, PaaS, wireless access points, and Kubernetes pods against the current LogicMonitor pricing model.
Quick picks
| Tool | Best fit |
|---|---|
| Dynatrace | Large enterprises that prioritize automatic topology and causal analysis across applications and infrastructure |
| Datadog | Teams consolidating cloud, application, network, security, and incident workflows under one SaaS vendor |
| Checkmk | Hybrid estates that need strong SNMP and server monitoring with SaaS or self-hosted deployment |
| Dash0 | Cloud-native teams replacing legacy monitoring with OpenTelemetry, Prometheus, and Kubernetes workflows |
| PRTG | Network-centric teams that want approachable sensor-based monitoring and public pricing |
| ScienceLogic Skylar One | Large IT operations teams and service providers that organize monitoring around business services and automation |
| Site24x7 | Cost-conscious SMB and mid-market teams wanting a broad SaaS monitoring bundle |
| Zabbix | Teams prepared to operate an open-source monitoring platform for maximum control and no license fees |
What to look for in a LogicMonitor alternative
-
Collection fit: Inventory what LogicMonitor Collectors gather today through SNMP, WMI, JMX, APIs, scripts, and cloud integrations. An agent, OpenTelemetry Collector, or SaaS API may not reproduce the same coverage.
-
Network depth: If switches, routers, firewalls, traps, flow data, topology, and device configuration matter, evaluate those capabilities directly. Full-stack observability does not automatically mean deep network operations.
-
Application and Kubernetes visibility: Decide whether the replacement must add code-level tracing, service maps, runtime analysis, or Kubernetes-native views. These requirements favor different tools than a device-first monitoring project.
-
Discovery and service context: Compare how each platform finds new resources, maintains dependencies, groups alerts, and maps technical failures to business services. This is often where migration value—or alert noise—shows up.
-
Deployment and data control: SaaS reduces platform operations; self-hosting improves control over data location and upgrade timing. Hybrid collection components still need capacity planning and availability monitoring.
-
Pricing and migration cost: Model the vendor's actual meters—hosts, devices, sensors, services, telemetry records, ingest, retention, or add-ons. Also budget for rebuilding LogicModules, dashboards, alert routing, escalation chains, and historical baselines.
1. Dynatrace
Best for: Large, dynamic estates where automatic topology and causal analysis can replace manual investigation
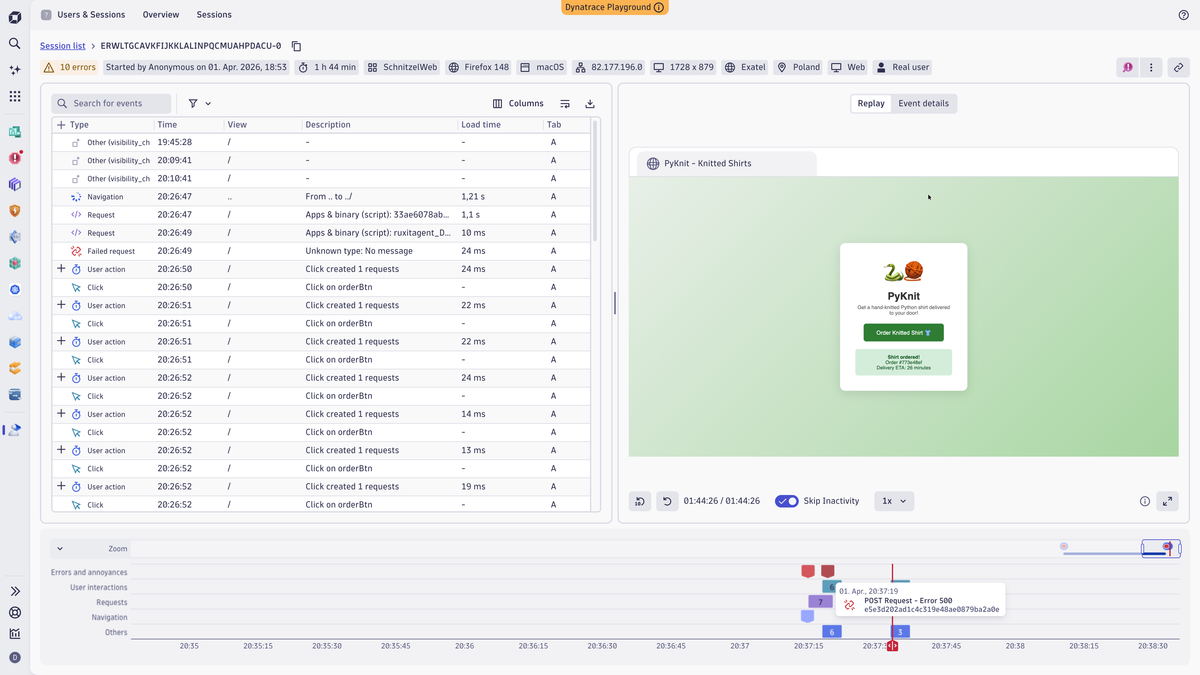
Dynatrace is the strongest automation-led alternative. OneAgent collects application and host telemetry, Smartscape maintains topology, and Dynatrace Intelligence applies that context to anomaly detection and root-cause analysis. Its current infrastructure experience also supports SNMP network-device monitoring and autodiscovery, making it a credible replacement when LogicMonitor spans applications, cloud, hosts, and core network equipment.
The main difference is product gravity. Dynatrace delivers the most value when you adopt its proprietary entity model, Grail data platform, DQL, OneAgent, and automation workflows together. It accepts OpenTelemetry data, but instrumentation portability does not make those investigations, queries, dashboards, and service models portable.
Dynatrace pricing uses an annual platform commitment consumed across capability-specific units such as host or memory-GiB hours, pods, and ingested or queried data. Public rates, consumption forecasting, and a 15-day trial improve buying access, but a mixed estate can activate several meters; model the whole deployment rather than only infrastructure monitoring.
Worth exploring if: Automatic discovery, dependency context, and guided root-cause analysis justify an enterprise-wide observability platform.
Give it a pass if: You want a lightweight network-monitoring replacement, a small billing surface, or operational assets centered on open query and dashboard standards.
2. Datadog
Best for: Organizations standardizing application, infrastructure, network, security, and operational workflows on one SaaS platform
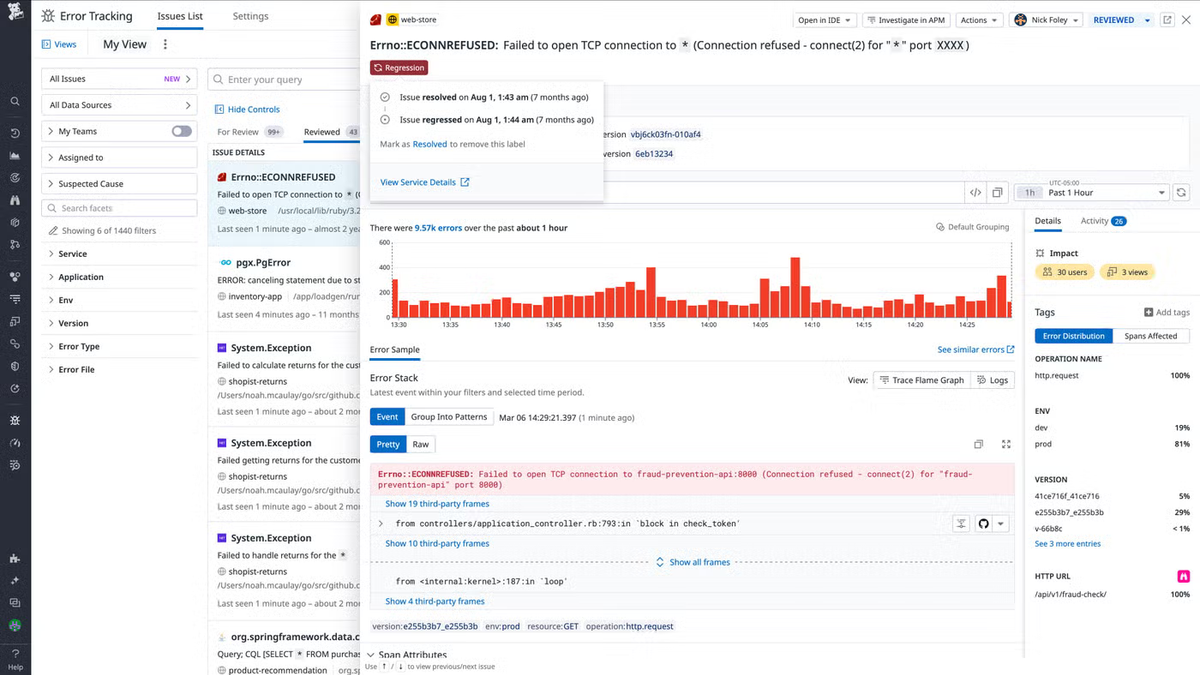
Datadog is the breadth-first alternative. It combines mature cloud and infrastructure monitoring with APM, logs, digital experience, security, incident management, and a large integration catalog. Its Network Device Monitoring can autodiscover SNMP devices, ingest traps and flow data, and map topology through an on-premises Datadog Agent, so the platform can cover more of LogicMonitor's network role than an application-only observability product.
Datadog also supports community OpenTelemetry Collectors and its own distribution. That reduces instrumentation and transport lock-in, but monitors, dashboards, queries, service catalog entries, notebooks, and incident workflows remain Datadog-specific. The platform's strength is precisely this integrated product surface, so migration value is highest when multiple teams agree to standardize on it. Teams weighing that tradeoff against an OpenTelemetry-native path can compare notes in Dash0's Datadog migration guide.
Datadog pricing separates infrastructure hosts, network devices, APM, logs, custom metrics, and add-ons into different meters. Public pricing and a trial make evaluation easy, but elastic host counts, verbose logs, custom metrics, and wider module adoption can make total spend harder to forecast.
Worth exploring if: You want the broadest ready-made SaaS platform and can govern both product adoption and telemetry volume centrally.
Give it a pass if: Self-hosting, a small number of billing dimensions, or portable operational workflows are hard requirements.
3. Checkmk
Best for: Hybrid infrastructure teams that want deep server and network monitoring with a choice of SaaS or self-hosting
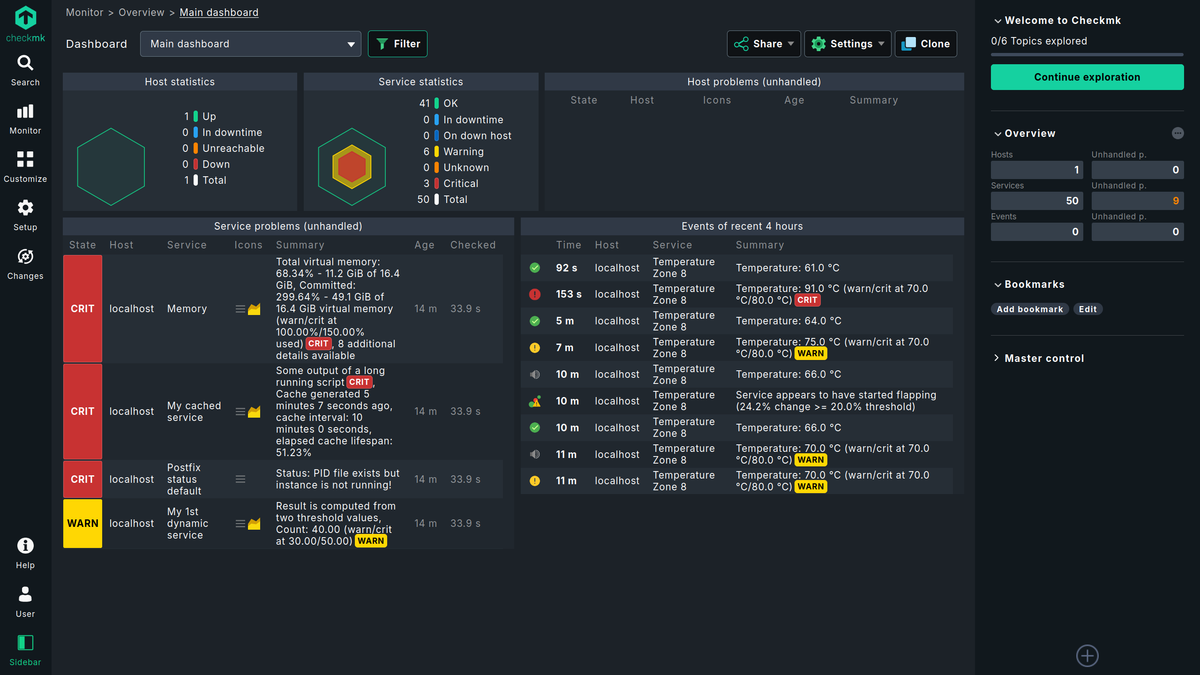
Checkmk is the closest infrastructure-monitoring alternative for buyers who want more deployment control. It combines Checkmk agents for operating systems with SNMP, APIs, and special agents for network devices, virtualization, storage, cloud services, databases, and applications. Its network product includes more than 2,000 preconfigured checks, while service discovery reduces the work of maintaining ports, filesystems, processes, and other changing instances.
The deployment range is a real differentiator. Checkmk offers SaaS for smaller and mid-sized hybrid estates, paid self-hosted Pro and Ultimate editions, and a free Community edition. Self-hosting keeps monitoring data and upgrade timing under your control, but it also transfers server sizing, high availability, backups, and upgrades to your team. Checkmk's model is more infrastructure- and service-oriented than code-level APM platforms such as Dynatrace.
Checkmk pricing is based on monitored hosts and services, with public entry pricing and a 30-day trial. Costs are more directly tied to discovered monitoring scope than telemetry ingest, so service counts and edition limits deserve a proof-of-concept inventory.
Worth exploring if: SNMP, servers, storage, and distributed hybrid monitoring matter more than deep proprietary application tracing.
Give it a pass if: Your main goal is a turnkey, application-centric observability platform with minimal monitoring-server administration.
4. Dash0
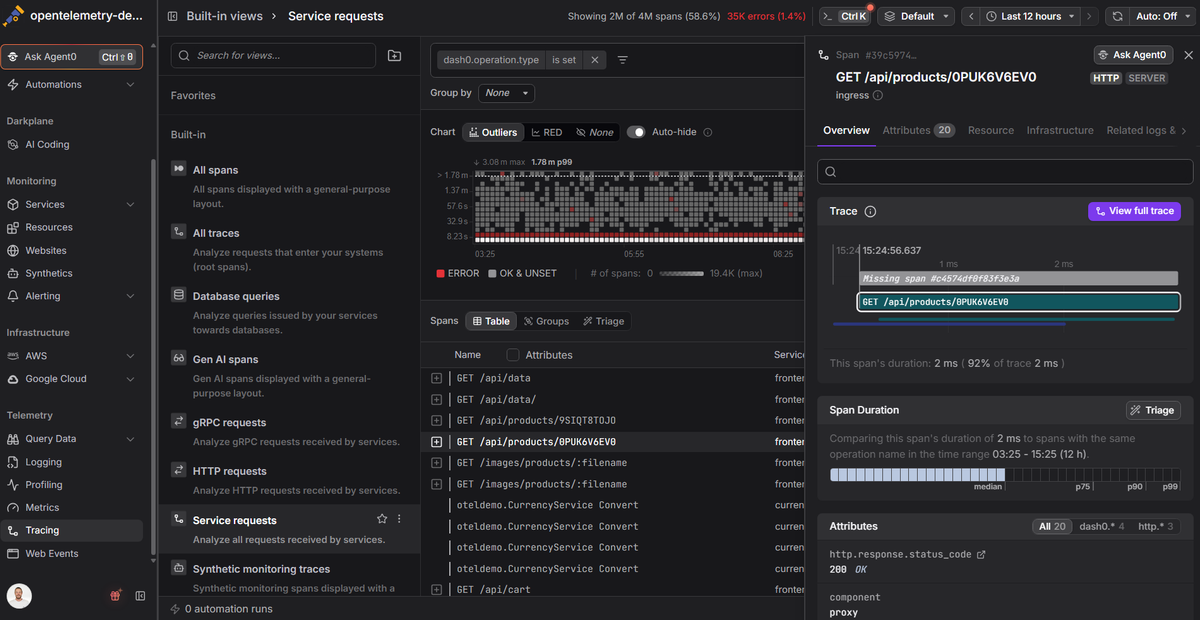
Best for: Cloud-native engineering teams moving from device-centric monitoring to OpenTelemetry and Prometheus
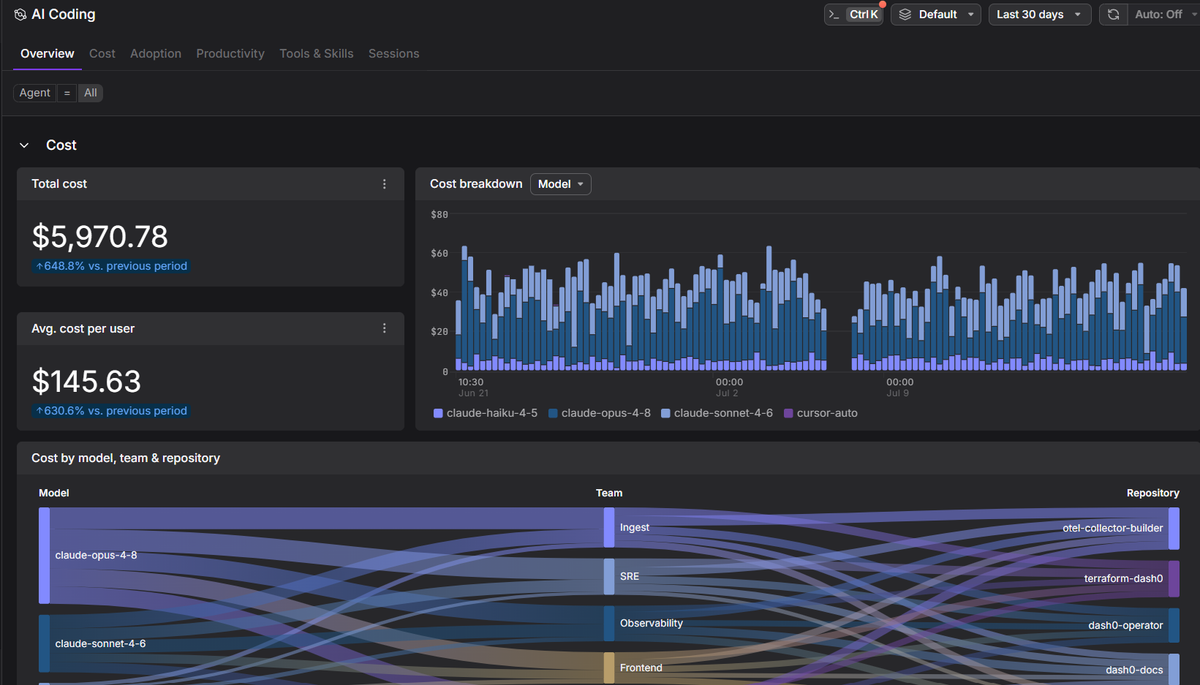
Dash0 is the architectural alternative rather than a like-for-like LogicMonitor replacement. It is built around OpenTelemetry, PromQL, and Perses-compatible dashboards, with a managed workflow across metrics, logs, traces, resources, alerts, and Kubernetes. Your OpenTelemetry instrumentation and Collector pipelines remain portable, although Dash0-specific views, checks, datasets, and investigation workflows still create switching costs.
Dash0 is most relevant when replacing LogicMonitor is part of a cloud-native standardization project. The current integration catalog emphasizes Kubernetes, cloud platforms, OpenTelemetry, Prometheus, host metrics, databases, and application telemetry; it is not designed as a deep SNMP/WMI network-device platform. Its integration catalog and zero-code runtime coverage are also smaller than those of the largest enterprise suites.
Dash0 pricing is consumption-based by metric data points, spans, log records, web events, and synthetic checks, without separate host or seat charges. Public pricing, budget controls, ingest filters, and a 14-day trial make spend easier to test, but noisy telemetry and high event volume still require collection discipline.
Worth exploring if: OpenTelemetry, Prometheus, Kubernetes, and transparent telemetry-unit pricing define your target architecture.
Give it a pass if: LogicMonitor primarily monitors routers, switches, storage arrays, Windows services, or other legacy infrastructure through agentless protocols.
5. Paessler PRTG
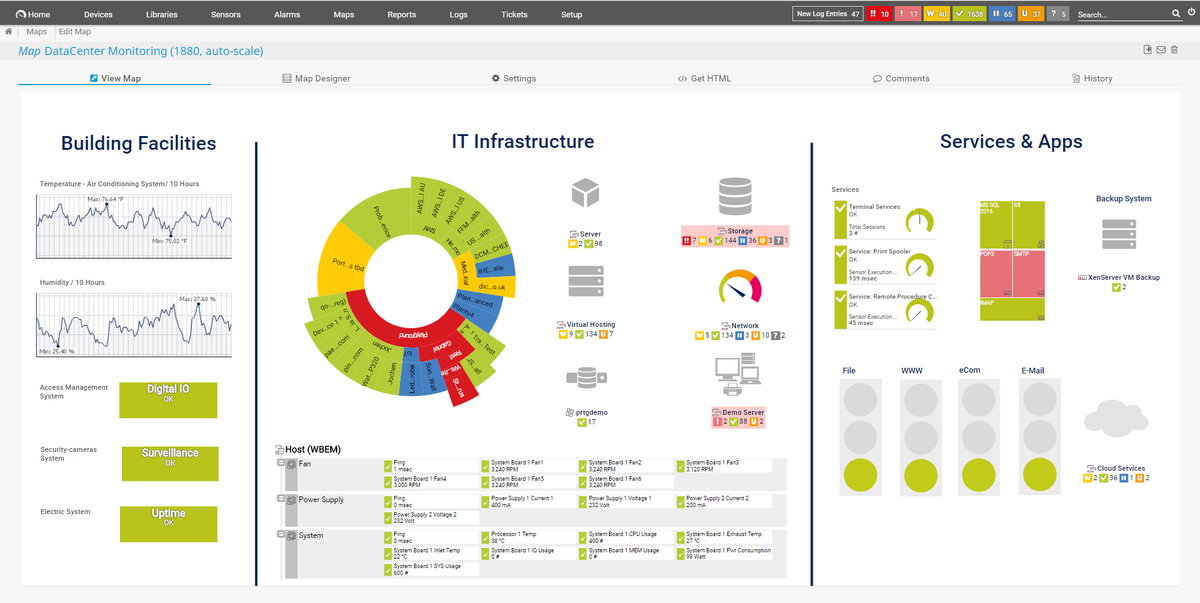
Best for: Network-oriented teams that want quick onboarding, public pricing, and straightforward device monitoring
Paessler PRTG organizes monitoring around sensors, each tracking an aspect such as availability, interface throughput, CPU load, or a service response. The model works well for networks, servers, virtualization, storage, and common infrastructure services. Remote probes extend collection into branch offices and isolated network segments, much like placing LogicMonitor Collectors near monitored resources.
PRTG is a better fit than LogicMonitor when network visibility and operational simplicity matter more than advanced application tracing or service-level causal analysis. PRTG Network Monitor's core server is Windows-based, although multi-platform probes can collect from Linux and other environments; Hosted Monitor removes the core-server requirement but still needs probes for private networks. Large deployments also require deliberate sensor and core-server sizing.
PRTG pricing is public and based on sensor tiers. A 30-day unrestricted trial reverts to a 100-sensor freeware edition, which makes hands-on evaluation unusually accessible. The tradeoff is that detailed devices consume many sensors, so forecast at the sensor level rather than multiplying device count by a headline rate.
Worth exploring if: Your replacement project is primarily network and infrastructure monitoring, and a sensor model maps cleanly to the estate.
Give it a pass if: You need deep distributed tracing, automated business-service causality, or a Linux-based on-premises core server.
6. ScienceLogic Skylar One
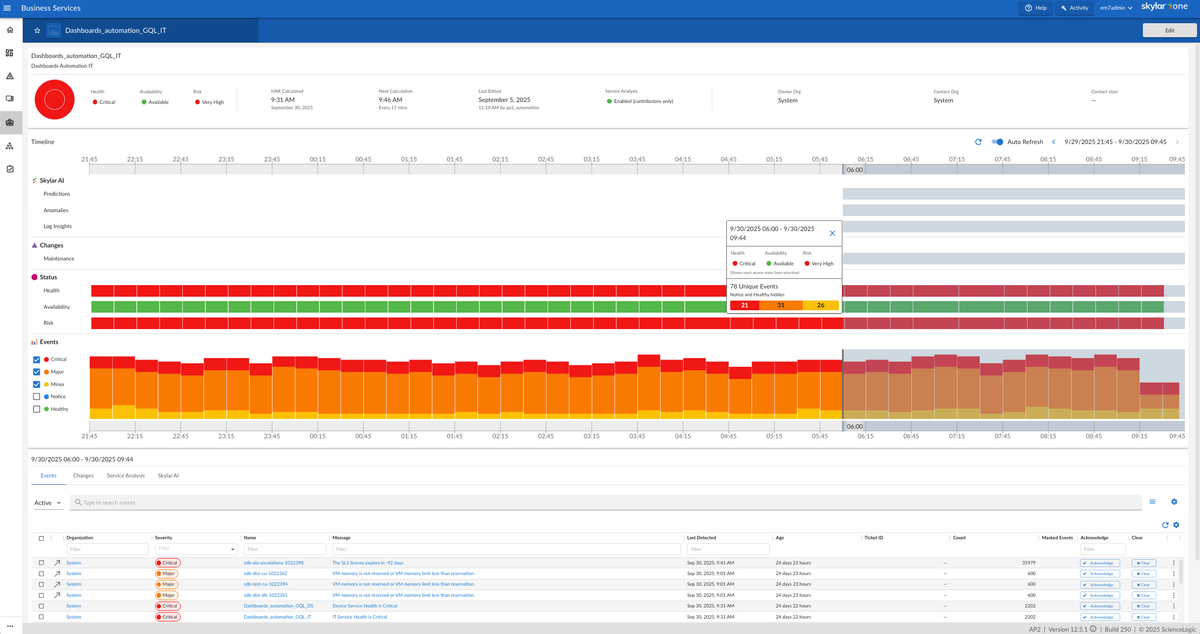
Best for: Large enterprises and service providers that need service-centric IT operations, CMDB alignment, and automation
ScienceLogic Skylar One, built on SL1, is the service-operations alternative. It discovers and monitors hybrid and multi-vendor infrastructure, builds topology and business-service views, correlates events, and connects those insights to IT workflows. More than 400 packaged integrations and a low-code studio make it well suited to enterprises and managed service providers with a long tail of devices and internal platforms.
Compared with LogicMonitor, ScienceLogic is most compelling when the buying project extends beyond monitoring into service modeling, event correlation, configuration data, and automated remediation. That broader operating model can reduce tool fragmentation, but it also means a heavier implementation: discovery, service relationships, integrations, governance, and automation all need owners. A team seeking a fast, self-service monitoring rollout may find the platform larger than the problem.
ScienceLogic pricing publishes per-device starting points for core monitoring and separate automation, configuration, and AI capabilities; SaaS, cloud, and on-premises options are available. A 14-day test drive exists, but enterprise buyers should model the add-ons required for the intended operating model.
Worth exploring if: Business-service visibility and IT workflow automation are central to the replacement case.
Give it a pass if: You want a lightweight tool, self-service cloud purchase, or an engineering-first traces-and-metrics workflow.
7. Site24x7
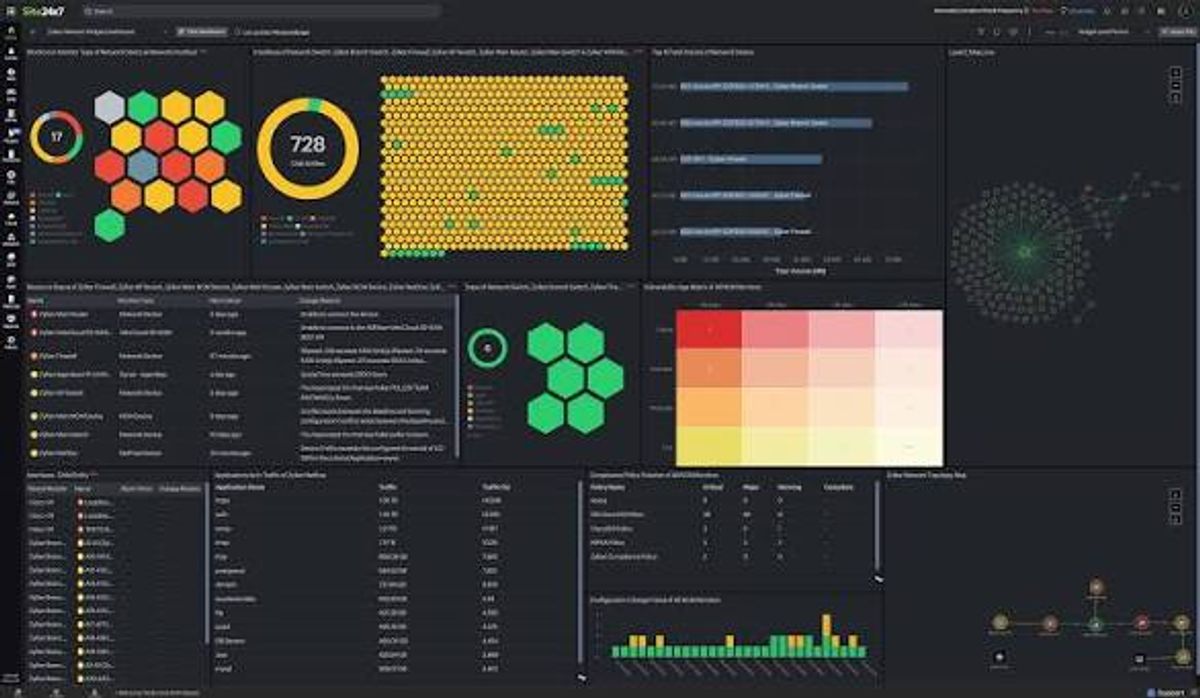
Best for: Small and mid-market teams that want broad SaaS monitoring without an enterprise-platform commitment
Site24x7 bundles website, server, cloud, application, Kubernetes, log, and network monitoring in a SaaS product with an on-premises poller for private resources. Its network tooling supports SNMP devices, interfaces, topology, traps, flow analysis, and configuration monitoring. That makes it a practical LogicMonitor alternative for teams that need broad coverage but do not require LogicMonitor's depth of customization or ScienceLogic's service-operations model.
The attraction is accessible packaging and a short path to useful monitoring. The tradeoff appears as the deployment grows: Site24x7 uses several resource types—basic and advanced monitors, hosts, network components, log ingest, RUM views, and add-ons. Network licenses also count devices, extra interface blocks, flow-monitored interfaces, and configuration monitoring differently, so a seemingly simple bundle can require careful inventory.
Site24x7 pricing is public, includes a limited free plan, and offers a 30-day trial. The entry point is friendly, but teams should use the vendor's network-component rules to forecast a production estate rather than extrapolating from the base bundle.
Worth exploring if: You need broad monitoring coverage, a SaaS operating model, and a lower-friction commercial entry point.
Give it a pass if: You need highly customized hybrid discovery, one simple enterprise billing unit, or deep code-level investigation across a large software estate.
8. Zabbix
Best for: Teams with monitoring expertise that want open-source control, distributed collection, and no software license fees
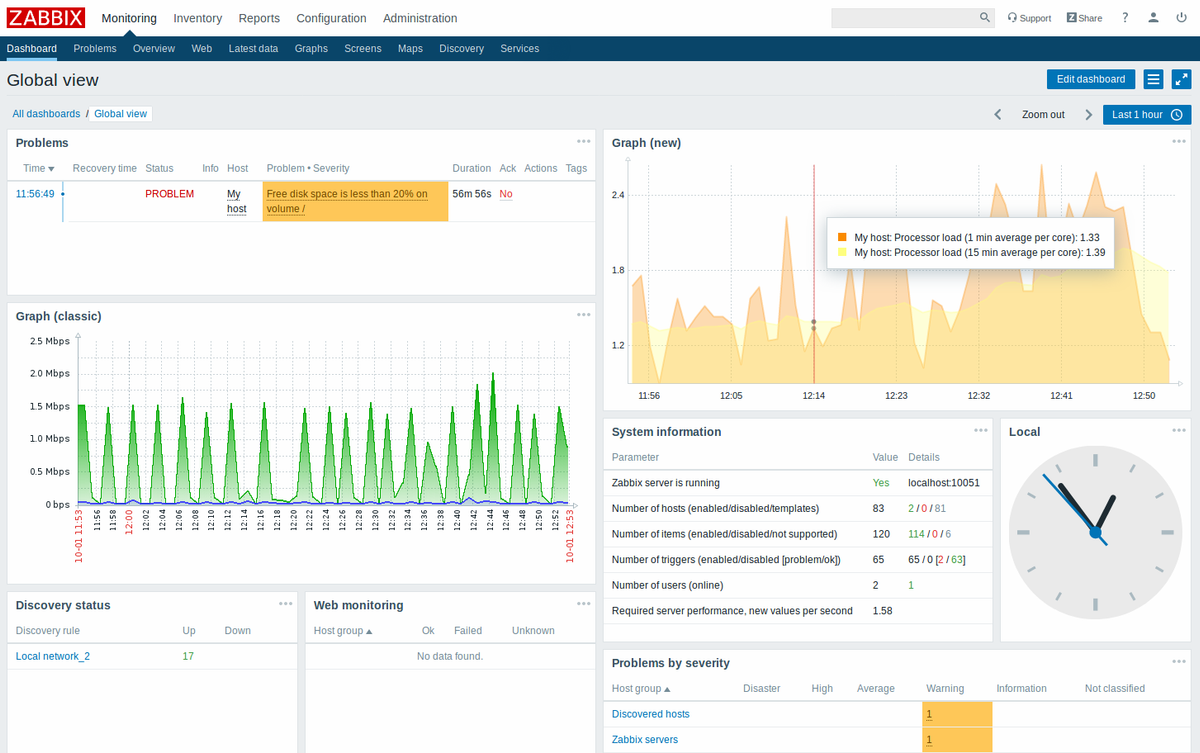
Zabbix is the control-first alternative. It monitors servers, network devices, virtual infrastructure, applications, and services through agents, SNMP, JMX, IPMI, HTTP, scripts, and templates. Zabbix proxies collect data in remote locations, buffer through connectivity interruptions, and report to a central server, which gives distributed estates a collector pattern familiar to LogicMonitor users.
The software is open source and can be used without device, metric, user, or feature license fees. That does not make it free to operate: your team owns deployment architecture, database performance, proxy placement, upgrades, template quality, backups, and high availability unless you buy hosted or professional services. Zabbix also gives you building blocks rather than the polished automatic causal analysis of Dynatrace or the broad SaaS workflow integration of Datadog.
Zabbix subscription pricing covers support response commitments and expert services rather than monitored-resource volume; hosted Zabbix Cloud is a separate option. Spend is therefore predictable at the license layer, while infrastructure and staff time become the main variables.
Worth exploring if: Data control, extensibility, and avoiding per-resource license growth outweigh the cost of running the platform.
Give it a pass if: You lack an internal monitoring owner or expect a turnkey SaaS product with automatic service context from day one.
Comparison table
| Tool | Best fit | Main strength | Main tradeoff | Pricing model | Deployment |
|---|---|---|---|---|---|
| Dynatrace | Large, dynamic enterprises | Automatic topology and causal analysis | Enterprise platform gravity and several consumption meters | Annual commitment across capability units | SaaS; managed/on-premises option |
| Datadog | Broad SaaS standardization | Product breadth and integration maturity | Separate product meters and proprietary workflows | Hosts, devices, ingest, custom metrics, sessions, add-ons | SaaS with local agents |
| Checkmk | Hybrid server and network estates | Infrastructure depth and deployment choice | Self-hosting burden or less application depth | Monitored hosts and services | SaaS or self-hosted |
| Dash0 | OTel and Kubernetes teams | OpenTelemetry-native cross-signal workflow | Not a deep legacy network replacement | Telemetry records and metric data points | SaaS |
| PRTG | Network-first teams | Approachable sensor model and public pricing | Sensor growth and Windows-based on-prem core | Sensor tiers | Hosted or self-hosted |
| ScienceLogic Skylar One | Enterprise IT operations and MSPs | Service topology and workflow automation | Heavier implementation and governance | Devices plus capability add-ons | SaaS, cloud, or on-premises |
| Site24x7 | SMB and mid-market teams | Broad coverage at an accessible entry point | Multiple resource and add-on license types | Hosts, components, monitors, ingest, add-ons | SaaS with on-premises pollers |
| Zabbix | Control-focused platform teams | Open source and extensibility | Full operational ownership | No license fee; optional support or hosting | Self-hosted or managed cloud |
Final thoughts
There is no universal LogicMonitor replacement because the alternatives optimize for different operating models. Dynatrace and Datadog are stronger consolidation plays when application, cloud, and automation depth justify a larger platform. Checkmk, PRTG, ScienceLogic, Site24x7, and Zabbix retain more of the infrastructure and network orientation, with tradeoffs among deployment control, service modeling, operational burden, and commercial simplicity. Dash0 fits a narrower but important transition: moving the monitoring center of gravity from devices and proprietary collectors to portable application and infrastructure telemetry.
Before switching, run the same representative slice of the estate through both platforms. Include SNMP devices, Windows and Linux servers, storage, virtualization, one Kubernetes cluster, a critical application, remote-site connectivity loss, alert routing, and the dashboards used during an incident. Validate discovery accuracy, polling or agent overhead, dependency context, missing protocols, retention, RBAC, migration effort, and a full production cost model—not just the entry plan. If that test confirms an OpenTelemetry- and Prometheus-centered target rather than a direct network-monitoring replacement, the Dash0 free trial is a practical way to evaluate the cloud-native path with your own telemetry. No credit-card required.