- 19 min read
7 Best Checkly Alternatives in 2026
Checkly is a synthetic monitoring platform for developer-owned API and browser checks. It is particularly strong when your team already uses Playwright and wants checks defined in JavaScript or TypeScript, reviewed in Git, and deployed through CI/CD. Its current product covers Playwright browser journeys, API checks, and several monitoring-as-code paths, including its CLI, Terraform, Pulumi, and API.
Teams usually compare Checkly alternatives for one of four reasons: they want synthetic failures correlated with infrastructure telemetry, prefer k6 or a visual authoring workflow to Playwright, need on-call and incident response in the same product, or want a different deployment and billing model. Checkly separates monitor inventory from API and browser execution allowances, so frequency, locations, retries, and suite duration can all influence consumption. The right replacement therefore depends less on a generic feature count than on which of those constraints is driving the move.
Quick picks
The table below is a fast filter before the full write-ups: match your primary reason for leaving Checkly to a row, then read that vendor's section for the pricing and tradeoff details.
| Tool | Best fit |
|---|---|
| Grafana Cloud | Grafana and k6 teams that want JavaScript checks, open-source engines, and metrics-first analysis |
| Better Stack | Small and midsize teams that want Playwright monitoring, on-call, and status pages together |
| Dash0 | OpenTelemetry teams replacing Checkly's HTTP/API checks and wanting telemetry-native investigation |
| New Relic | Application teams that want synthetics inside a broad observability platform with a useful free allowance |
| Sematext | Teams that prioritize per-monitor pricing and straightforward browser and HTTP coverage |
| OneUptime | Teams prepared to self-host synthetic monitoring and the surrounding incident workflow |
| Datadog | Enterprises that want browser and API tests correlated with an existing full-stack Datadog deployment |
What to look for in a Checkly alternative
Separate true multi-step browser journeys from simple page or HTTP checks. If you depend on Playwright fixtures, package support, or full test suites, verify compatibility with your hardest existing checks.
Decide whether monitors should live in Git, a Terraform configuration, a vendor UI, or a recorder. A friendly UI can broaden ownership, while code-first checks are easier to review and reuse with application tests.
A screenshot proves that a journey failed; traces, logs, infrastructure metrics, and deployment context explain why. Broader observability platforms usually have the advantage here.
Public probes are sufficient for internet-facing applications. Internal services require private locations, self-hosted probes, or a fully self-managed platform.
Check whether the product stops at notifications or also provides rotations, escalations, status pages, and incident timelines. Bundling is useful only if your team will use those layers.
Model cost using actual check frequency, number of locations, retries, browser duration or steps, retention, users, and adjacent telemetry. A low entry price can be misleading when each dimension has a separate meter.
1. Grafana Cloud
Best for: Teams already invested in Grafana, Prometheus, and k6
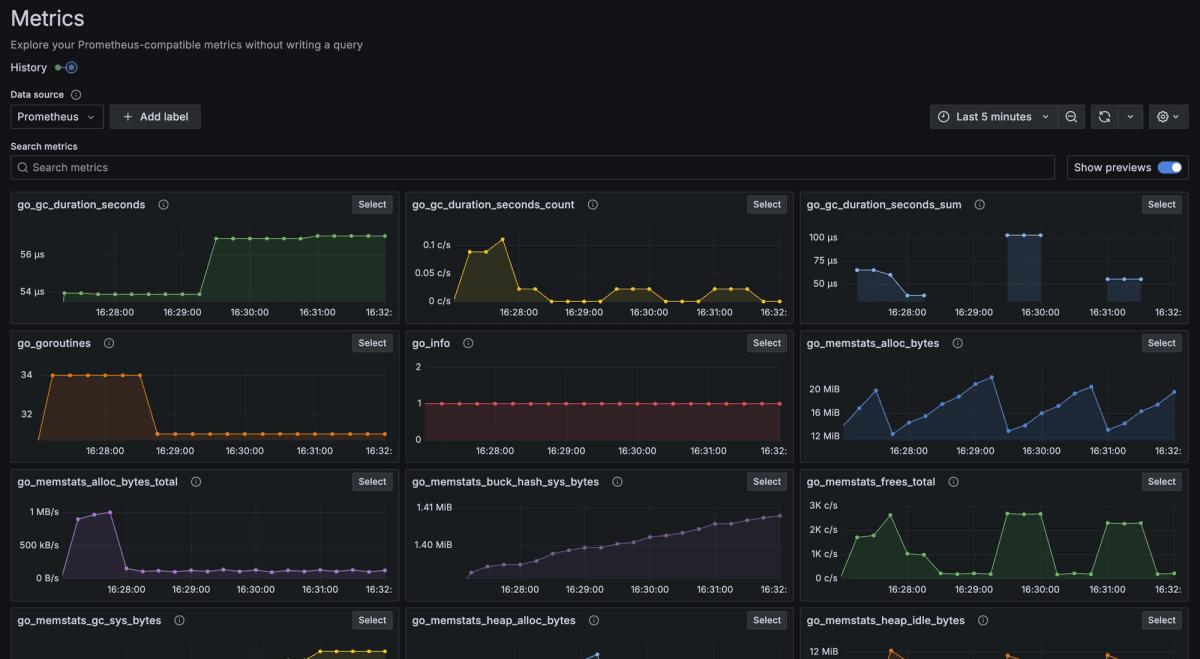
Grafana Cloud Synthetic Monitoring is the strongest code-first alternative for teams that prefer k6. It supports HTTP, DNS, TCP, traceroute, multi-HTTP, k6 scripted, and k6 browser checks. Browser checks use the open-source k6 engine and JavaScript, and the same script can feed a performance-testing workflow.
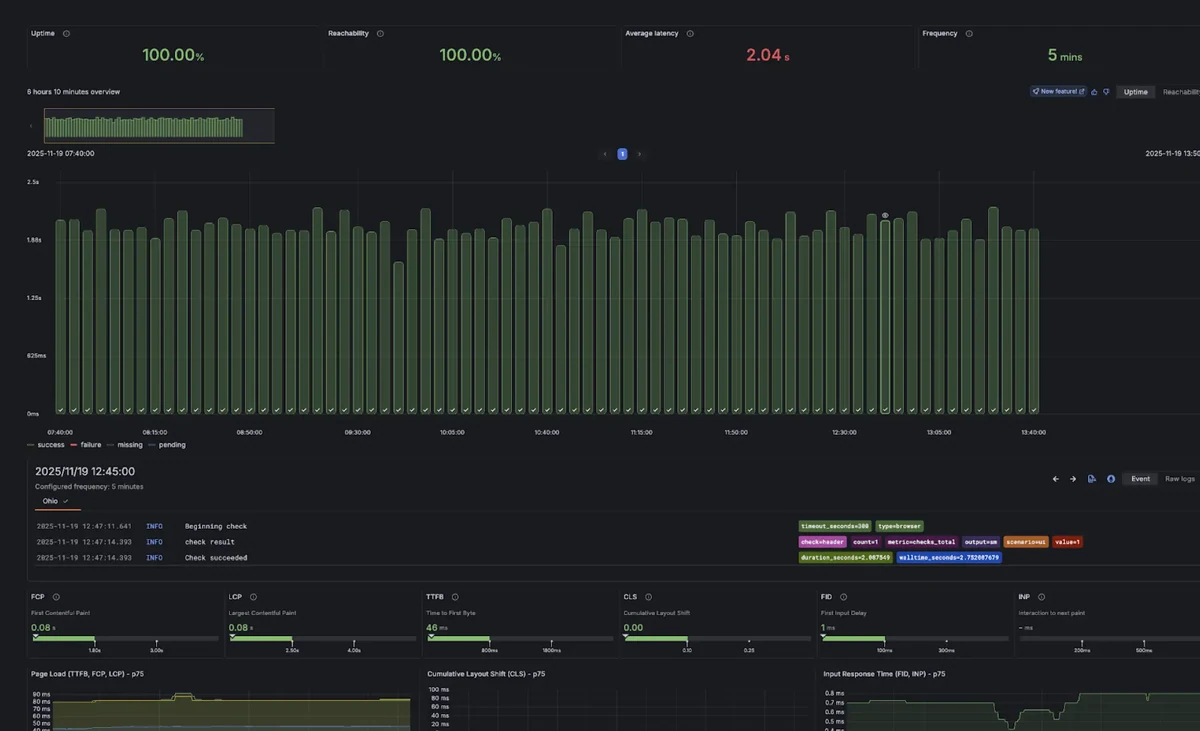
Check results arrive as metrics and logs in the Grafana ecosystem, so existing dashboards and alerting practices carry over. Checks and probes can be managed through Terraform, Grizzly, or the API, and private probes cover internal targets. The tradeoff is stack complexity: Grafana's flexibility comes with multiple backends and query patterns, while k6 browser scripts are not a drop-in replacement for Checkly's Playwright tests.
Grafana Cloud pricing includes monthly API and browser execution allowances. Usage grows by test, probe location, frequency, and rounded execution duration, making long browser runs across many probes the main surprise-cost driver. A permanent free tier and self-service paid plan are public.
Worth exploring if: Your team already operates Grafana and k6 and wants synthetic results to use the same metrics, logs, dashboards, and alerts.
Give it a pass if: You need direct Playwright suite reuse or want a purpose-built synthetic product without Grafana's broader operational surface.
2. Better Stack
Best for: Teams that want synthetic monitoring and incident response in one purchase
Better Stack combines external monitoring with native on-call, incident management, and status pages. Its Playwright monitors execute code-based browser scenarios, and failure artifacts, screenshots, alerting, and multi-location checks stay inside the same workflow. That is a meaningful difference for a small platform team that would otherwise connect Checkly to separate paging and status-page products.
The product also covers HTTP and network checks, provides a Terraform provider, and supports short check intervals. Its center of gravity is operations rather than test-suite reuse: it is a better fit for a team buying an end-to-end response workflow than for one treating production checks as an extension of a large Playwright repository.
Pricing combines responder licenses, monitor bundles, and Playwright execution minutes. This is reasonably easy to estimate when the number of responders and browser duration are stable, but high-frequency or long transactions increase consumption, and the responder layer is poor value if you already have on-call elsewhere. A free plan covers basic monitoring, while paid browser minutes and responder access are publicly documented.
Worth exploring if: Consolidating Playwright checks, paging, incident coordination, and status communication would remove multiple tools from your stack.
Give it a pass if: You already have mature incident tooling or need Checkly's deeper monitoring-as-code and Playwright suite workflow.
3. Dash0
Best for: OpenTelemetry users replacing Checkly's HTTP and API monitoring rather than browser journeys
Dash0 is an OpenTelemetry-native observability platform whose synthetic monitoring currently focuses on periodic HTTP requests. Checks can validate method, headers, parameters, authentication, body, status, and timing from multiple locations, with parallel or round-robin execution. They can also be managed as code through the Dash0 Kubernetes Operator, Terraform provider, or CLI.
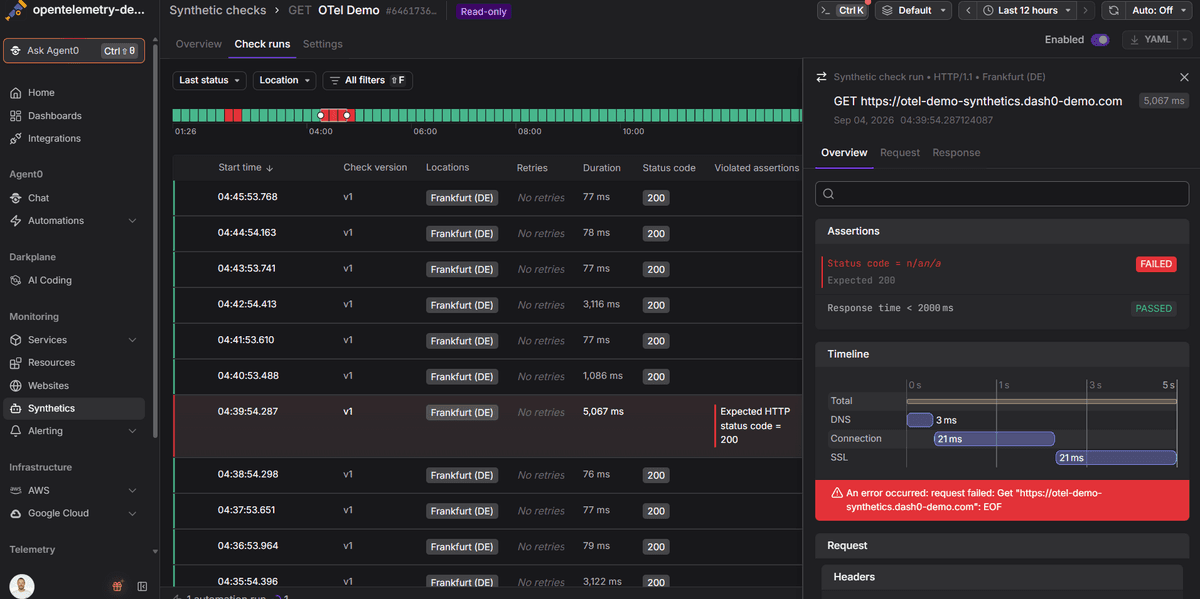
The useful distinction is what happens after a check fails. Synthetic availability and timing data live beside the same services' logs, metrics, and traces, and synthetic timing metrics are not billed separately. OTLP-based instrumentation remains portable, though queries, alerts, dashboards, retention choices, and investigation workflows can still create switching costs.
Dash0 pricing bills synthetic API check runs per thousand, plus any ingested spans, logs, metric points, and web events. There is no base platform charge or per-seat fee for observability, and a 14-day free trial is available. The hard limitation is equally clear: the current synthetic workflow is HTTP/API-focused, not a replacement for Checkly's multi-step Playwright browser checks.
Worth exploring if: Your checks primarily validate APIs and you want failures investigated in an OTel-native telemetry platform.
Give it a pass if: Scripted browser journeys, visual steps, status pages, or native on-call are non-negotiable.
4. New Relic
Best for: Application teams wanting mature synthetics inside a broad observability platform
New Relic Synthetics offers ping, simple browser, scripted browser, and scripted API monitors. Its scripted monitors can exercise customer-facing or internal applications, and containerized private locations bring execution behind a firewall. Results are queryable with New Relic's query language (NRQL) alongside Application Performance Monitoring (APM), browser monitoring, logs, and infrastructure data.
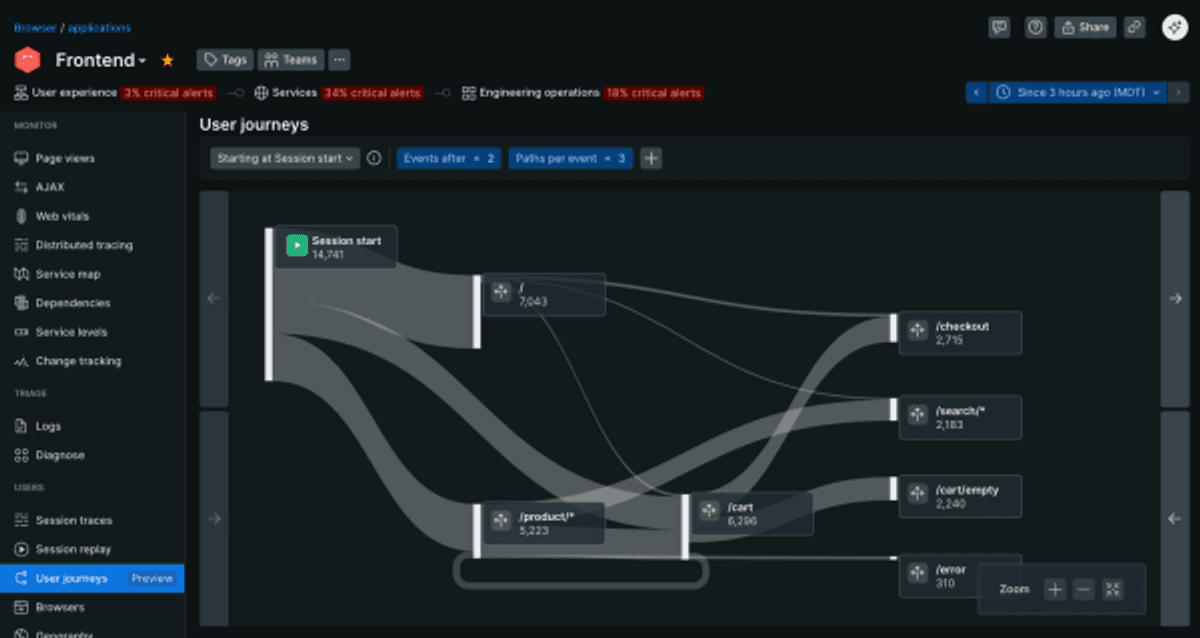
This breadth makes New Relic a credible consolidation choice, especially for teams already using its application monitoring. The main migration caveat is authoring compatibility: scripted browser monitoring uses New Relic's JavaScript runtime and Selenium-oriented APIs, so existing Playwright checks require adaptation. The UI, NRQL queries, entities, and alerts also remain vendor-specific even when telemetry arrives through OpenTelemetry.
Pricing is based mainly on data ingest and user or compute access, with additional synthetic checks sold beyond the allowance included in an edition. New Relic's free tier includes 500 synthetic checks per month and does not require a credit card; higher use must be modeled together with telemetry volume and full-platform users.
Worth exploring if: You already use New Relic and want synthetic results inside the same application-centric troubleshooting workflow.
Give it a pass if: Preserving Playwright tests with minimal rewriting is more important than consolidating your observability vendor.
5. Sematext
Best for: Teams that want direct browser and HTTP coverage with per-monitor pricing
Sematext Synthetics provides HTTP monitors and browser monitors for single pages or multi-page journeys. Browser scripts run in isolated Chrome environments, support Playwright assertions, and collect screenshots, console errors, Web Vitals, and resource waterfall data. Private agents can run both HTTP and browser monitors from Docker inside your network.
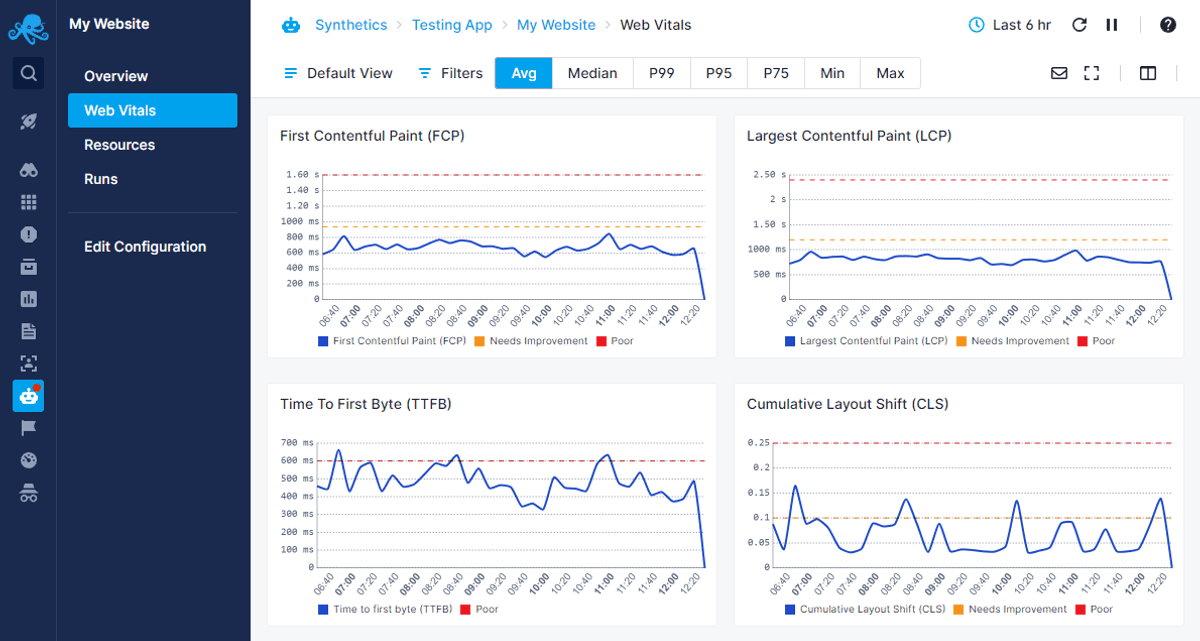
Compared with Checkly, Sematext is less centered on Git-driven monitoring as code, but its API can create and edit both monitor types. It is a practical choice when the number of monitors is stable and the team values performance evidence more than Playwright suite reuse. Be sure to validate runtime compatibility and cadence: browser monitor intervals start at five minutes, which rules out aggressive sub-minute browser coverage.
Sematext pricing is primarily based on the number of HTTP and browser monitors plus retention, rather than every scheduled execution. That makes spend easier to forecast for high-frequency checks, though each app can have its own plan and retention settings. Public pricing and a 14-day no-card trial are available.
Worth exploring if: Predictable per-monitor billing and built-in browser performance evidence matter more than a deep monitoring-as-code workflow.
Give it a pass if: You need sub-five-minute browser checks or want to deploy a large existing Playwright suite without adaptation.
6. OneUptime
Best for: Teams that want an open-source, self-hosted monitoring and incident stack
OneUptime combines website and API monitoring, Playwright-compatible synthetic scripts, alerting, on-call, incidents, and status pages. The synthetic runtime exposes an allowlisted Playwright surface rather than unrestricted Node.js, which improves isolation but means scripts using browser launch methods, Chrome DevTools Protocol (CDP) sessions, filesystem paths, or unsupported packages need changes.
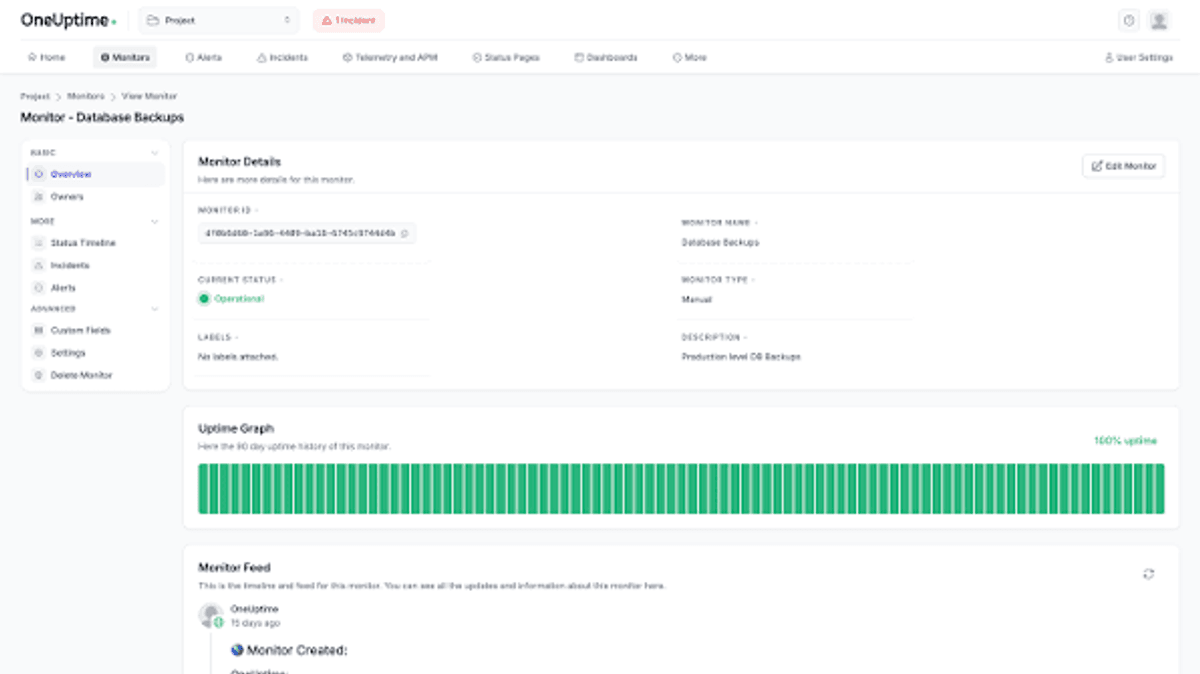
Deployment control is the reason it belongs on this shortlist. The Apache-2.0 project can be self-hosted with Docker Compose or Kubernetes, while OneUptime Cloud provides the managed path. That makes it attractive for data-residency requirements or organizations that want one open-source system for monitoring and incident response. The tradeoff is ownership: self-hosting transfers upgrades, high availability, backups, scaling, and probe reliability to your team.
Cloud pricing combines user tiers with pay-as-you-go active monitors and separate SMS or call usage; public prices and a free plan are available. Self-hosting removes the software subscription but not the infrastructure and engineering cost.
Worth exploring if: Deployment control, open source, and a bundled incident lifecycle outweigh the convenience of a focused managed service.
Give it a pass if: You want a fully managed global synthetic network or your checks require the unrestricted Playwright and Node.js surface available in Checkly.
7. Datadog
Best for: Enterprises consolidating synthetics and full-stack observability in Datadog
Datadog is the broad-platform choice. Its Synthetic Monitoring product supports API, browser, network-path, and mobile application tests, while browser tests can run across managed or private locations, browsers, and device profiles. The main advantage over a focused service is correlation: the same platform can hold the failed test, frontend errors, Application Performance Monitoring (APM) traces, logs, and infrastructure telemetry.
Browser tests can be recorded without code, managed through the API, or provisioned with Terraform. That makes ownership accessible to mixed engineering and operations teams, although the workflow is less naturally centered on reusable Playwright suites than Checkly's. Datadog's proprietary dashboards, queries, and cross-product workflows also create more switching work than the instrumentation alone suggests, and its per-product, per-volume metering gives Datadog less incentive to help you reduce the data you send it.
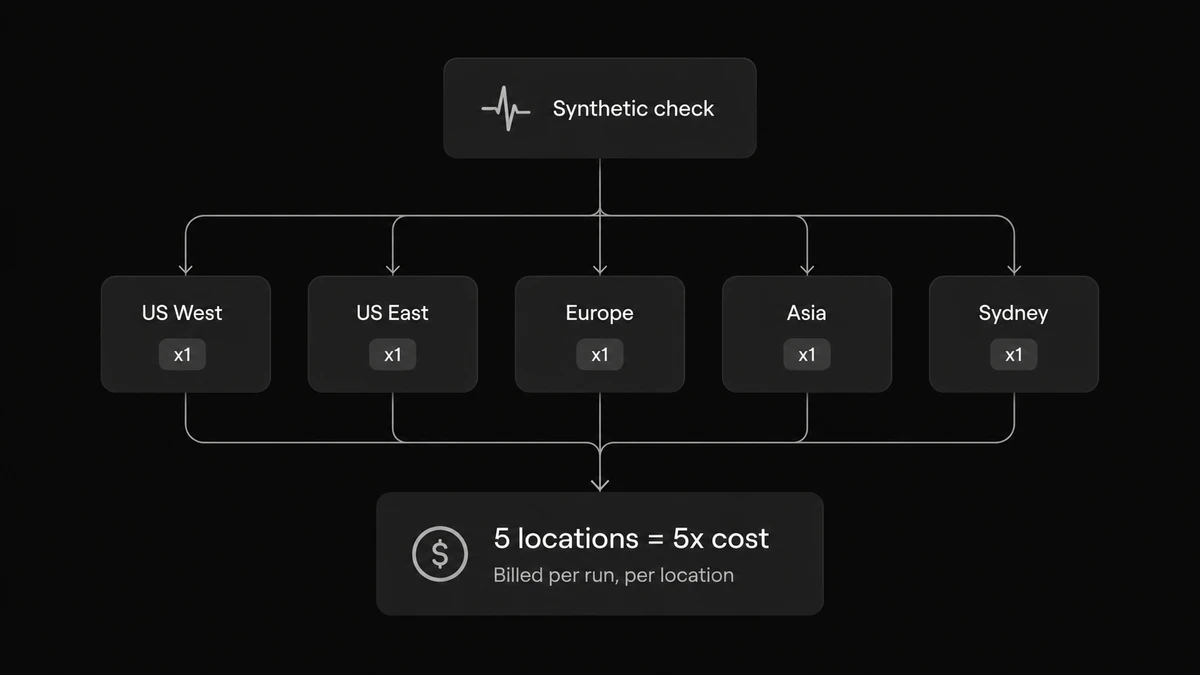
Pricing meters browser runs and API runs separately; long browser scenarios can count as multiple runs, and every selected location and device multiplies executions. Public pricing and a free trial are available, but forecasting total spend also requires modeling the other Datadog products used for correlation.
Worth exploring if: Your organization already uses Datadog and reducing time from failed journey to root cause matters more than keeping synthetics standalone.
Give it a pass if: You want a focused Playwright monitoring workflow or do not want separate meters across a broad proprietary platform.
Comparison table
The full write-ups above cover context and caveats; this table lines up the same seven tools on browser approach, pricing model, deployment, and the single biggest tradeoff for each.
| Tool | Best fit | Browser approach | Pricing model | Deployment | Main tradeoff |
|---|---|---|---|---|---|
| Grafana Cloud | Grafana and k6 teams | JavaScript on the k6 browser engine | Executions by probe and rounded duration | SaaS with private probes | Not direct Playwright reuse; Grafana stack complexity |
| Better Stack | Monitoring plus incident response | Hosted Playwright transaction checks | Responders, monitor bundles, and Playwright minutes | SaaS | Less suited to large test-suite reuse |
| Dash0 | OTel-native API observability | HTTP/API checks only | API check runs plus telemetry consumption | SaaS | No scripted browser journeys, on-call, or status pages |
| New Relic | Application-centric consolidation | JavaScript/Selenium scripted browsers | Data, users or compute, plus excess checks | SaaS with private locations | Existing Playwright tests require adaptation |
| Sematext | Predictable synthetic coverage | Scripted Chrome checks with Playwright assertions | Monitors and retention | SaaS with Docker private agents | Five-minute minimum browser interval |
| OneUptime | Open-source deployment control | Allowlisted Playwright-compatible runtime | Cloud users, active monitors, and alerts; self-host free | SaaS or self-hosted | You operate the platform, or accept a smaller managed ecosystem |
| Datadog | Enterprise platform consolidation | Recorded browser tests across browsers and devices | API and browser runs plus adjacent product meters | SaaS with private locations | Broad proprietary product and billing surface |
Final thoughts
The best Checkly alternative depends on which part of Checkly you are actually replacing. Datadog and New Relic make the strongest case when synthetic failures should open directly into a full observability investigation. Grafana Cloud is the natural code-first option for k6 shops, while Better Stack is more compelling when on-call and status communication are part of the purchase. Sematext favors predictable monitor-based billing, and OneUptime trades managed convenience for open-source deployment control. Dash0 sits in a narrower but useful position: API checks and OpenTelemetry telemetry share one investigation surface, but browser-heavy teams should shortlist a different product.
Before migrating, export a representative set of checks and test the awkward cases: authentication, secrets, fixtures, custom packages, multi-region scheduling, retries, private targets, screenshots, alert routing, and CI deployment. Then model a month of real executions using locations, frequency, browser duration or step count, retention, seats, and the telemetry you will ingest for root-cause analysis. If your current Checkly footprint is mostly HTTP/API checks and the missing piece is fast correlation with OTel-native traces, logs, and metrics, a 14-day Dash0 free trial is a practical way to validate that workflow without pretending it replaces Playwright browser monitoring. No credit-card required.