- 16 min read
6 Best Axiom Alternatives in 2026
Axiom is a managed telemetry platform for logs, traces, metrics, and other timestamped events. It suits developer-led and platform teams that want serverless ingestion and fast ad hoc analysis without operating the backend. Its clearest strengths are flexible event analytics, APL (Axiom Processing Language) for logs, traces, and events, MPL (Metrics Processing Language) for metrics, native ingestion over OTLP, the OpenTelemetry Protocol, and usage-based billing that separates data loading, storage, and query compute.
Axiom alternatives become interesting when one of those design choices is the mismatch. Some teams want one query mental model across signals, incident response or RUM (real user monitoring) in the same suite, a larger enterprise integration surface, or self-hosted control. Others want cost to follow bytes, events, hosts, or telemetry records rather than query compute. The best replacement depends less on a feature checklist than on which boundary you want to move: investigation workflow, platform scope, deployment ownership, or billing exposure.
Quick picks
If you already know which boundary matters most, start here and jump to the matching section for the detail.
| Tool | Best fit |
|---|---|
| Better Stack | Lean product teams that want telemetry, uptime, on-call, and status pages together |
| Dash0 | Cloud-native teams standardizing on OpenTelemetry and a PromQL-oriented workflow |
| Grafana Cloud | Grafana and Prometheus teams that want managed backends without abandoning familiar workflows |
| Honeycomb | Trace-heavy teams debugging high-cardinality application behavior |
| Elastic Observability | Search-centric organizations that need flexible deployment and data control |
| SigNoz | Teams that want an OpenTelemetry-native platform they can self-host |
What to look for in an Axiom alternative
-
OpenTelemetry instrumentation can usually keep emitting OTLP to a new backend, but migrating APL and MPL queries, monitors, dashboards, retention rules, and role definitions is still manual work.
-
Decide whether your engineers work best with event search, SQL, high-cardinality visual analysis, PromQL-style exploration, or separate languages for each signal. Query retraining often costs more than switching the collector endpoint.
-
A log-led team may value fast search and retention most. A platform team replacing Axiom across every signal should also validate trace navigation, metric cardinality, service maps, Kubernetes context, alerting, and frontend monitoring.
-
Managed services take database operations off your plate. Self-hosted options hand you control over residency, retention, and infrastructure, and with it the scaling, upgrades, backup, and query performance.
-
Model your workload in the vendor's actual units. Event count, enriched bytes, active series, host hours, indexed logs, telemetry records, retention, and query scans behave very differently under bursty traffic.
-
If Axiom currently feeds a separate on-call, status-page, SIEM (security information and event management), or RUM tool, a broader suite may remove integrations, but that convenience can also widen the contract and make total cost harder to attribute.
1. Better Stack
Best for: Lean product teams that want observability and incident workflows in one service
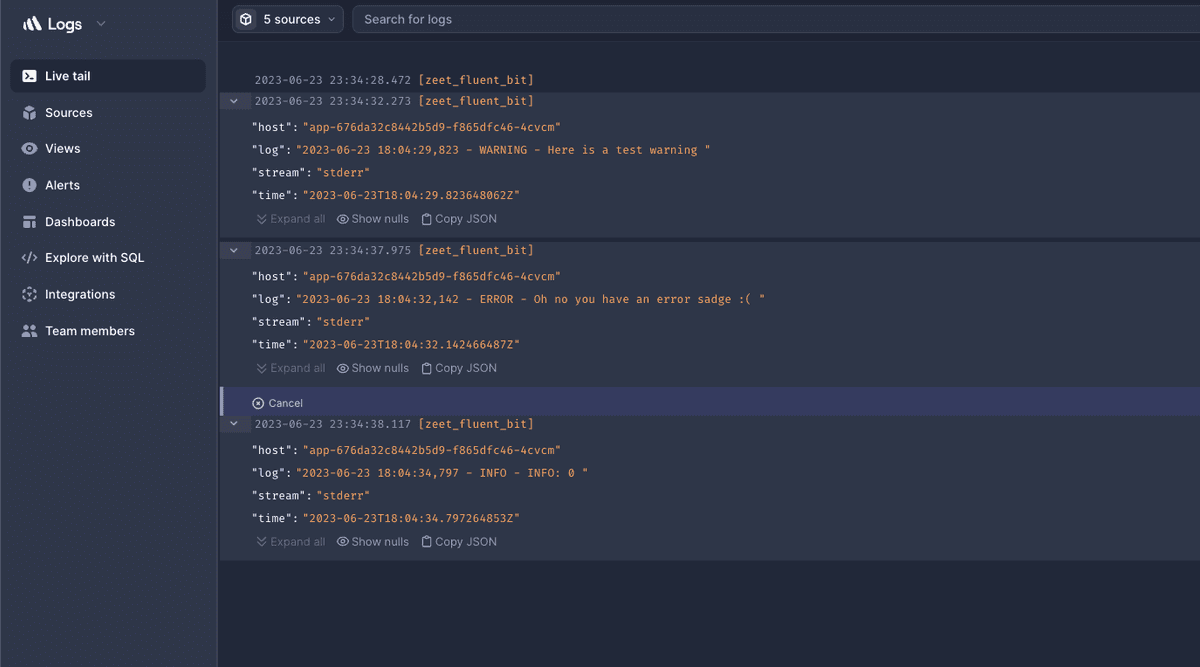
Better Stack is the closest operational substitute for teams that like Axiom's low-friction, developer-facing feel but want more of the reliability workflow under one roof. It accepts logs, metrics, and traces over OpenTelemetry, stores telemetry in a ClickHouse-backed warehouse, and lets teams investigate with a visual builder, PromQL, or SQL. Uptime checks, on-call scheduling, incident management, and status pages live alongside the telemetry product.
The advantage is consolidation: a small team can move from a log or trace finding to paging and customer communication without wiring together several vendors. Pricing separates log and trace ingestion from retention, includes standard queries, and exposes a free plan; accelerated query scans, responders, monitors, and enterprise controls are additional dimensions. That is easy to understand for a telemetry-only deployment, but a full Better Stack rollout should be modeled as several meters rather than one observability rate.
Worth exploring if: You want a managed Axiom alternative with familiar SQL and built-in operational response tools.
Give it a pass if: Deep distributed-system analysis matters more than integrated uptime, on-call, and status communication.
2. Dash0
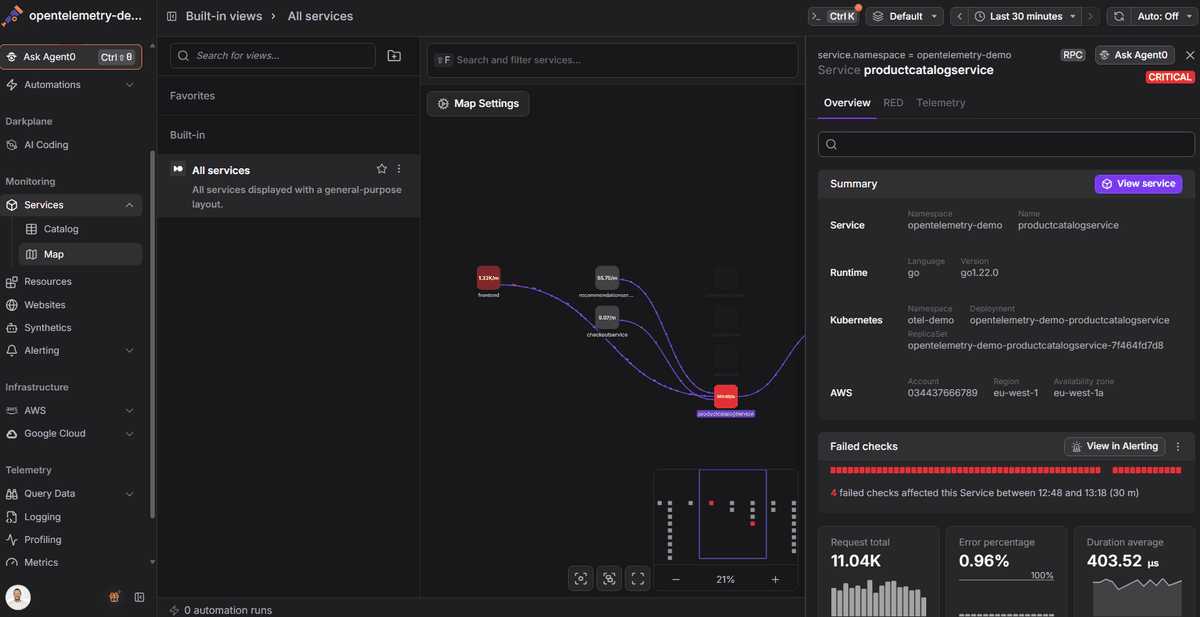
Best for: Cloud-native teams using a backend migration to standardize on OpenTelemetry
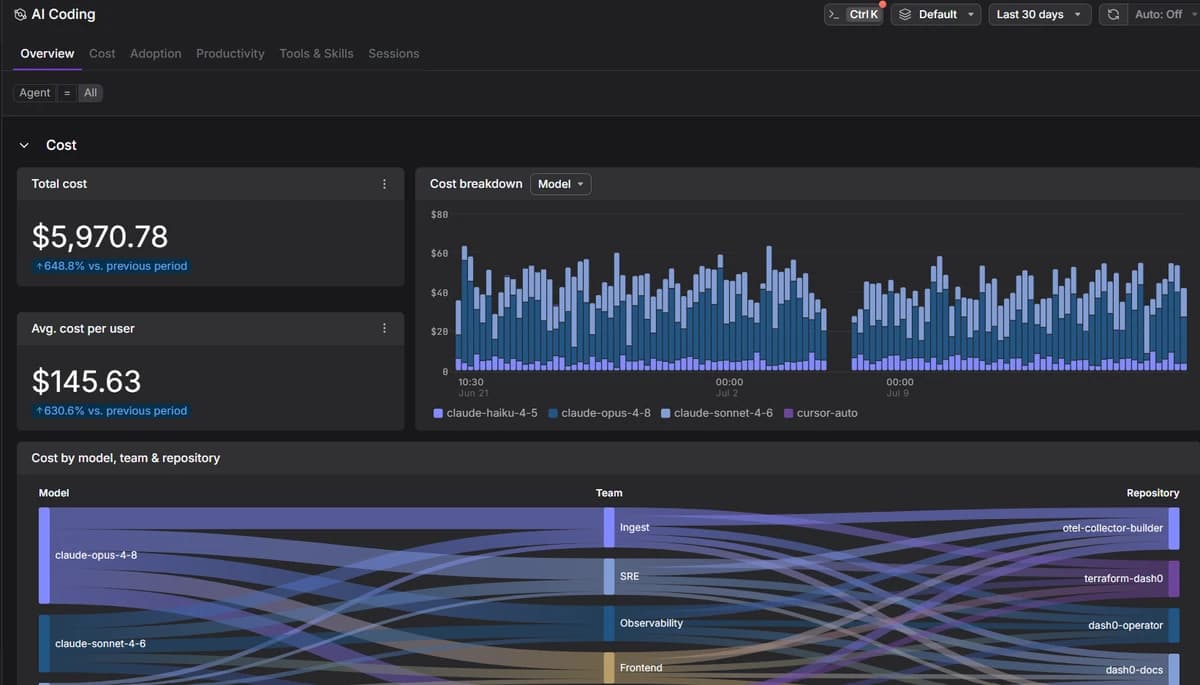
Dash0 is an OpenTelemetry-native observability platform for logs, metrics, traces, infrastructure, Kubernetes, browser telemetry, continuous profiling, and synthetics. Its visual query builder is PromQL-oriented across services and signals, so teams can move from guided exploration to editable queries and then reuse the result in dashboards or checks. OpenTelemetry resources, semantic conventions, and trace context provide the shared correlation model rather than a vendor-specific agent schema. On top of that data model, Agent0 is Dash0's agentic AI layer for investigating incidents and answering observability questions directly against the live environment.
Pricing follows the telemetry sent and stored: metric data points, spans, log records, web events, and synthetic runs. All features sit in one plan without per-seat or base-platform fees, and budget forecasts plus OTTL-exportable spam filters help control noisy ingestion. A 14-day unlimited trial is public. The real caveat is instrumentation coverage: Dash0's Kubernetes operator only auto-instruments supported runtimes; heterogeneous estates should validate each runtime and expect to keep upstream OpenTelemetry SDKs where necessary.
Worth exploring if: Portable instrumentation, consistent cross-signal context, and predictable record-based billing matter most.
Give it a pass if: You expect one agent to auto-instrument every runtime in a heterogeneous legacy estate without retaining upstream OpenTelemetry SDKs.
3. Grafana Cloud
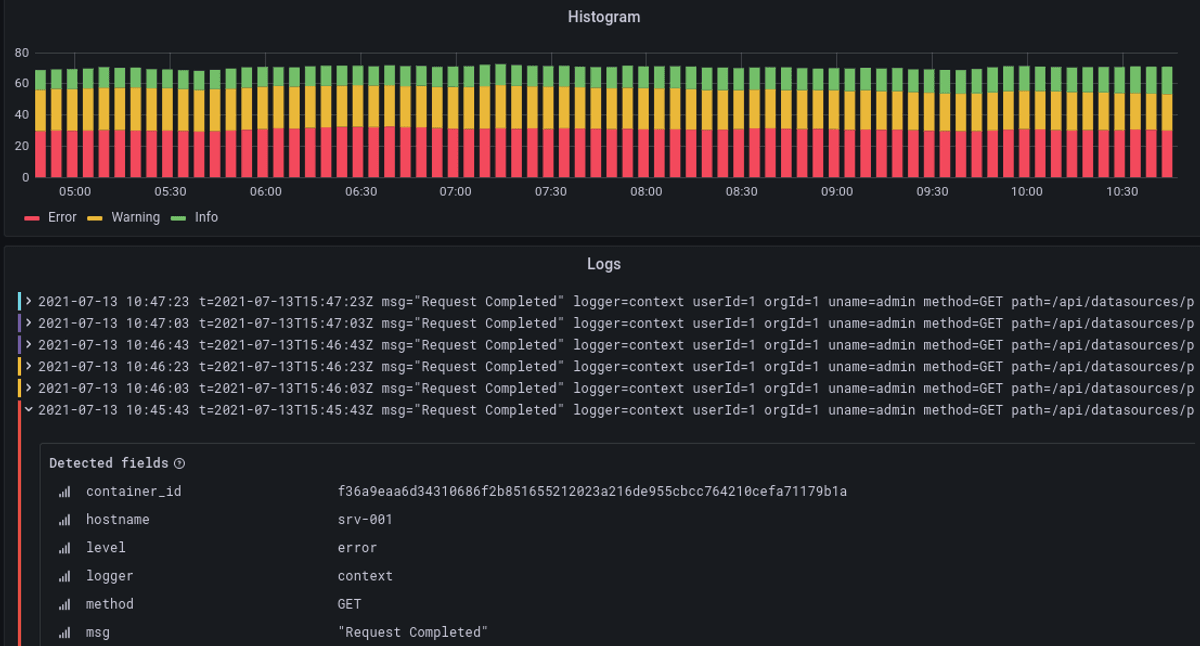
Best for: Teams already fluent in Grafana, Prometheus, and the wider open-source observability ecosystem
Grafana Cloud is a managed path to the Grafana stack. Its OTLP endpoints route metrics, logs, traces, and profiles to the appropriate managed backends, while Grafana supplies dashboards, exploration, alerting, and application-observability views. This is a strong fit when PromQL dashboards and Grafana operating habits are already organizational standards.
The flexibility comes with more concepts than Axiom. Engineers may move among PromQL, LogQL, and TraceQL, and the underlying signals retain distinct backend and query semantics. Billing is similarly modular: Grafana Cloud uses product-specific units, including active series and data points per minute for metrics; processed, written, retained, and sometimes queried GB for logs and traces; plus active users or host hours for some products. A free tier and an unbilled trial make a representative proof of concept practical. Teams that want to keep the Prometheus model but offload backend operations can compare notes in this guide to Prometheus monitoring.
Worth exploring if: You want managed operations while preserving Grafana dashboards, Prometheus conventions, and ecosystem flexibility.
Give it a pass if: Replacing Axiom is meant to reduce the number of query languages, signal backends, and billing dimensions your team must understand.
4. Honeycomb
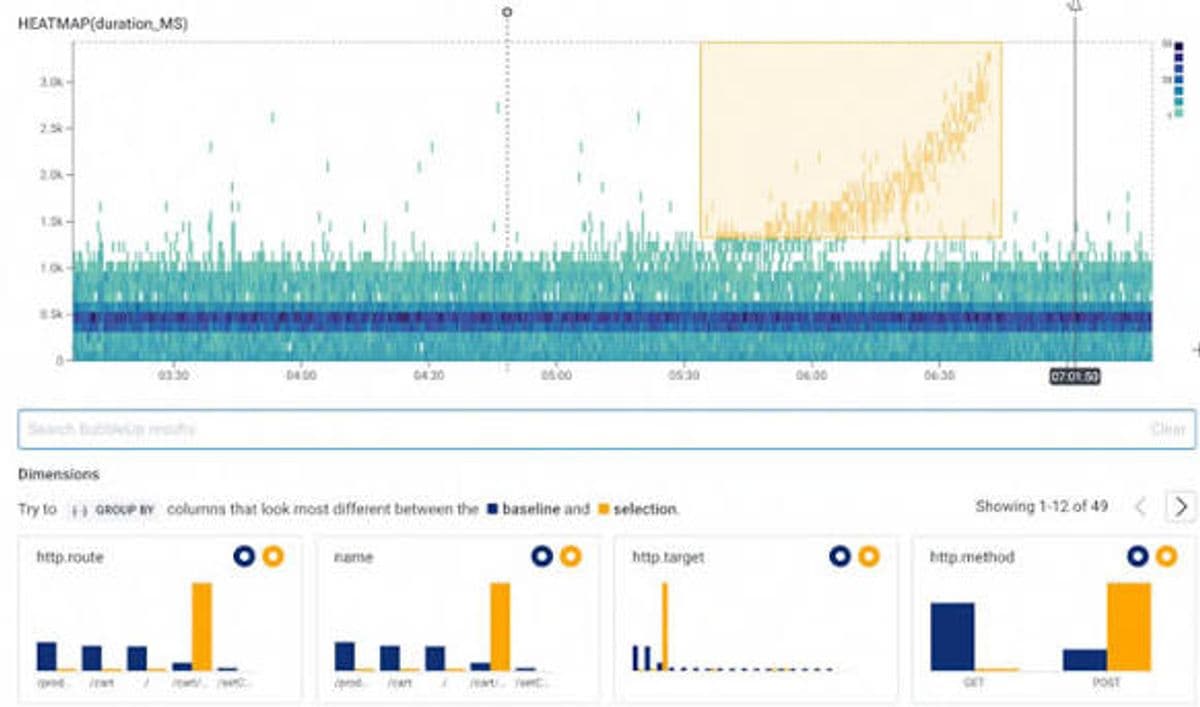
Best for: Application teams investigating novel failures in high-cardinality distributed systems
Honeycomb is the strongest choice here for exploratory debugging. It accepts OTLP, models telemetry as rich events, and uses tools such as BubbleUp to compare an anomalous subset with the baseline and surface the dimensions that explain the difference. That workflow is especially effective when traces carry customer, endpoint, build, region, or feature-flag context.
The same emphasis makes Honeycomb less direct for teams that use Axiom primarily as a raw-log search engine. Honeycomb accepts unstructured logs, but its own documentation warns that an opaque message field is harder to filter and query; structuring logs before ingestion is what unlocks its analysis model. Public pricing exposes free and paid plans around event volume and metric data points, with unlimited seats and querying. Event growth, not investigative curiosity, is the main cost variable, so noisy spans and logs still need filtering or sampling discipline.
Worth exploring if: Your engineers ask “what is different about the bad requests?” more often than they grep message strings.
Give it a pass if: Your dominant workload is long-retention, unstructured log search with minimal collector-side transformation.
5. Elastic Observability
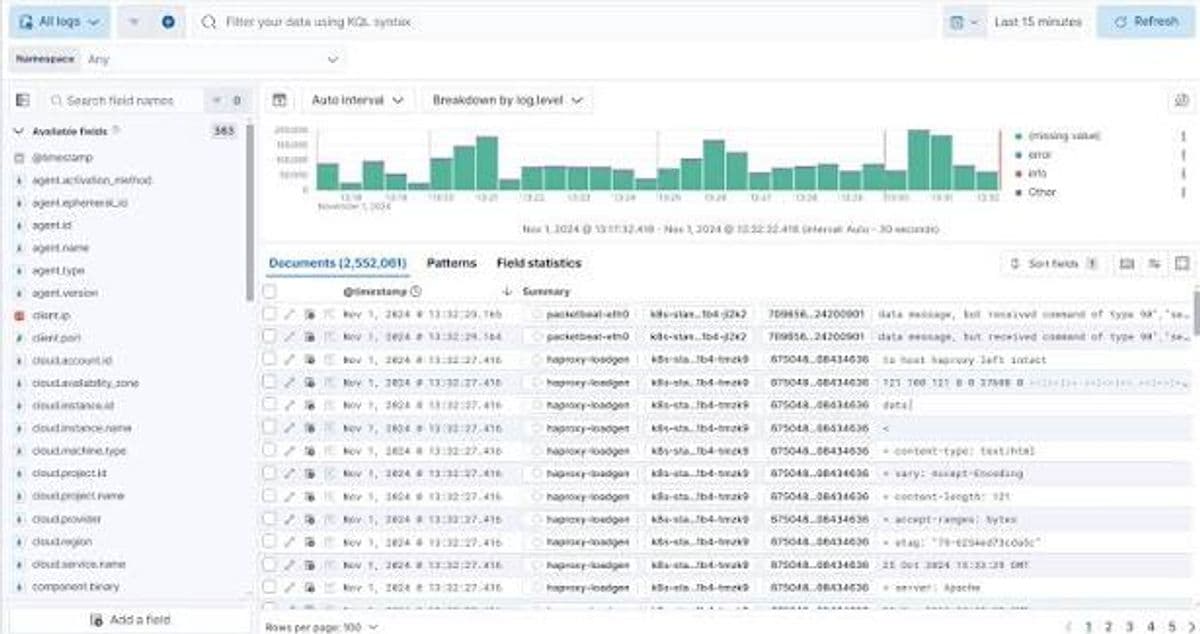
Best for: Search-heavy environments that value deployment choice, retention control, or proximity to security analytics
Elastic Observability turns Elasticsearch and Kibana into a platform for logs, metrics, traces, APM, RUM, synthetics, and alerting. Its search and aggregation depth makes it a natural Axiom alternative for organizations already using Elastic, while native OpenTelemetry support gives new deployments a standards-based ingestion path. Buyers can choose a fully managed serverless project, hosted clusters, or a self-managed stack.
Deployment choice is the advantage and the caveat. Elastic Cloud Serverless removes cluster sizing and scales the service, while self-managed Elastic gives you control and responsibility for Elasticsearch, Kibana, and optional components. Serverless Observability bills by ingest and retained GB; notably, usage is measured after enrichment and normalization but before compression, so do not estimate it from compressed index size. Public pricing and a 14-day cloud trial are available.
Worth exploring if: Search flexibility, data-tier control, security adjacency, or self-managed deployment outweighs simplicity.
Give it a pass if: You are leaving Axiom specifically to minimize platform administration and query-model complexity.
6. SigNoz
Best for: Teams that want an OpenTelemetry-native platform on infrastructure they control
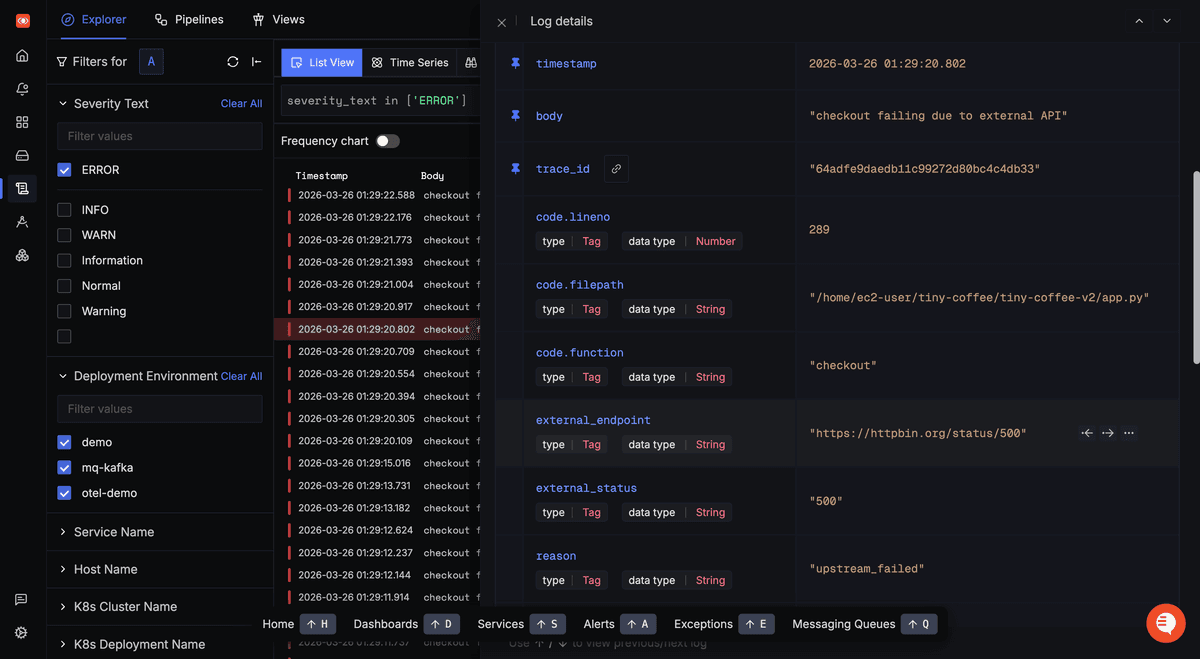
SigNoz is an open-source observability platform built around OpenTelemetry and ClickHouse. It brings logs, metrics, traces, APM, dashboards, and alerts into one application, with a visual query builder across all three signals and PromQL or ClickHouse SQL available for deeper dashboard work. That makes it the most direct self-hosted option on this shortlist for a team replacing Axiom rather than merely replacing its log store.
The trade is operational ownership. Self-hosting means your team owns ClickHouse capacity, persistent storage, upgrades, backup, and the behavior of the OpenTelemetry pipeline; those costs do not disappear because the application code is open source. SigNoz Cloud removes that work and publishes usage-based pricing, with logs and traces metered by GB and metrics by data-point count, but then the deployment-control advantage narrows. A free cloud start and the self-hosted Community Edition make evaluation accessible.
Worth exploring if: Data control and self-hosting justify operating the storage and ingestion plane.
Give it a pass if: The reason you chose Axiom was to keep observability database operations entirely off your team's pager.
Comparison table
Here is how the six alternatives line up side by side on query model, cost drivers, and deployment tradeoffs.
| Tool | Best fit | Query model | Main cost drivers | Deployment and main tradeoff |
|---|---|---|---|---|
| Better Stack | Lean reliability teams | Visual builder, SQL, PromQL | Ingested and retained data; responders and add-ons | Managed; telemetry depth competes with workflow breadth |
| Dash0 | OpenTelemetry-first cloud teams | Visual builder and PromQL-oriented queries | Telemetry records, data points, and synthetic runs | Managed; validate runtime auto-instrumentation coverage |
| Grafana Cloud | Grafana and Prometheus users | PromQL, LogQL, TraceQL | Active series/DPM, processed and stored GB, users, host hours | Managed; flexible but multi-backend |
| Honeycomb | High-cardinality debugging | Event queries, heatmaps, BubbleUp | Events and metric data points | Managed; best when telemetry is structured |
| Elastic Observability | Search and data control | ES | QL, KQL, visual tools | Enriched ingest, retention, or provisioned/self-hosted resources |
| SigNoz | Self-hosted OpenTelemetry teams | Visual builder, PromQL, ClickHouse SQL | Cloud ingest or your own infrastructure and operations | Cloud or self-hosted; control comes with ClickHouse ownership |
Final thoughts
The Axiom alternative market splits into four useful camps. Better Stack emphasizes workflow consolidation; Grafana Cloud preserves an ecosystem with separate signal backends; Honeycomb optimizes for high-cardinality behavioral debugging; and Elastic or SigNoz trade simplicity for data-platform control. Dash0 takes a different middle path: managed operations with OpenTelemetry as the correlation and instrumentation foundation. None is universally better than Axiom. Each changes what engineers must learn, what the platform team must operate, and which unit turns telemetry growth into spend.
Before replacing Axiom, dual-write representative OTLP traffic and rebuild a small but difficult set of APL and MPL queries, monitors, and dashboards. Measure investigation speed, p95 query latency, retention behavior, alert fidelity, and the work needed to preserve service and trace context. Then model the same traffic in the candidate's billable units, including post-enrichment bytes, active series, indexed events, host hours, or record counts, and verify data residency, RBAC (role-based access control), runtime instrumentation, and export paths. If that exercise points toward a managed OpenTelemetry and PromQL-oriented workflow, the Dash0 free trial is a practical way to test the migration with real telemetry. No credit-card required.