

If you are evaluating SolarWinds Observability alternatives, you are probably in one of two camps. Either the modular SaaS bill has crept past what you budgeted and nobody can explain which SKU drove the jump, or your team has committed to OpenTelemetry and you have discovered that the smoothest path through SolarWinds still runs through its own agent. Both are legitimate reasons to look around.
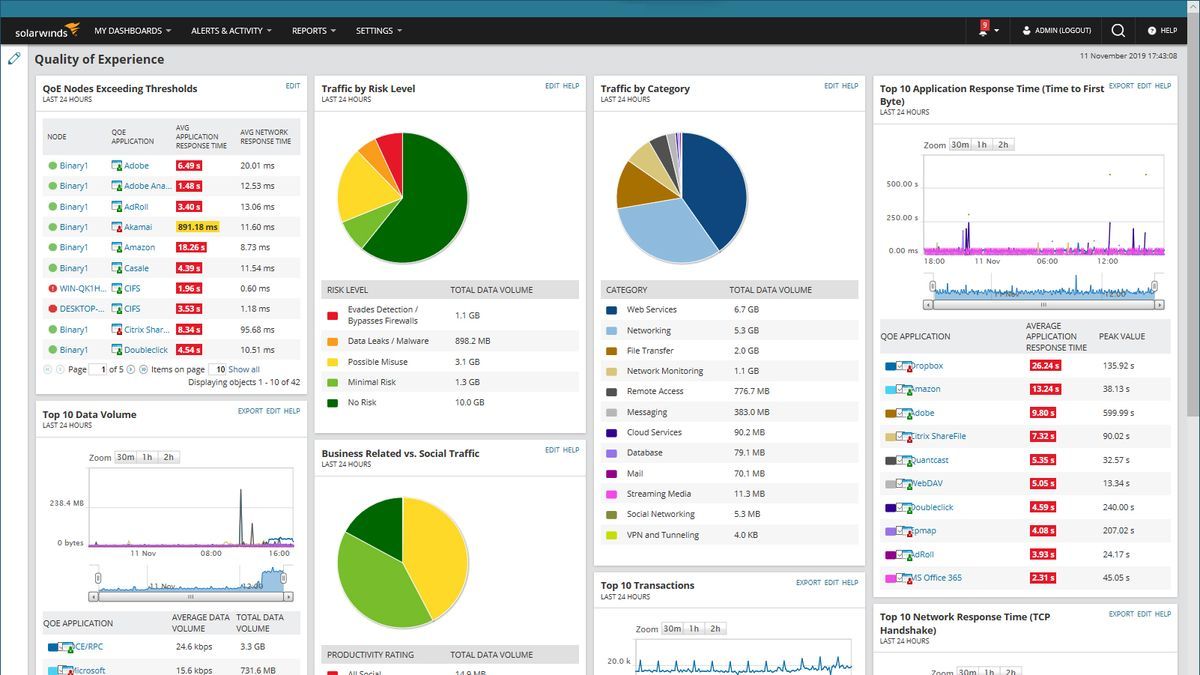 The product itself is capable. SolarWinds Observability SaaS covers network and infrastructure, application performance monitoring (APM), logs, databases, and digital experience monitoring, and it does support direct ingestion of OpenTelemetry Protocol (OTLP) data. What has changed is the context around it. Turn/River Capital took SolarWinds private in a roughly $4.4 billion all-cash deal that closed in April 2025, so the roadmap and pricing now answer to a private-equity owner rather than public shareholders. That is not automatically bad, but it is the kind of ownership change that sends procurement teams to re-check the market at renewal time.
Choosing a replacement is harder than it looks, because "observability platform" now covers products with very different DNA. Some are full-stack commercial suites that do everything and lock you into a proprietary agent and data model. Some are managed builds of open-source projects that keep your data portable but hand you several query languages and storage backends. A smaller group is built natively on OpenTelemetry from the first commit. Each design makes a different trade between breadth, portability, and how the bill scales.
This guide reviews eight alternatives through the lens that matters when you are leaving a broad incumbent: how each one handles OpenTelemetry, how much of SolarWinds' signal coverage it replicates, whether your dashboards and queries travel with you, and, above all, what its pricing model charges you for. Pricing gets model analysis rather than a single quoted number, because the number on a pricing page rarely survives contact with your real telemetry volume.
Replacing SolarWinds Observability does have challenges
The first trap is assuming these products are interchangeable. They are not, and the gaps run in both directions.
SolarWinds carries a decade of network monitoring heritage. Simple Network Management Protocol (SNMP) polling, NetFlow-style traffic analysis, and device-level health for switches, routers, and firewalls are things it does well and that most cloud-native observability platforms simply do not attempt. If your reason for using SolarWinds is a fleet of physical network gear in a hybrid data center, be honest with yourself: several tools on this list will not replace that layer, and you may end up running two systems. That is a real cost, and it belongs in your evaluation up front.
The second trap is treating "supports OpenTelemetry" as a single checkbox. There is a meaningful difference between a platform that ingests OTLP and converts it into a proprietary internal shape, and one that stores and queries OpenTelemetry data as-is. SolarWinds sits in an interesting middle position here. It accepts direct OTLP ingestion from any OTel receiver, but its own documentation notes that data ingested directly this way does not create entities in the platform, and the richer entity-driven experience leans on the SolarWinds agent. Every vendor's OTel story has caveats like this. Read them before you migrate.
The third trap is pricing. SolarWinds SaaS is modular, with separate per-unit meters for application services, network devices and hosts, log gigabytes, database instances, synthetic check bundles, and RUM page views. Modular pricing sounds fair, and it can be, but it forces you to model the exact mix of things you monitor before you can predict a bill. Every alternative here makes a different pricing bet, and the bet interacts with your architecture. Per-host pricing punishes ephemeral containers. Per-GB pricing punishes verbose logs and rich attributes. Per-user pricing quietly limits who gets to see production. Per-signal pricing scales with volume but does not care how many tags you attach.
One more point on lock-in, since every vendor will wave the OpenTelemetry flag at you. OpenTelemetry reduces instrumentation and transport lock-in. It does not eliminate lock-in. Your dashboards, alert rules, saved queries, sampling configuration, role-based access control (RBAC) rules, and investigation workflows all create switching cost even on a fully OTel-native platform. Anyone who tells you a migration is free is selling something.
We evaluate each tool against these criteria:
- Signal coverage: metrics, logs, traces, plus real user monitoring (RUM), synthetics, database, and network depth relative to SolarWinds
- OpenTelemetry stance: native storage vs. OTLP-compatible-then-converted vs. proprietary agent
- Instrumentation and setup: agent auto-instrumentation vs. OTel SDK, and which runtimes are covered
- Query and dashboard portability: one query language or several, and whether dashboards export cleanly
- Cost model: what dimensions the pricing charges on, and how predictable the bill is
- Cost control at scale: sampling, filtering, and cardinality behavior
- AI and automated investigation: what the platform does beyond dashboards
- Operational model: SaaS, self-hosted, or hybrid, and who runs it
How they compare
The table below applies those criteria uniformly. SolarWinds Observability SaaS is included as the reference row so you can see what you are comparing against. Descriptions are factual; opinions live in the entries that follow.
| Tool | Signal coverage | OTel stance | Query & dashboards | Cost model | Best fit |
|---|---|---|---|---|---|
| SolarWinds Observability SaaS (reference) | Network, infra, APM, logs, DB, RUM, synthetics | OTLP ingestion; agent needed for full entity model | Proprietary UI; modular exports | Per-SKU: per service, per device/host, per GB, per DB, per check bundle, per page views | Hybrid IT and network-heavy shops |
| Datadog | Broadest: infra, APM, logs, RUM, synthetics, security, more | OTLP-compatible, converts internally; OTel metrics count as custom metrics | Proprietary query + dashboards | Per-host modules + per-GB logs + custom metrics + add-ons | Teams wanting one vendor for everything, budget managed |
| Dynatrace | Full-stack APM, infra, logs, RUM, synthetics, security | OneAgent-first; OTLP ingestion supported | Proprietary (DQL, Grail); Smartscape topology | DPS consumption: memory-GiB-hour hosts + per-GiB logs + per-session RUM | Large enterprises wanting AI root cause |
| New Relic | Full-stack APM, infra, logs, traces, browser, synthetics | OTLP ingestion, converts to its data model | NRQL; proprietary dashboards | Per-GB ingest + per-seat (Full Platform / Core) | Teams that prefer ingest-based billing, few power users |
| Grafana Cloud | Metrics, logs, traces, profiles, RUM, synthetics, k6 | Strong OTel + Prometheus ingestion | PromQL, LogQL, TraceQL (per signal); portable dashboards | Per active series + per-GB logs/traces + per active user + platform fee | Teams already on Prometheus and the open-source stack |
| Chronosphere | Metrics-first, logs, traces; strong cardinality control | PromQL and OTel ingestion | PromQL; Grafana-style dashboards | Custom quote; credits for useful retained data, not raw ingest | Large cloud-native teams fighting telemetry cost |
| Honeycomb | Traces first, plus metrics (GA 2026) and logs-as-events | OTLP ingestion, converts to event model | Proprietary query, BubbleUp | Per million events + separate metric data points | Trace-heavy debugging of distributed systems |
| Prometheus & Grafana (OSS) | Metrics (Prometheus) + dashboards (Grafana); traces/logs need more projects | Prometheus and OTel native; you run the pipeline | PromQL; portable dashboards | Free software; you pay for infrastructure and engineering time | Teams with a platform team and full-control requirements |
| Dash0 | Metrics, logs, traces, RUM, synthetics | OpenTelemetry-native, no proprietary conversion | PromQL across signals; Perses dashboards | Per million metric data points, spans, and log records; no seats or hosts | OTel-standardized teams wanting a managed backend |
1. Datadog
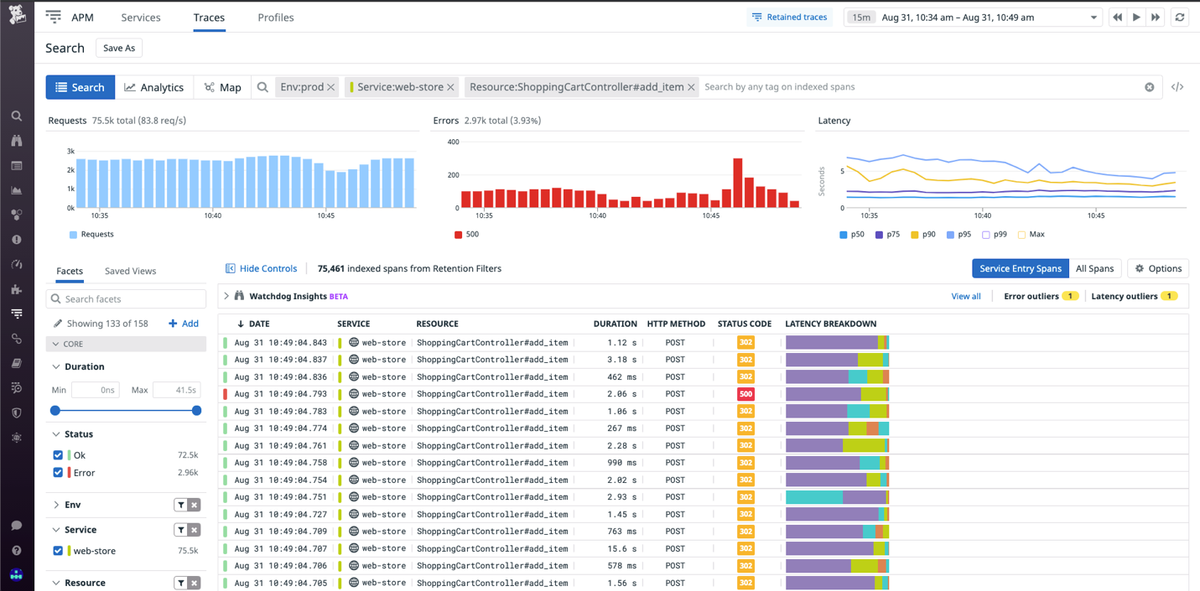
Datadog is the platform most teams benchmark everything else against, and for good reason. It is the broadest commercial observability suite on the market, spanning infrastructure, APM, log management, real user and synthetic monitoring, security, and a long tail of adjacent products. If your goal is to consolidate a dozen tools into one pane of glass and you have the budget to do it, Datadog is the obvious candidate to replace a SolarWinds deployment that has sprawled across modules.
What's good
- Coverage and integrations: With hundreds of integrations (900+ by Datadog's own count), Datadog usually has an out-of-the-box path for whatever you run, from managed cloud services to obscure middleware. Onboarding a new data source rarely requires custom work.
- Watchdog and Bits AI: Datadog's anomaly detection and its assistant surface correlated issues across signals, and the quality of the automated root-cause suggestions is a real strength once you have enough data flowing.
- Mature product depth: Features like Continuous Profiler and live debugging are polished and well documented. This is a product that has had years to sand down rough edges.
The catch
The single biggest issue is that Datadog's business model runs counter to your interest in reducing data volume. Revenue scales with the telemetry you send, so the incentive structure does not reward you for being economical. OpenTelemetry support exists, but Datadog converts OTLP data into its own model, and every OpenTelemetry metric counts as a custom metric by default, which is where surprise overages start. Custom metric cardinality is the classic Datadog bill-shock story: one metric tagged with a high-cardinality dimension across thousands of values can generate tens of thousands of billable custom metrics from a single instrumentation decision.
Host counting is another sharp edge. Ephemeral Kubernetes nodes get billed for the full month even if they existed for minutes, and APM host allotments for ingested and indexed spans are easy for high-throughput services to blow through in the first week.
Pricing model
Datadog charges per product, and the products stack. Infrastructure monitoring starts around $15 per host per month on an annual Pro commitment, APM adds roughly $31 per host, and logs bill on two axes, near $0.10 per GB ingested plus a separate indexing charge per million events. Custom metrics beyond the per-host allotment, synthetics, RUM, and security are each their own meter. See the Datadog pricing page for current rates.
The model charges on hosts, volume, and features simultaneously, which is what makes the bill hard to predict. It rewards teams that actively manage retention, cap custom metrics, and commit annually to a realistic baseline. It punishes autoscaling, verbose logging, and rich OTel attributes. If cost predictability is your reason for leaving SolarWinds, understand that Datadog trades one modular-metering problem for a more powerful but equally multi-dimensional one.
The verdict
Pick Datadog if breadth is the priority, your team wants a single vendor for observability and security, and you have the discipline (and the budget owner) to keep custom metrics and log volume under control. Avoid it if the whole point of switching is a smaller, more predictable bill, or if OpenTelemetry portability is central to your strategy. For a deeper look, Dash0 maintains a dedicated Datadog alternatives comparison.
2. Dynatrace
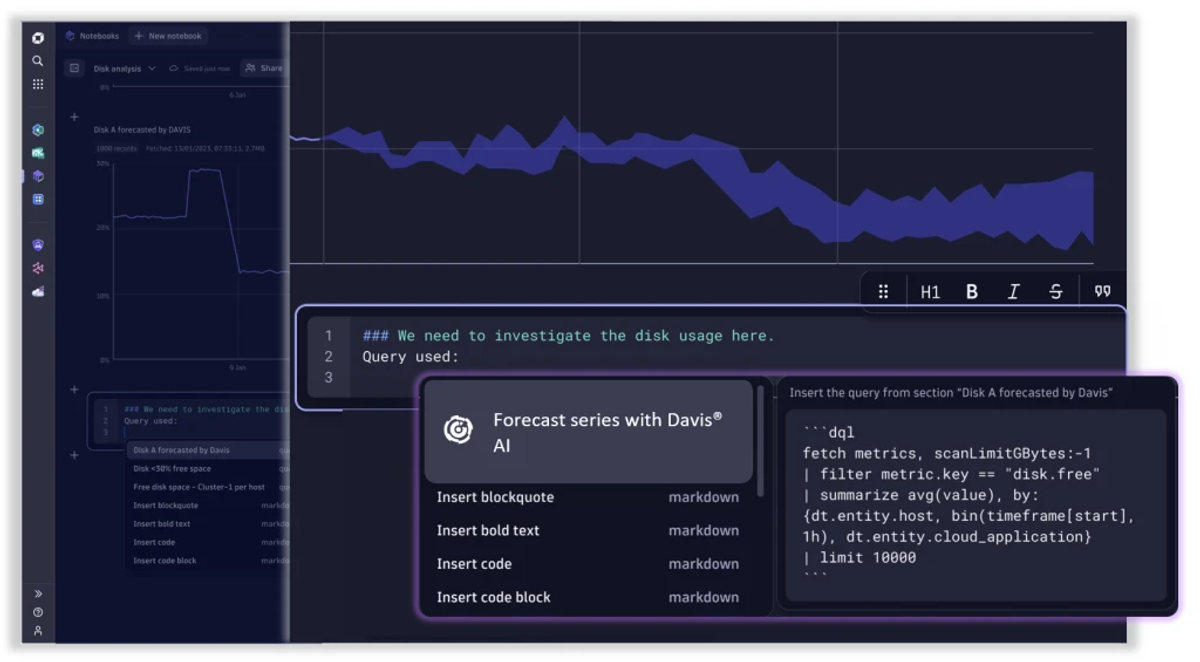
Dynatrace competes at the enterprise end of the market, and its differentiator is genuine. The Davis AI causation engine, combined with the Smartscape topology model and the Grail data lakehouse, produces automated root-cause analysis that goes further than most competitors' anomaly detection. For a large organization replacing SolarWinds across hundreds of hosts, Dynatrace is a credible full-stack destination.
What's good
- Davis causation, not just correlation: Dynatrace's Davis engine attempts causation. It identifies a likely root cause rather than leaving you to correlate symptoms yourself. When it works, it collapses investigation time.
- OneAgent auto-instrumentation: A single agent discovers and instruments the stack automatically, which reduces the per-service setup burden that trips up SDK-based approaches.
- Unlimited users: Seats are not a billing dimension, so you can give the whole engineering org access without a per-user tax. That is a real contrast with New Relic and Grafana Cloud.
The catch
Dynatrace is powerful and expensive, and its consumption model is hard to forecast. The platform accepts OpenTelemetry ingestion, but the deepest value still comes from OneAgent, so an OTel-first team gets a diluted version of the product. Full-stack monitoring bills on monitored memory, which means your cost is tied to host RAM rather than anything you directly control, and the Dynatrace Platform Subscription (DPS) credit accounting is hard for procurement to model in advance.
Pricing model
Dynatrace runs on DPS, a pool of credits consumed across capabilities. Full-stack monitoring is priced per memory-GiB-hour, roughly $0.01 per GiB-hour with a 4 GiB floor per host, which works out near $58 per month for an 8 GiB host. Infrastructure-only monitoring is about half that. Logs ingest around $0.20 per GiB with separate retention charges, RUM bills per session, and synthetics bill per request or action. The current Dynatrace pricing page publishes the rate card.
The memory-weighted model is unusual and consequential. Two hosts running identical workloads cost different amounts if one has more RAM, which decouples your bill from the thing you care about (application behavior). The multi-dimensional credit pool gives flexibility to shift spend between capabilities, at the price of forecast difficulty. Median enterprise contracts land well into six figures, so this is not a platform you casually adopt.
The verdict
Pick Dynatrace if you are a large enterprise, root-cause automation is worth a premium, and unlimited seats matter for broad access. Skip it if you are a small or mid-sized team, if OpenTelemetry portability is a core requirement, or if you need to hand finance a predictable number before signing.
3. New Relic
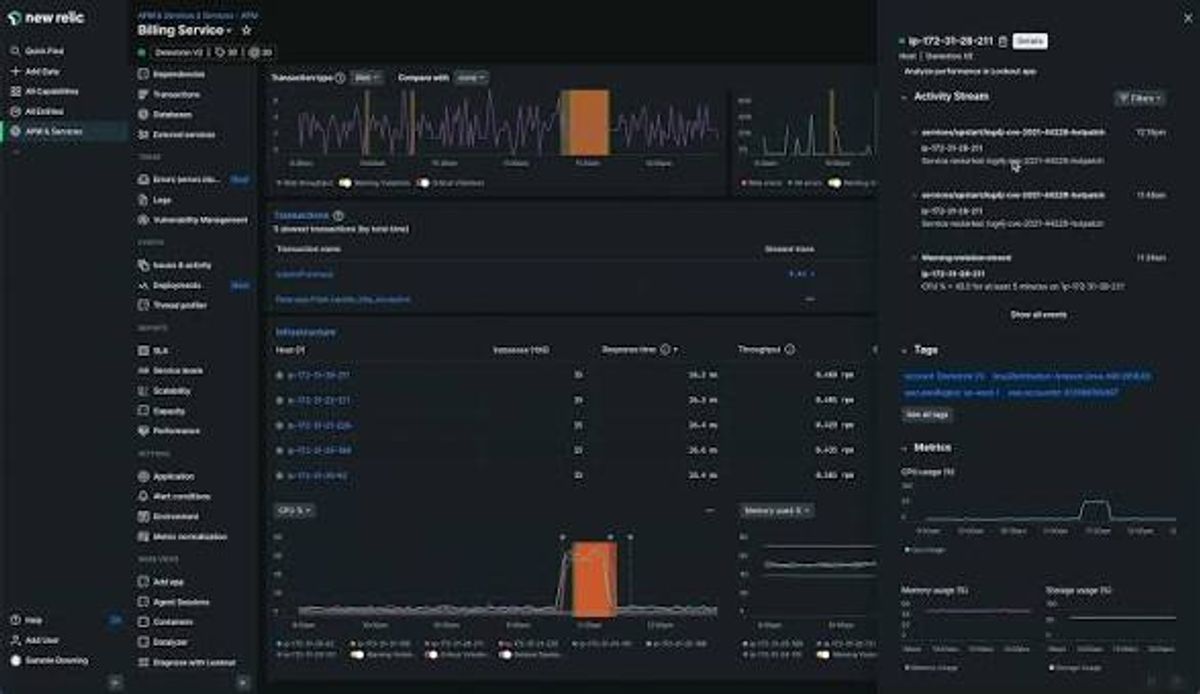
New Relic rebuilt its pricing years ago around two dimensions, data ingested and user seats, and dropped per-host fees entirely. That makes it structurally interesting for teams leaving SolarWinds' per-device-and-per-service model, because you can monitor unlimited hosts and containers without a host meter running. It is a mature full-stack platform covering APM, infrastructure, logs, distributed tracing, and browser and mobile monitoring.
What's good
- No per-host billing: Ingest-plus-seats pricing means ephemeral containers and autoscaling do not inflate a host count. For dynamic Kubernetes environments this removes a whole category of bill anxiety.
- Usable free tier: 100 GB per month of ingest, one free full-platform user, and unlimited basic users is enough to run real production observability for a small team at no cost.
- NRQL and broad coverage: NRQL, New Relic's query language, is expressive, and the single data pool means metrics, logs, traces, and events sit together rather than in separate silos.
The catch
The seat model is where costs bite. Full-platform users jump from $99 each on Standard (capped at five) to $349 per user per year on Pro, and that per-seat cost frequently exceeds the ingest bill for a mid-sized team. The result is an incentive to ration who gets full access, which works against the goal of democratizing production visibility. New Relic supports OTLP ingestion, but like the other incumbents it maps OpenTelemetry data into its own model rather than storing it natively, so instrumentation is portable while the platform experience is not. There are also no hard spend caps that automatically halt ingestion, so budget governance is on you.
Pricing model
New Relic bills on data ingest, with 100 GB free per month and roughly $0.30 to $0.40 per GB after that on the standard option, or about $0.60 per GB on Data Plus for 90-day retention and compliance features. On top of ingest sit user seats: free unlimited basic (read-only) users, Core users at $49 per month, and Full Platform users at the tiers above. The New Relic pricing page has the detail.
The two-axis model is simpler than Datadog's per-product sprawl and easier to reason about, which is a real advantage. The friction is that the two axes scale independently: a growing team drives seat cost, and richer instrumentation drives ingest cost, and a 30-person team pays substantially more on seats than a 5-person team for the same telemetry. Dash0 covers this trade-off in its New Relic alternatives guide.
The verdict
Pick New Relic if you run a lot of hosts but have a relatively small group of engineers who need full access, and if ingest-based billing fits your telemetry profile. Look elsewhere if your whole team needs to query production daily, since the Full Platform seat cost will dominate your bill.
4. Grafana Cloud
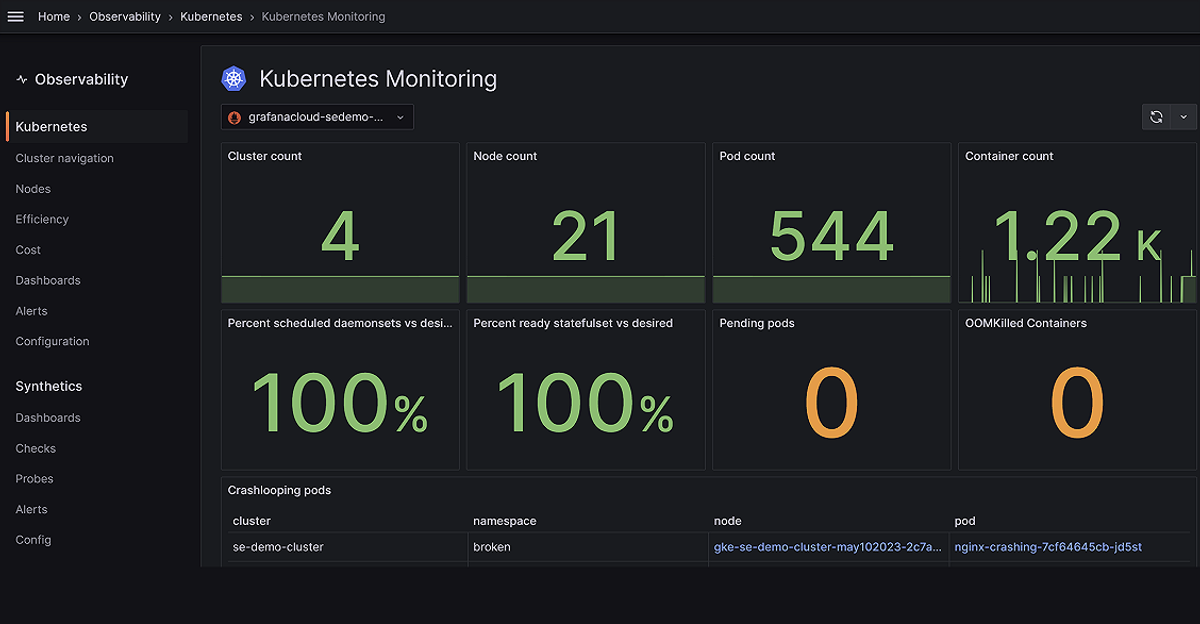
Grafana Cloud is the managed version of the open-source stack that a huge share of the industry already runs: a metrics backend, a logs backend, a traces backend, and continuous profiling, all fronted by Grafana dashboards. For a team that wants to leave SolarWinds without betting on a single proprietary vendor, the open-source foundation is the draw. Your dashboards and queries are built on projects you could self-host if you ever needed to.
What's good
- Open-source portability: Dashboards and alerting rules are built on open components, so the artifacts you create are not trapped in a proprietary format the way they are on the commercial incumbents. This is the strongest anti-lock-in story among the managed platforms here.
- The most generous free tier: 10,000 active metric series, 50 GB each of logs and traces, and three active users, with no expiry, is enough for a small team to run real observability for free.
- Prometheus and OpenTelemetry ingestion: If your team already writes PromQL and runs Prometheus exporters, the learning curve is close to zero.
The catch
The architecture that makes Grafana Cloud portable also makes it fragmented. Each signal lives in its own backend with its own query language: PromQL for metrics, LogQL for logs, TraceQL for traces. Correlating across them means context-switching between query dialects, which is more friction than a single unified surface. Metrics billing is driven by active series, so a cardinality explosion (one metric multiplied across a high-cardinality label) can push a $1,000 month toward $10,000 on the same hosts. There is also a strategic tension worth naming: the company monetizes open-source projects, and that model shapes where investment goes, particularly around newer AI-assisted features.
Pricing model
Grafana Cloud runs on a set of independent meters. Metrics bill around $6.50 to $8 per 1,000 active series, logs and traces bill roughly $0.45 per GB across processing, write, and retention components, profiles are similar, and there is a per-active-user visualization charge plus a small monthly platform fee on the paid tier. Enterprise contracts carry a five-figure annual minimum.
The per-active-series metrics model is the one to watch. It does not care how much data a series contains, it cares how many distinct series exist, so the cost driver is cardinality rather than volume. That rewards disciplined labeling and punishes teams that attach high-cardinality dimensions (user IDs, request IDs) as labels. The multi-meter structure means a single decision like raising log verbosity shows up as several separate line items. Verify current rates on Grafana Labs' own pricing page before modeling.
The verdict
Pick Grafana Cloud if your team already lives in Prometheus and Grafana, values the ability to self-host as an exit ramp, and can manage metric cardinality with discipline. Think twice if you want one query language across all signals, or if you would rather not become an expert in three storage backends' cost behaviors.
5. Chronosphere
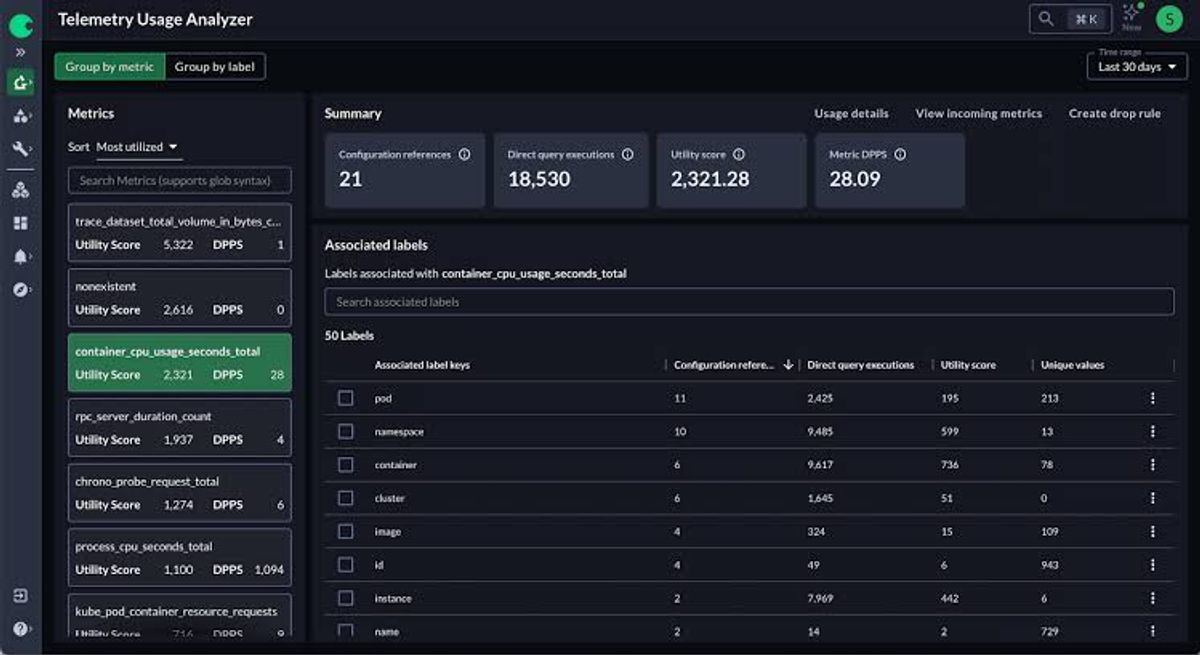
Chronosphere built its reputation on a single sharp problem: controlling the cost and cardinality of observability data at massive scale. It is a cloud-native, metrics-first platform (with logs and traces) whose Control Plane lets you shape, aggregate, and drop low-value telemetry before it is stored and billed. For a large SolarWinds shop whose real pain is runaway telemetry growth, Chronosphere is aimed squarely at that wound.
What's good
- Telemetry shaping as a first-class feature: The Control Plane gives per-metric utility scoring and aggregation rules so you can cut volume without losing the signals you rely on. Chronosphere reports substantial customer data-volume reductions from this shaping.
- Built for scale and cardinality: The architecture is designed for high-cardinality Kubernetes environments where Prometheus-style setups fall over, and it handles that regime well.
- Open-standard ingestion: It supports PromQL, OpenTelemetry, Prometheus, and Fluent Bit / FluentD pipelines, and works with Grafana-style dashboards and Alertmanager-style workflows, so it slots into existing open tooling.
The catch
Chronosphere is a sales-led enterprise product, and it shows. There is no public pricing (the pricing URL returns a 404), no self-service signup, and the platform is explicitly a better fit for large or fast-scaling teams than for small ones. The metric-shaping and cost-optimization features that justify the platform carry a real learning curve. And there is fresh strategic uncertainty: Palo Alto Networks completed its roughly $3.35 billion acquisition of Chronosphere in January 2026, and standalone packaging may evolve as observability is integrated with Palo Alto's security and AI-operations portfolio. That is worth factoring into a multi-year commitment.
Pricing model
Chronosphere is custom and quote-based. Rather than charging per host, per user, or per raw ingested byte, it charges for useful retained data after Control Plane shaping, using a fungible credit currency across metrics, logs, and traces. Its telemetry pipeline is priced separately on raw throughput. Because nothing is published, you cannot model a bill without engaging sales.
The philosophy is the interesting part: by pricing on retained-and-useful data rather than ingest, the model aligns the vendor's incentive with your desire to reduce volume, which is the opposite of the Datadog dynamic. The catch is that the value depends entirely on your willingness and ability to operate the shaping controls, and the lack of published rates makes procurement a negotiation rather than a calculation.
The verdict
Pick Chronosphere if you are a large cloud-native organization whose primary problem is telemetry cost and cardinality at scale, and you have a platform team ready to run the Control Plane. It is the wrong tool for a small team, a network-monitoring use case, or anyone who needs to self-serve and see a price before talking to sales.
6. Honeycomb
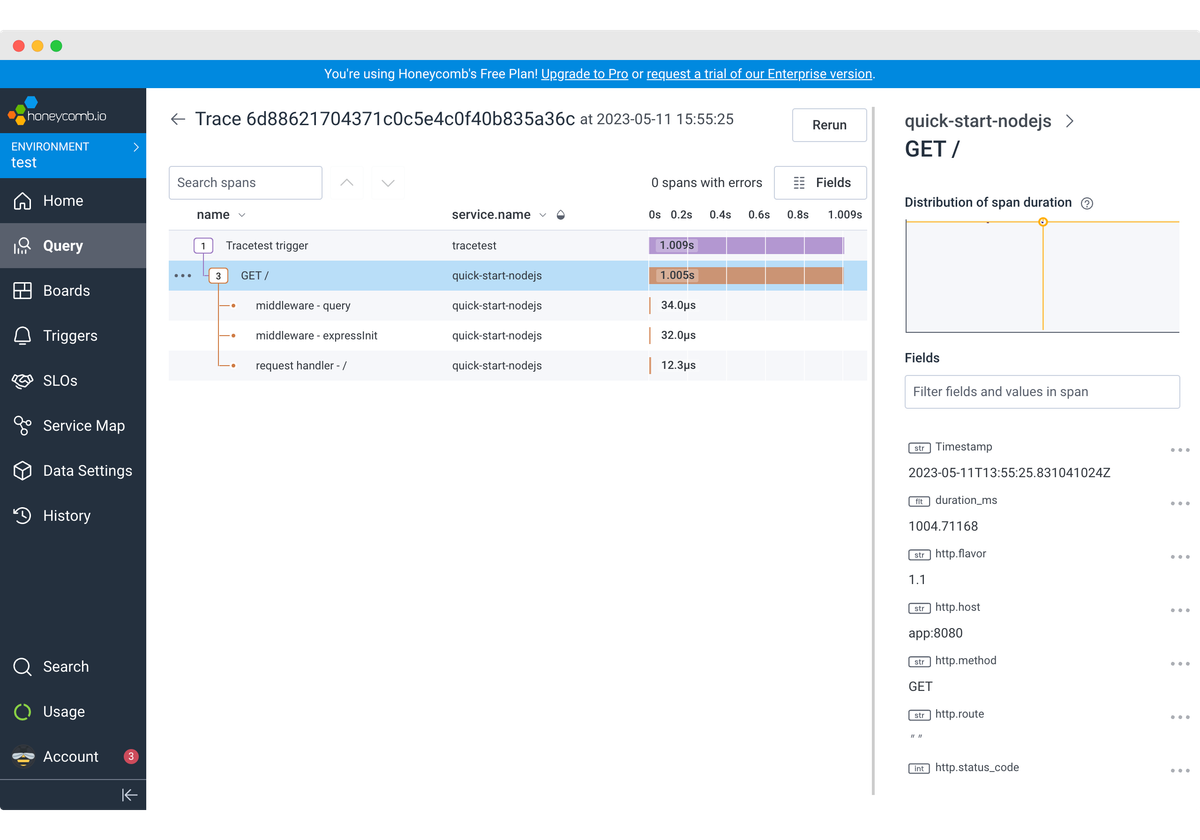
Honeycomb, founded by engineers who felt the limits of dashboard-based monitoring at Facebook-scale, took a different path from everyone else on this list. It is built around high-cardinality, event-based analysis and distributed tracing, optimized for asking new questions during an incident rather than watching pre-built dashboards. Its BubbleUp feature, which automatically surfaces what is different about a slow or failing set of requests, is a genuinely distinctive debugging tool.
What's good
- Best-in-class trace debugging: For understanding why a specific subset of requests behaves differently, Honeycomb's query model and BubbleUp are hard to beat. Trace-heavy teams debugging microservice interactions get real value fast.
- High-cardinality by design: You can attach effectively unlimited context to events and slice by any of it, which is exactly what breaks cost models on series-based platforms.
- Strong OpenTelemetry support: Honeycomb ingests OTLP directly and its Refinery proxy gives you tail-based sampling control.
The catch
Honeycomb is trace-first, and while metrics reached general availability in 2026, the product's center of gravity is still events and traces rather than the broad infrastructure and network coverage a SolarWinds shop expects. It is not OpenTelemetry-native in the storage sense: incoming data is converted into Honeycomb's own event model, so the instrumentation is portable while the stored data is not. Pricing also moved in the wrong direction for existing users. As of July 2026, the Pro per-event rate rose to $3.00 per million events, up from $1.30 on legacy plans, alongside a repackaging that bundles metrics and AI features.
Pricing model
Honeycomb bills primarily on events per month, with metric data points billed separately. The free tier includes 20 million events per month. Pro starts around $130 per month and scales through tiers up to hundreds of millions of events, at the new $3.00-per-million-events rate. Enterprise adds Private Cloud for AWS and custom terms. The Honeycomb pricing page has the current tiers.
The event-based model is clean and easy to reason about for a trace-centric workload, and it does not penalize rich per-event context the way series-based metrics pricing does, which suits high-cardinality debugging. The friction is that everything is an event, so logs-as-events and high trace volume both consume the same meter, and the recent rate increase means teams sending metrics as events should restructure to avoid paying trace-tier rates for metric data. Model your event volume specifically before committing. Dash0's Honeycomb alternatives piece digs into this further.
The verdict
Pick Honeycomb if distributed-systems debugging is your dominant use case and your team thinks in traces and events. It is a poor SolarWinds replacement if you need broad infrastructure, network, or database monitoring, since that is not what it is built to do.
7. Prometheus & Grafana (OSS)
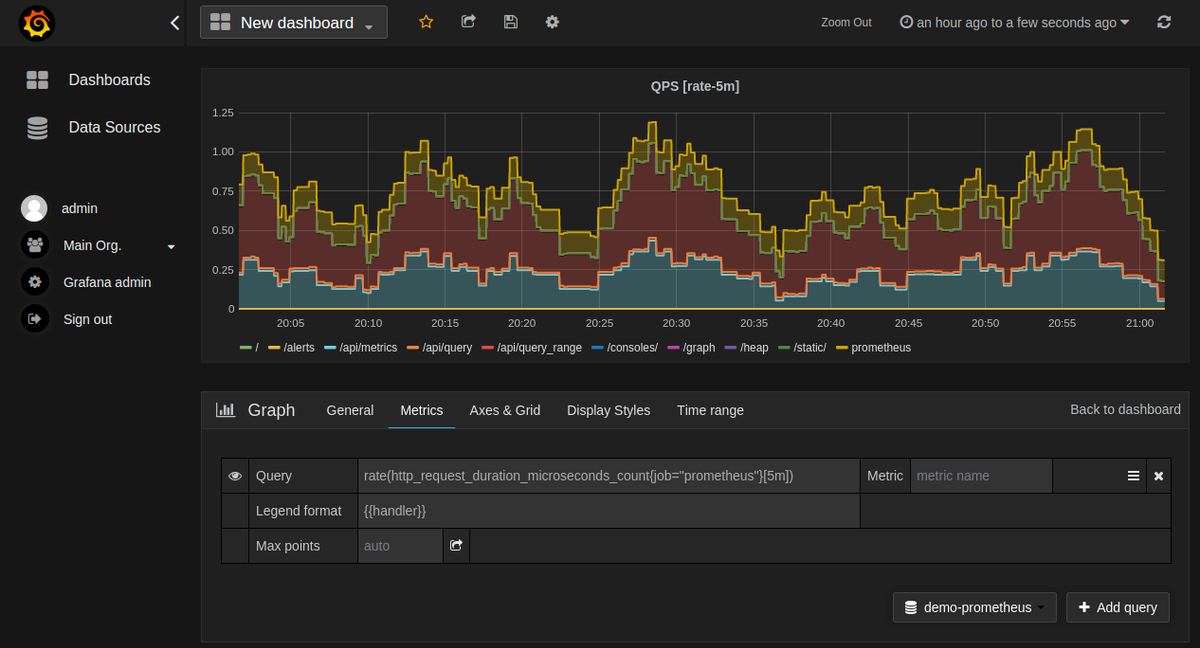
The do-it-yourself route deserves a place on this list, because for a meaningful number of teams it is the right answer. Prometheus for metrics and Grafana for dashboards are the de facto open-source standard, and paired with additional Cloud Native Computing Foundation (CNCF) projects for tracing and logs, they form a complete, free-of-license-cost observability stack. If your reason for leaving SolarWinds is a combination of cost and a desire for total control over your data, this is the path with zero vendor in the middle.
What's good
- No license cost and no lock-in of the commercial kind: The software is free and open source. Your data lives in infrastructure you control, and PromQL and Grafana dashboards are portable by definition.
- Enormous ecosystem: Prometheus exporters exist for nearly everything, and the community, documentation, and hiring pool are the largest in observability. Your team probably already knows PromQL.
- Full architectural control: You decide retention, storage, high-availability topology, and sampling. Nothing is hidden behind a vendor's abstraction.
The catch
You are now running an observability platform, which is a real engineering commitment. Prometheus is not built for long-term storage or horizontal scale on its own, so production deployments reach for projects like Thanos or Cortex to add durable storage and global query, and each adds operational surface. Metrics, logs, and traces come from separate projects with separate query languages, so you are integrating and maintaining several systems rather than buying one. High-cardinality metrics can overwhelm a Prometheus server, and capacity planning, upgrades, and on-call for the monitoring stack itself all land on your team. When your observability system pages you at 3am, there is no vendor to call.
Pricing model
The software is free. Your cost is infrastructure (compute, storage, network for the telemetry pipeline) plus the engineering time to build, scale, and operate it. That time is the dimension people underestimate. A senior platform engineer maintaining the stack is a five-or-six-figure annual cost that does not appear on any pricing page, and it scales with the ambition of your deployment.
The model's honesty is its appeal: there is no metering game, no cardinality surcharge, no seat tax. What you spend maps to real resources and real labor. The predictability is only as good as your capacity planning, and the failure mode is an under-resourced stack that becomes unreliable exactly when you need it most.
The verdict
Pick the open-source stack if you have a platform team with the capacity and appetite to run it, and control and license-cost avoidance outweigh convenience. Avoid it if observability is not where you want to spend engineering headcount, or if you need traces, logs, and metrics unified without assembling them yourself.
8. Dash0
Dash0 is an observability platform built natively on OpenTelemetry from the ground up, rather than as OTel support layered onto an older proprietary architecture. It was founded in 2023 by Mirko Novakovic, who previously founded the APM company Instana. The design premise is that OpenTelemetry data should be ingested, stored, and queried without ever being converted into a vendor-specific shape, so the semantic richness of your telemetry survives end to end. It covers metrics, logs, traces, real user monitoring, and synthetic monitoring as a managed SaaS.
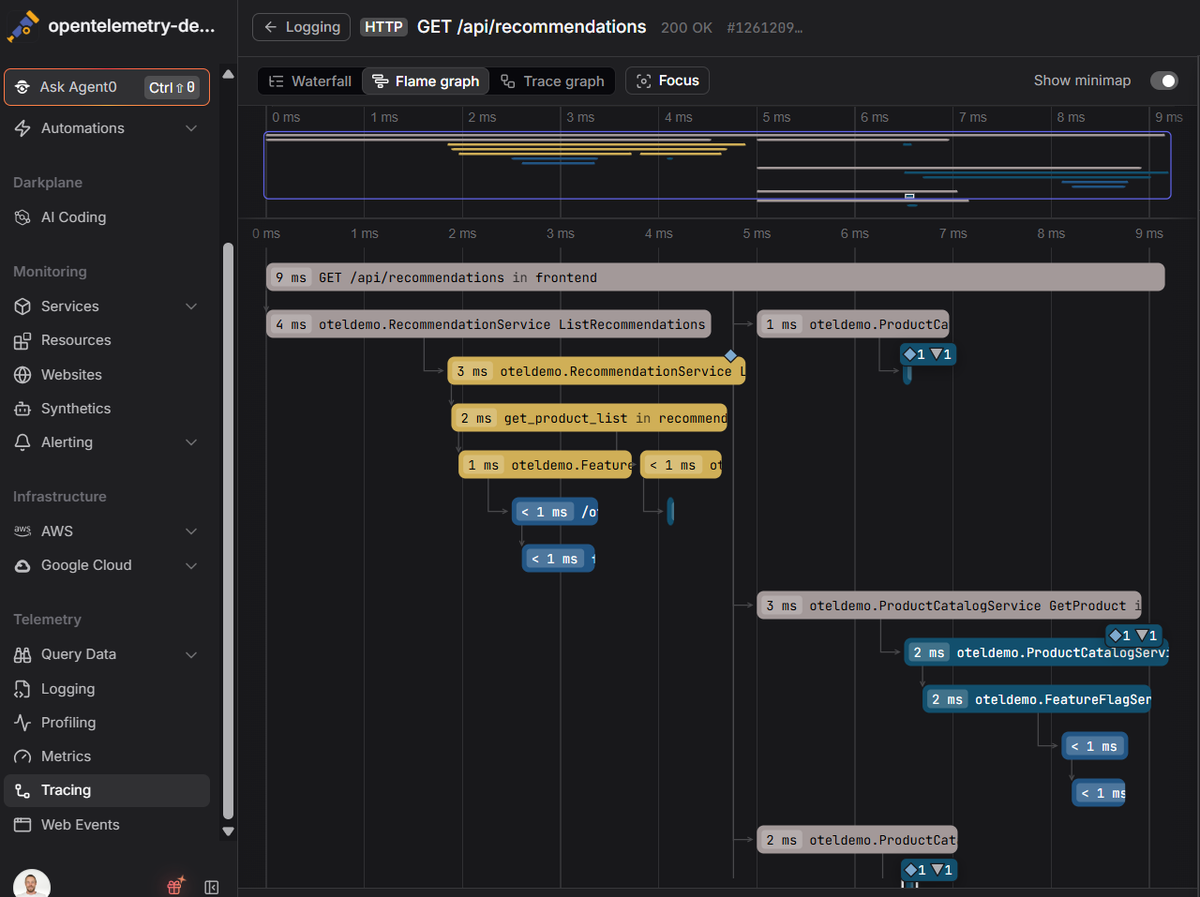
What's good
- OpenTelemetry-native storage and portable dashboards: Data is kept in OTel format rather than converted, and dashboards are built on Perses, an open standard backed by the CNCF, so what you build exports and imports elsewhere. Your instrumentation and dashboard definitions stay portable if you leave.
- One query language across signals: Dash0 offers full PromQL compatibility across metrics, logs, and traces, plus Prometheus remote-write support. If your team knows PromQL from Prometheus, there is no second or third dialect to learn, which is a direct contrast with the multi-language open-source stack.
- Agent0 for automated investigation: Agent0 is Dash0's standalone autonomous production AI, generally available since June 2026. It runs a full investigation loop on the OpenTelemetry data you already send, correlating signals into your code and drafting fixes as pull requests through its GitHub and Linear integrations, and it can run autonomously from event-driven triggers with write actions off by default. A multi-agent architecture decomposes an investigation rather than leaning on a single assistant.
The catch
Dash0 is a young platform, and that shows in concrete ways. The Kubernetes Operator auto-instruments Java, Node.js, and .NET; other runtimes require manual OpenTelemetry SDK setup, which is real ongoing engineering work that OneAgent-style injection would avoid. Agent0 reached general availability in June 2026 and now runs autonomously, but it is a young product, and its autonomous write actions (opening a pull request, for example) need the same review discipline you would apply to any agent that touches your codebase. The integration catalog is narrower than what decade-old vendors like Datadog and Dynatrace ship, so an obscure data source may need more setup. Dash0 is SaaS-only with no self-hosting option, and it does not include built-in incident management, so on-call scheduling, escalation, and status pages still need a separate tool like PagerDuty or incident.io. And crucially for anyone leaving SolarWinds specifically for its network heritage, Dash0 does not replicate SNMP-based network-device monitoring. Logs and traces retain for 30 days by default, which some compliance regimes will find short.
Pricing model
Dash0 uses consumption-based pricing on the telemetry you send: per million metric data points, per million spans, and per million log records, with no per-seat, per-host, per-container, or base platform fee. Web events and synthetic check runs are billed as their own units, and Agent0 is metered separately on task-based credits, so heavy automated investigation is a distinct line item on top of the telemetry rates. Rates and the current model are on the Dash0 pricing page.
The per-signal model interacts with the OpenTelemetry-native design in a specific way: because you pay per signal rather than per gigabyte or per series, attaching another useful attribute to a span does not create a new billing dimension, so rich OTel data is not financially penalized. Higher volume still raises the bill, but the scaling is linear across a small number of published rates rather than a dozen interacting meters. One nuance worth flagging: spans and log records cost more per million than metric data points, so trace-heavy microservice architectures should model span volume specifically rather than assuming the metric rate. Cost-control mechanisms include spam filters that reject low-value telemetry before storage and billing, monthly budget limits, and real-time usage dashboards so you watch spend accrue instead of discovering it on an invoice.
The verdict
Pick Dash0 if your team has standardized on OpenTelemetry, you want a managed backend with one query language and portable dashboards, and predictable per-signal billing matters more than the breadth of a decade-old suite. It is a weaker fit if you need SNMP network-device monitoring, self-hosting, or built-in incident management. You can test it against real telemetry with a 14-day free trial.
Which tool fits your situation
The right recommendation depends less on which platform is objectively best and more on what drove you to leave SolarWinds.
If your SolarWinds usage is mostly network-device and hybrid infrastructure monitoring, none of the cloud-native platforms here is a clean one-for-one replacement, and you should either keep a dedicated network tool alongside a modern observability platform or evaluate SolarWinds Self-Hosted against network-specialist vendors that this guide does not cover.
If you want one vendor for everything and budget management is a solved problem on your team, Datadog remains the broadest option, with Dynatrace the stronger pick when automated root-cause analysis at enterprise scale justifies a premium and you value unlimited seats.
If ingest-based billing fits your telemetry and only a handful of engineers need full platform access, New Relic's model is simpler than Datadog's and its free tier is unusually usable.
If your team already lives in Prometheus and Grafana, Grafana Cloud is the natural managed step up, and the fully self-hosted open-source stack is the right call when you have a platform team and control outweighs convenience.
If runaway telemetry cost at large scale is the specific problem, Chronosphere is purpose-built for it, provided you are enterprise-sized and ready to operate its shaping controls.
If distributed-systems debugging dominates your day, Honeycomb's trace analysis is worth adopting even as a complement rather than a full replacement.
And if you have standardized on OpenTelemetry and want a managed backend that keeps your data in OTel format with one query language and per-signal pricing, Dash0 fits that profile directly, with the caveats around platform age and network monitoring noted above.
Final thoughts
The alternatives to SolarWinds Observability fall into three camps, and each represents a clear trade. The commercial full-stack incumbents (Datadog, Dynatrace, New Relic) give you breadth and polish in exchange for proprietary data models and pricing that scales with your success. The open-source and managed-open-source options (Grafana Cloud, and the self-hosted Prometheus and Grafana stack) give you portability and control in exchange for multiple query languages and, in the self-hosted case, real operational burden. The modern cloud-native and specialized tools (Chronosphere, Honeycomb, Dash0) each solve a sharper problem: cost at scale, trace debugging, and OpenTelemetry-native portability respectively.
The through-line is that the most durable decision is a pricing and portability decision, not a feature decision. Features converge over time; billing models and data formats are what you live with at renewal. If the reason you are leaving SolarWinds is a mix of hard-to-model modular pricing and a desire to stop routing your OpenTelemetry data through a vendor's agent to get full fidelity, the platform that addresses both at once is one that stores OTel data natively and prices on a few published per-signal rates. That is the specific gap Dash0 is built for, with the real trade that you give up the network-monitoring heritage and multi-year maturity of the incumbents in return.
Whatever you choose, run your own telemetry through it before you sign. List rates and feature matrices are starting points, not answers.
Sign up for a free Dash0 account with 14 days of unlimited access to test it against your real workloads.
FAQ
Is SolarWinds Observability the same as the old SolarWinds Orion platform? No. SolarWinds Observability SaaS is the cloud-hosted product covering APM, infrastructure, logs, databases, and digital experience monitoring. The on-premises suite, now called SolarWinds Observability Self-Hosted, was formerly known as Hybrid Cloud Observability and before that as the Orion platform. This guide focuses on the SaaS product.
Does SolarWinds Observability support OpenTelemetry? Yes, with a caveat. SolarWinds describes itself as an OTel vendor and accepts direct OTLP ingestion from any OpenTelemetry receiver. However, its own documentation notes that data ingested directly through OTLP does not create entities in the platform, and the richer entity-based experience relies on the SolarWinds Observability Agent. So instrumentation is portable, but the full platform experience is agent-centric.
Which SolarWinds alternative is the most cost-predictable? It depends on your architecture, because each model interacts differently with your telemetry. Per-signal pricing (Dash0) and ingest-based pricing (New Relic on the data axis) tend to be easier to forecast than per-host-plus-modules pricing (Datadog) or memory-weighted consumption (Dynatrace). The self-hosted open-source stack has no metering at all, but your cost shifts to infrastructure and engineering time. Model your actual volumes against each before deciding.
Can any of these replace SolarWinds' network device monitoring? Not cleanly. SolarWinds' SNMP polling and NetFlow-style traffic analysis for physical network gear is a heritage strength that the cloud-native observability platforms in this guide do not replicate. If network-device monitoring is central to your use case, plan to keep a dedicated network tool or evaluate network-specialist vendors alongside your observability platform.

