

Most teams don't go looking for a Sumo Logic alternative because the product stopped working. They go looking because the invoice stopped making sense. Under Sumo Logic's Flex model, ingesting logs is free, and you instead spend credits on the data your queries scan and on what you store (Sumo Logic Cloud Flex Credit schedule). The practical result is that two teams with identical ingest volumes can land on very different bills depending on how much they actually search, which makes the next quarter hard to forecast (independent Flex vs per-GB analysis).
Cost is the loudest trigger, but it's rarely the only one. Sumo Logic runs exclusively as multi-tenant SaaS, so teams with data-residency or self-hosting requirements hit a wall. Others realize they're paying for Cloud SIEM (security information and event management) packaging they never fully adopted, while their real need is log analytics and observability. And as engineering orgs standardize on OpenTelemetry, Sumo Logic's proprietary search language starts to feel like a tax: G2 and Gartner Peer Insights reviews consistently name query complexity as the platform's most common friction point.
The tricky part is that "Sumo Logic alternative" means different things depending on which job you're replacing. If you bought it for cloud SIEM, you're shopping for security tooling. If you bought it for log analytics that grew into observability, you're shopping for a telemetry backend. The tools below sit in the second camp: platforms that can absorb Sumo Logic's log-and-observability workload, with honest notes about where the security story does or doesn't carry over.
This guide evaluates six of them on the dimensions that decide a migration: deployment model, signal coverage, OpenTelemetry support, query portability, who owns the stored data, and how the pricing model behaves as your volume grows.
Why choosing a Sumo Logic alternative is tricky
The category looks crowded until you sort it by architecture, at which point it collapses into a few distinct bets, each with a different failure mode.
The first bet is the commercial all-in-one platform. These absorb everything and give you one polished interface, but they tend to meter each capability on its own line, so the bill compounds as you turn on more products. The second bet is the enterprise incumbent, strong on security and search depth, priced for organizations that have a procurement team and a multi-year horizon. The third bet is the open-source-rooted search stack, which is cheap on license and expensive in operational time. The fourth is the open-source observability bundle, powerful and portable but split across separate backends per signal. The fifth is the cost-optimized log platform that pushes storage into your own cloud account. The sixth is the OpenTelemetry-native newcomer, built around open standards from the start but younger and thinner on decade-old integrations.
Two decisions cut across all of them. The first is query portability. Sumo Logic's search language does not travel, so whichever platform you pick, your saved searches, dashboards, and the muscle memory of your on-call engineers get rewritten. Tools that speak PromQL or SQL shorten that relearning curve; tools with their own proprietary language reset it to zero. This matters most during an incident, when a non-standard syntax adds cognitive load at the exact moment you can least afford it.
The second is what "no lock-in" honestly means. OpenTelemetry makes your instrumentation and transport portable, so you can point the same Collector at a new backend without re-instrumenting your services. In practice, for the OTLP-capable tools here, that side of a migration is an exporter endpoint change, not an instrumentation rewrite. It does not make your dashboards, alert rules, query logic, retention policies, or investigation workflows portable. Every platform on this list locks you in somewhere. What varies is which layer holds the lock.
We'll evaluate each tool against these criteria:
- Deployment model: SaaS-only, self-managed, or both, and whether data residency is possible
- Signal coverage: logs, metrics, traces, and how unified the correlation is
- OpenTelemetry support: native OTLP (OpenTelemetry Protocol) ingestion versus a compatibility layer
- Query portability: open languages (PromQL, SQL) versus proprietary syntax
- Data ownership: vendor-held storage versus data in your own object store
- Cost model: what dimensions the pricing charges on, and how predictable the bill is
- Lock-in: what stays portable if you leave, and what doesn't
How they compare
The baseline row is Sumo Logic itself, so you can read each alternative as a move away from a known starting point.
| Tool | Deployment | Signals | OTel support | Query language | Data ownership | Cost model |
|---|---|---|---|---|---|---|
| Sumo Logic (baseline) | SaaS-only | Logs, metrics, traces, Cloud SIEM | OTel Collector ingestion | Proprietary search language | Vendor multi-tenant cloud | Flex credits on scan + storage; free ingest |
| Datadog | SaaS-only | Logs, metrics, traces, security, RUM | OTel-compatible | Proprietary tag/query syntax | Vendor cloud | Per-host + per-GB ingest + per-indexed-event + custom metrics |
| Splunk | SaaS or self-managed | Logs, metrics, traces, SIEM | OTel via Collector | SPL (proprietary) | Vendor cloud or your infra | Per-GB ingest or SVC workload units; ES priced separately |
| Elastic / OpenSearch | SaaS or self-managed | Logs, metrics, traces, APM | OTel supported | ES|QL, KQL, Lucene / PPL, DQL | Your infra (self-run) or vendor cloud | Resource-based (Elastic Cloud) or infra cost (OpenSearch) |
| Grafana Cloud | SaaS or self-managed (open source) | Logs, metrics, traces, profiles | OTLP supported | LogQL, PromQL, TraceQL (per signal) | Vendor cloud or your infra | Per-GB logs (process + write + retain), per active series, per user |
| Coralogix | SaaS, storage in your cloud | Logs, metrics, traces, security | OTel-native | DataPrime, Lucene | Your own object storage (Parquet) | Per-GB ingest with tiered routing; no per-host/user/query |
| Dash0 | SaaS-only | Logs, metrics, traces, RUM, synthetics | OTel-native | PromQL across all signals | Vendor cloud | Per-million signals; no per-seat/host/query |
Pricing figures and models are sourced in each tool's entry below. Grafana Cloud's rates are described in prose rather than linked, per our external-linking policy.
1. Datadog
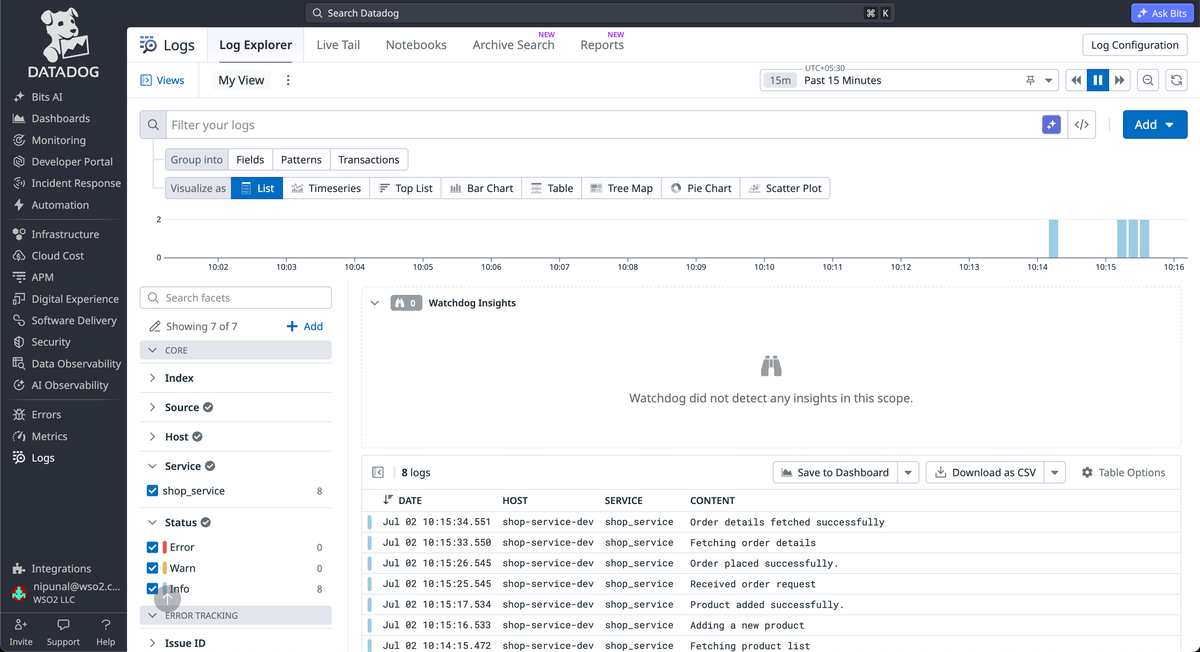
Datadog is the platform most Sumo Logic refugees evaluate first, and often the one they end up comparing everything else against. It's a broad SaaS observability and security suite covering infrastructure, application performance monitoring (APM), logs, real user monitoring (RUM), and Cloud SIEM, with a large integration catalog and an interface that consistently rates well. For a team consolidating a fragmented stack, the breadth is real. In Kubernetes, collection runs through the Datadog Agent and Cluster Agent as a DaemonSet.
What's good
- Integration breadth and polish. Datadog has hundreds of maintained integrations and out-of-the-box dashboards for common services, which shortens the path from install to first useful view. This is where a decade of investment shows.
- Logging without Limits. The model lets you ingest everything cheaply and index only the logs worth searching, so high-value data stays separate from archive-only noise (Datadog's log management pricing).
- Correlated signals. Traces, metrics, logs, and RUM live in one product with tight cross-linking, so pivoting from a slow trace to the underlying logs is fast.
The catch
Datadog is OpenTelemetry-compatible, not OpenTelemetry-native. It ingests OTLP, but its internal model is its own, and the sharpest edge shows up in billing: every OTel metric tends to count as a custom metric, and a single tag applied across a few thousand values can multiply into tens of thousands of billable custom metrics. High-cardinality instrumentation decisions become budget decisions.
The deployment story also mirrors the limitation you're leaving. Like Sumo Logic, Datadog is SaaS-only, with no self-hosting or data-residency path, so teams switching for compliance reasons don't gain anything here. And the query layer is proprietary, so leaving Datadog later means rewriting dashboards and alerts again.
Pricing model
Datadog charges on several independent meters at once. Infrastructure is per host (roughly $15/host/month billed annually), APM is a separate per-host charge, and logs are split into ingestion ($0.10 per GB) plus indexing (priced per million indexed events and scaled by retention) (Datadog pricing). Custom metrics, indexed spans, and extended retention stack on top. The model rewards discipline: you can genuinely control cost by indexing selectively. It also punishes the absent-minded, because turning on products and adding cardinality both push the bill up in ways that aren't obvious until the invoice arrives. To ballpark it, sum host count times the per-host product rates, add ingested-GB times the ingest rate and indexed-event volume times the retention-tiered index rate, then layer on custom-metric counts.
The verdict
Pick Datadog if breadth and a refined interface matter more than deployment flexibility or pricing simplicity, and you have the cost discipline to keep indexing and custom metrics in check. Skip it if you need self-hosting, or if unpredictable multi-meter bills are the exact reason you're leaving Sumo Logic in the first place.
2. Splunk
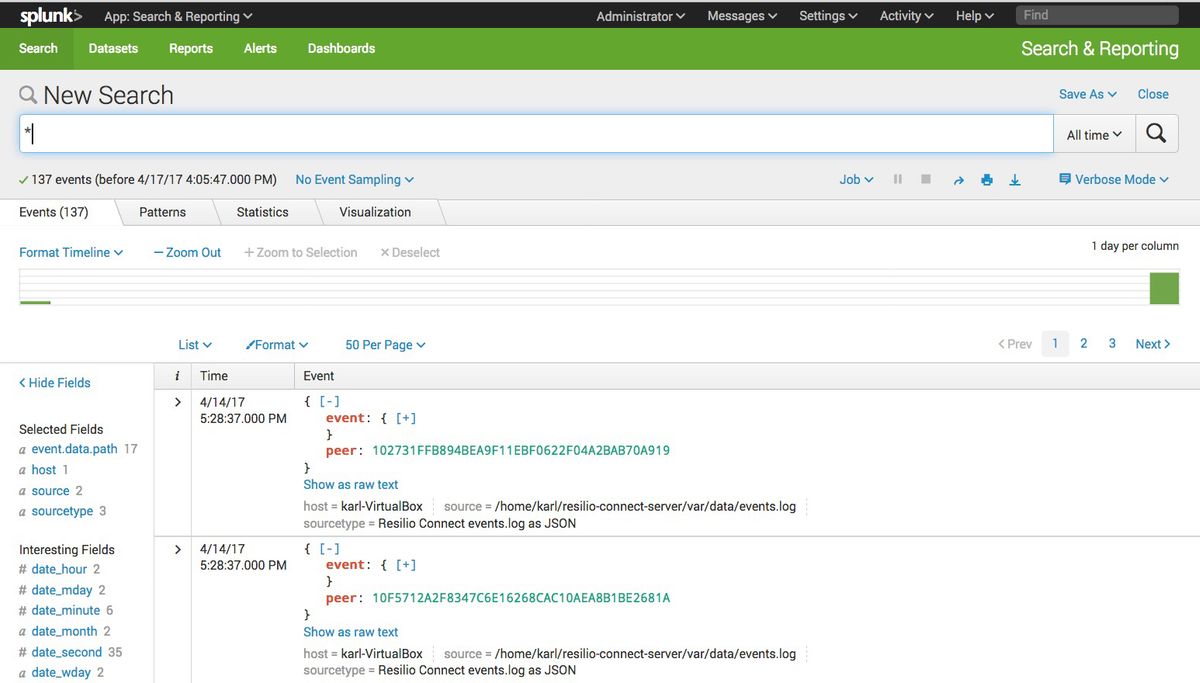
Splunk is the tool Sumo Logic originally positioned itself against, the cloud-native answer to Splunk's on-prem log analytics. Now owned by Cisco (the acquisition closed in March 2024), Splunk remains the heavyweight for security analytics and large-scale log search, with Splunk Enterprise Security as its SIEM layer and Splunk Observability Cloud covering metrics, APM, and RUM. Kubernetes collection runs through the Splunk distribution of the OpenTelemetry Collector, deployed as a DaemonSet.
What's good
- Search depth and SPL. Splunk's Search Processing Language (SPL) is genuinely expressive, and for complex forensic and security investigations it remains a benchmark. Teams with deep SPL expertise get real leverage.
- SIEM maturity. Enterprise Security, risk-based alerting, and a large content ecosystem make Splunk a credible full SIEM, which most general observability tools are not.
- Deployment choice. Unlike Sumo Logic, Splunk offers both Splunk Cloud and self-managed Splunk Enterprise, so on-prem and data-residency requirements have a path.
The catch
Splunk's power comes with operational and commercial weight. SPL is proprietary, so it carries the same relearning cost as any non-standard language, and self-managed Splunk is a real platform to run. The bigger issue for cost-driven migrations is that the genuine SIEM capabilities usually require Enterprise Security as a separate license on top of the base platform, which roughly doubles the ingest cost for security use cases (independent Splunk pricing breakdown). This is a premium-tier product, and its list pricing reflects that.
Pricing model
Splunk sells two models. Legacy ingest pricing charges per GB per day, with the unit rate tapering as daily volume grows (Splunk pricing FAQ). Workload pricing, the default recommendation on new Cloud contracts, meters Splunk Virtual Compute units (SVCs) that measure search compute rather than raw ingest. Workload pricing tends to win for predictable, search-heavy environments and can run higher for ingest-heavy compliance workloads. Either way, premium apps like Enterprise Security and IT Service Intelligence are licensed separately, so the platform's true cost is the base plus the add-ons your use case requires. To ballpark it, model daily ingest against the tapering per-GB rate (or the committed SVC pack you'd buy), then add Enterprise Security and any premium apps as separate lines. List rates are high and deep negotiated discounts are routine, which means the number you plan around depends heavily on your contract.
The verdict
Pick Splunk if security operations are the core job and you need a mature SIEM with deep search, and you have the budget and the team to match. If you're leaving Sumo Logic mainly to escape SIEM packaging you don't use, moving to an even heavier security platform is the wrong direction.
3. Elastic and OpenSearch
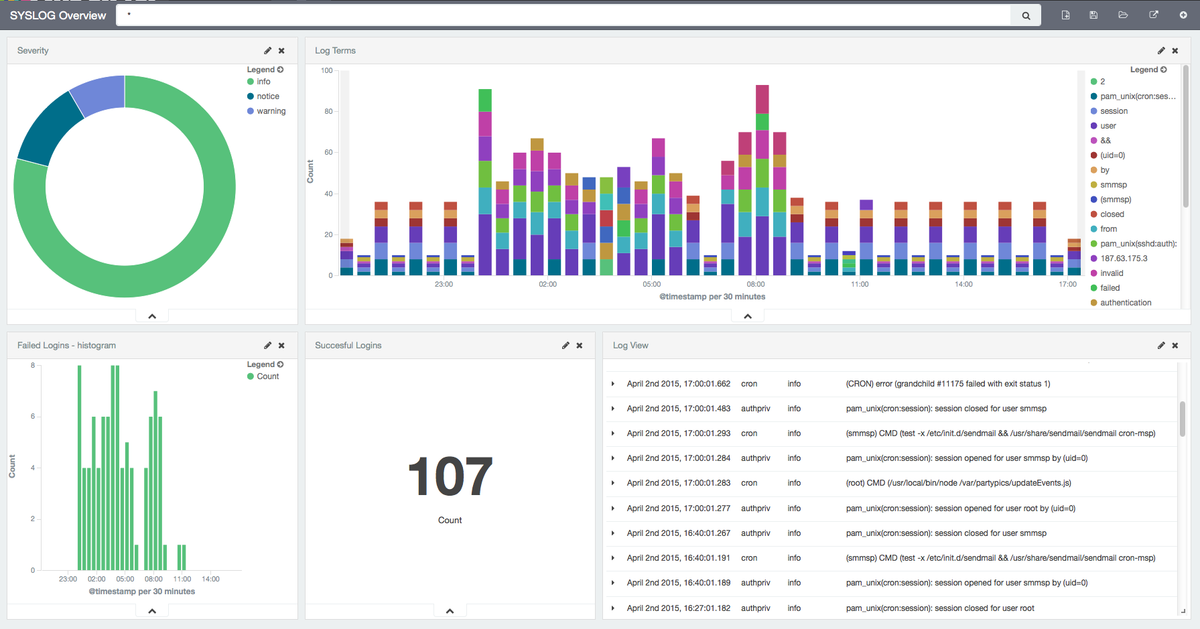
Elasticsearch is the log-analytics workhorse a large slice of the industry already runs, usually as the ELK (Elasticsearch, Logstash, Kibana) or Elastic stack. It splits into two lineages that matter for this decision. Elastic relicensed Elasticsearch away from Apache 2.0 in 2021, which prompted Amazon to fork the last open version into OpenSearch under Apache 2.0; Elastic later added an AGPL v3 option in 2024, making Elasticsearch open source again. Both give you full-text log search built on Lucene, with metrics, traces, and APM layered on. In Kubernetes, you collect with Elastic Agent or an OpenTelemetry Collector DaemonSet.
What's good
- Best-in-class full-text search. For ad-hoc log investigation across large volumes, Lucene-based indexing is fast and flexible, and Kibana (or OpenSearch Dashboards) is a capable exploration surface.
- Deployment freedom. You can self-host on your own infrastructure, run Elastic Cloud, or use Amazon OpenSearch Service, which covers data residency and air-gapped requirements that Sumo Logic can't.
- No per-event index tax. Elastic charges close to raw per-GB or resource rates without a separate indexed-event meter layered on top, which makes it one of the cheaper credible managed options at high log volume (independent Elastic pricing analysis).
The catch
The savings are operational, not free. Self-managed Elasticsearch or OpenSearch means you own sharding, index lifecycle management, JVM tuning, and cluster health at 3am, and those costs regularly exceed the visible infrastructure spend. Elastic Cloud's resource-based pricing is harder to model from raw data volume than a straight per-GB plan, because you're sizing RAM, storage, and zones. And since the 2021 fork, features added in newer Elastic releases don't appear in OpenSearch, so the two stacks have diverged enough that "Elasticsearch" now means picking a side.
Pricing model
Elastic Cloud Hosted is resource-based: you pay for provisioned compute, memory, and storage across data tiers, with subscription tiers (Standard through Enterprise) that unlock features and raise the per-resource rate (Elastic pricing). Elastic's serverless observability option is consumption-based per GB ingested and retained. OpenSearch carries no license fee under Apache 2.0, so its cost is purely the managed service or the infrastructure and engineering time to run it yourself. For cost, the difference is that Elastic and OpenSearch scale on resources and volume, not on a per-event or per-host multiplier. That's predictable at high volume but asks you to pay in operational effort at the low end. To ballpark Elastic Cloud, size the hot, warm, and cold resource units you'll need and multiply by their hourly rates; for OpenSearch, model cluster infrastructure plus the engineering time to run it.
The verdict
Pick self-managed OpenSearch or Elasticsearch if you need data ownership and have a platform team that wants control. Pick Elastic Cloud if you want the search strength without running the cluster and can model resource-based billing. Avoid both if your team has no appetite for index lifecycle management and you'd rather not learn yet another query syntax.
4. Grafana Cloud
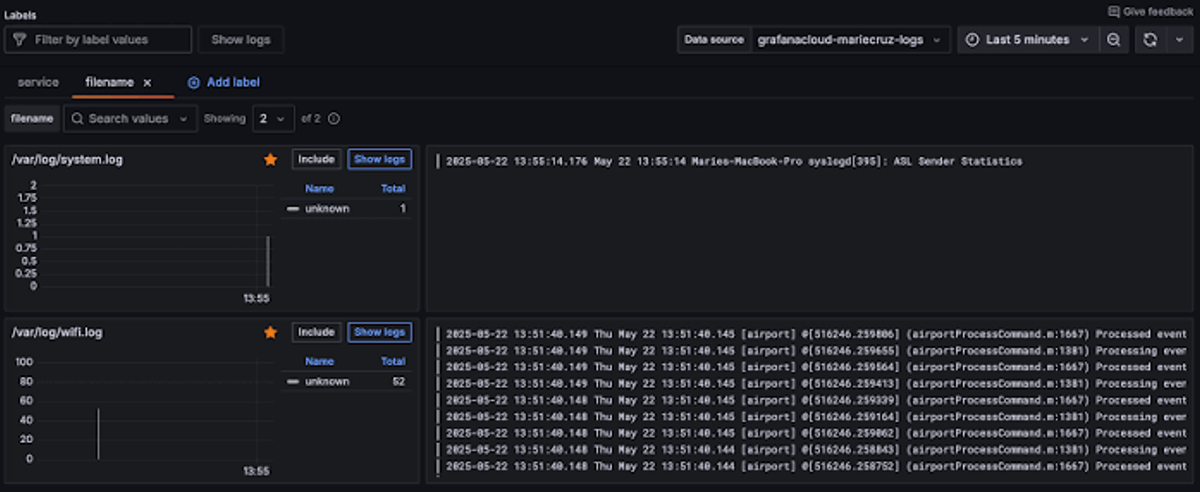
Grafana Cloud is the managed version of the widely deployed open-source observability stack: Loki for logs, Prometheus-compatible metrics, Tempo for traces, and Grafana for dashboards. For teams already living in Grafana dashboards, moving log analytics onto the same stack keeps everything in one visual layer, and the open-source editions give you a self-hosting path that Sumo Logic doesn't offer. Kubernetes collection uses Grafana's Alloy collector with its Kubernetes Monitoring Helm charts.
What's good
- Label-based log storage is cheap. Loki indexes log labels rather than full text, which makes log storage substantially cheaper than full-text-indexing platforms on equivalent volume, and it fits Kubernetes-heavy environments naturally.
- PromQL for metrics. If your team already knows Prometheus, the metrics query experience carries over directly, which removes one relearning curve.
- Genuine open-source path. You can run the stack yourself under open-source licenses and graduate to the managed cloud later, so you're not committing to SaaS on day one.
The catch
The architecture is federated: logs, metrics, and traces live in separate backends (Loki, the metrics store, Tempo), each with its own query language (LogQL, PromQL, TraceQL). That gives you portability per component, but cross-signal correlation is less seamless than a single-store platform, and your engineers juggle three syntaxes instead of one. Grafana's commercial business rests on monetizing that open-source stack, which shapes where investment lands and means the managed product carries multiple billing meters. Self-hosting removes the license cost but hands you the operational burden of running the backends and their object storage.
Pricing model
Grafana Cloud meters each signal separately. Logs bill in three parts per GB (a processing charge, a write charge, and a retention charge), metrics bill per thousand active series, traces bill per GB, and there are per-active-user fees plus a platform fee on the Pro plan, per Grafana's published pricing. The free tier is unusually generous, which makes evaluation easy. At scale, the compounding across six-plus product meters is the thing to model, and active-series cardinality is the classic bill-inflator: the same hosts can cost several times more without disciplined labeling. Query costs sit under a fair-use ratio tied to ingested volume, so heavy querying beyond that ratio adds charges. To ballpark it, sum active-series times the per-thousand-series rate, plus per-GB logs and traces across the three log meters, plus active users.
The verdict
Pick Grafana Cloud if your team is already Prometheus-and-Grafana native and wants log storage economics that beat full-text indexing, and you're comfortable operating across three query languages. Pick the self-hosted stack if you have the platform team and want to own the data. Look elsewhere if you want one unified query language and tightly correlated signals out of the box.
5. Coralogix
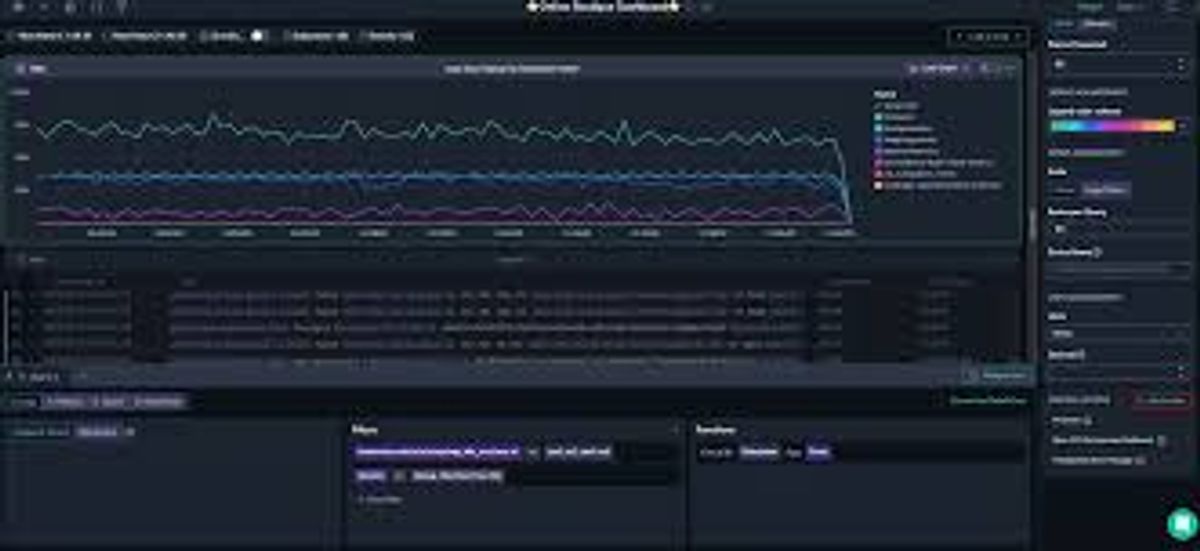
Coralogix is a full-stack observability and security platform built around an in-stream processing engine it calls Streama. Instead of indexing everything first and querying later, Coralogix analyzes telemetry in flight, then writes it to your own cloud object storage (Amazon S3 or Google Cloud Storage) in open Parquet format. That architecture is a direct answer to the two Sumo Logic pain points of unpredictable cost and vendor-held data. In Kubernetes, it deploys an OpenTelemetry Agent as a DaemonSet, with an eBPF option for zero-code capture.
What's good
- Data stays in your account. Telemetry lands in your own object storage in Parquet, which decouples retention cost from indexing and keeps historical data queryable without rehydration.
- Value-based routing. The TCO Optimizer (total cost of ownership) routes each data stream into Frequent Search, Monitoring, Compliance, or Blocked tiers based on policies you set, so a debug stream bound for archive never bills at the rate of data you search daily.
- OpenTelemetry-native ingestion. Coralogix accepts OTLP directly for logs, metrics, and traces, so OTel-instrumented teams migrate without changing instrumentation.
The catch
Coralogix rewards teams that actively manage their telemetry and can punish teams that don't. The savings come from configuring routing policies correctly; ingest everything into the Frequent Search tier without tuning, and the cost advantage evaporates. That's a real operational commitment, not a set-and-forget switch. Its query layer, DataPrime, is proprietary, so while your instrumentation stays portable through OTel, your queries, dashboards, and parsing rules don't travel if you leave. The platform is also less of a household name than the incumbents, though it rates well for support responsiveness on review sites like G2.
Pricing model
Coralogix charges per GB ingested with no per-host, per-user, per-query, or per-feature fees, at published rates that differ by signal (Coralogix pricing). The distinguishing mechanism is the TCO Optimizer, which lets a single gigabyte cost very different amounts depending on which pipeline it's routed to, so Compliance-tier data can drop to a fraction of Frequent Search rates. This makes the model highly controllable and predictable once policies are set, and it aligns cost with how you use each stream. To ballpark it, multiply each stream's ingest volume by the rate for the tier you'll route it to, so archive-bound data models at the Compliance rate rather than the Frequent Search rate. The tradeoff is that predictability depends on you doing the routing work upfront rather than the platform guessing for you.
The verdict
Pick Coralogix if you have meaningful log volume, want your data in your own cloud account, and your team will invest in routing policies to control spend. Skip it if you want a platform that's cheap without configuration, or if a proprietary query language is a dealbreaker for your investigation workflows.
6. Dash0
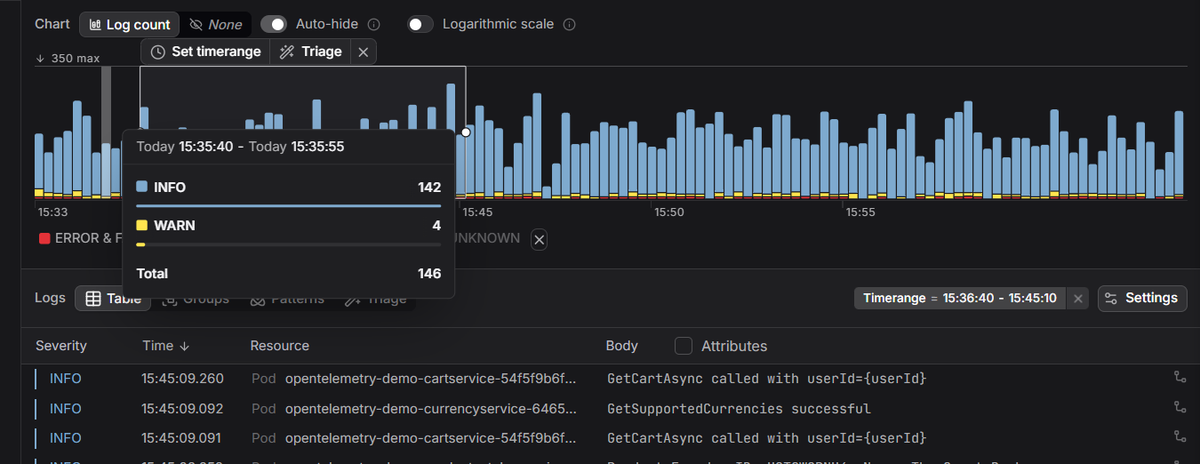
Dash0 is an OpenTelemetry-native observability platform covering logs, metrics, traces, real-user monitoring, and synthetic checks. Where most tools on this list added OTLP ingestion to an existing model, Dash0 is built around OpenTelemetry as the primary data model, and it uses PromQL as a single query language across all signals rather than a proprietary syntax. In Kubernetes, a Dash0 Operator handles collection.
What's good
- OTel-native ingestion. Dash0 accepts OTLP directly with no proprietary agent, so your Collector configuration and instrumentation stay portable if you later point them elsewhere. This covers the instrumentation-lock-in half of the migration, though dashboards and alerts still create switching cost.
- PromQL across every signal. One query language covers metrics, logs, and traces (Dash0 log management). For a team leaving Sumo Logic's proprietary search, reusing existing Prometheus knowledge removes the relearning curve rather than resetting it.
- Consumption pricing with built-in cost control. Billing is per million signals with no per-seat, per-host, or per-query fees, and the platform surfaces real-time usage, budget limits, spam filters to drop low-value telemetry before it's stored, and cost forecasts (Dash0 cost control).
The catch
Dash0 is SaaS-only, so it does not solve the data-residency or self-hosting requirement that pushes some teams off Sumo Logic; if that's your reason for leaving, OpenSearch or a self-hosted open-source stack fits better. Retention is asymmetric: metric data points and synthetic runs are kept for 13 months, but spans, logs, and web events are retained for 30 days (Dash0 pricing), so long-term log forensics needs an archive plan. It's also younger than the decade-old vendors, backed by a recent Series B: the mainstream log pipelines and OpenTelemetry sources are covered (Dash0 integrations), but a long-tail or niche technology may not yet have the same depth of prebuilt integration and auto-instrumentation coverage. And per-signal pricing still scales with volume: chatty microservices generate many spans, and high-cardinality metrics generate many data points, so cost discipline still matters even without per-host multipliers.
Pricing model
Dash0 charges per million data points for metrics, spans, log records, and web events, plus per thousand synthetic API check runs, with no per-seat fee and no base platform charge (Dash0 pricing). Because the meter counts signals rather than gigabytes, adding a useful attribute to a span doesn't create a new pricing dimension the way per-GB pricing penalizes rich metadata, which suits OpenTelemetry's richly attributed data. Higher volume still raises the bill, but the scaling is linear and the dimensions are few, so forecasting is a matter of estimating signal counts and applying published rates. To ballpark it, estimate monthly signal counts (metric data points, spans, and log records) and multiply by the published per-million rates, with no host or seat multipliers to layer on. The spam filter and real-time usage view exist to catch runaway volume before it becomes an invoice surprise. AI capabilities and coding insights are metered separately, so the core observability cost stays clean.
The verdict
Pick Dash0 if your core Sumo Logic job is observability rather than SIEM, your team is standardizing on OpenTelemetry, and you want PromQL portability with a per-signal bill you can predict. Skip it if you need self-hosting, long default log retention, or a mature catalog of niche integrations today. Start a 14-day free trial with full access if you want to test it against real telemetry.
Which tool fits your situation
- If security operations are the core job, none of the general observability platforms here fully replace a dedicated SIEM. Splunk with Enterprise Security, or a purpose-built security platform, is the honest choice. Migrating to a lighter observability tool means keeping security elsewhere.
- If you need self-hosting or data residency, Dash0 and Datadog are SaaS-only and won't help. Self-managed OpenSearch or Elasticsearch, or the self-hosted Grafana stack, give you data ownership at the cost of operational effort. Coralogix is a middle path, since it stores data in your own cloud account while running the control plane as SaaS.
- If adding headcount is off the table, weigh the operational staffing each option carries. Self-managed OpenSearch, Elasticsearch, and the self-hosted Grafana stack all cost engineering time to run and keep healthy. The SaaS platforms (Datadog, Coralogix, Dash0) and managed Splunk Cloud carry no operational staffing of their own, trading that for less control.
- If data handling is under review by security or compliance, the fully-SaaS platforms (Datadog, Dash0, and Sumo Logic itself) process and store telemetry in the vendor's environment, so vet each one's RBAC, PII redaction, retention controls, and compliance certifications before sending regulated data. Coralogix narrows the exposure by keeping stored data in your own object storage, and the self-managed stacks keep everything in your infrastructure while making those controls your responsibility.
- If you're standardizing on OpenTelemetry and want query portability, the OTel-native platforms (Dash0 and Coralogix) reduce instrumentation lock-in and let you reuse open query languages, versus bolting OTLP onto a proprietary model.
- If breadth and interface polish outrank everything, Datadog remains the most complete single pane, provided you'll manage the multi-meter bill.
- If you already run Prometheus and Grafana, Grafana Cloud keeps you in a familiar visual layer with cheap label-based log storage, as long as three query languages don't bother you.
- If controlling spend is the whole reason you're leaving, Coralogix's routing tiers and Dash0's per-signal model both attack cost predictability directly, from opposite architectural directions.
Final thoughts
The six alternatives sort into three trades. Datadog and Splunk are the mature, high-coverage platforms you pay a premium for, in money and in proprietary lock-in. Elastic, OpenSearch, and the Grafana stack are the open-source-rooted options that trade license cost for operational ownership and, in Grafana's case, a federated architecture with a query language per signal. Coralogix and Dash0 are the newer, OpenTelemetry-native platforms that treat open standards and cost transparency as the starting point rather than a later addition.
The gap most Sumo Logic migrations expose is the combination of a proprietary query language, an unpredictable consumption bill, and vendor-held data. Dash0 sits directly on that gap for teams whose core job is observability: OTLP ingestion keeps instrumentation portable, PromQL across every signal means engineers reuse Prometheus knowledge instead of learning a new syntax, and the per-signal model with built-in budget limits and spam filters makes the bill something you forecast rather than discover. It won't help if you need self-hosting or a full SIEM, and it's younger than the incumbents, so weigh those against how much the query-and-cost problem is actually driving your search.
Sign up for a free Dash0 account with 14 days of unlimited access if you want to test the OpenTelemetry path against your own telemetry.
Frequently asked questions
Does Sumo Logic support OpenTelemetry? Yes. Sumo Logic ingests telemetry through the OpenTelemetry Collector for logs, metrics, and traces, and its real-user monitoring is built on OpenTelemetry. The limitation is the proprietary search language on top, which doesn't carry over to other platforms.
Can I self-host a Sumo Logic alternative? Yes, some of them. OpenSearch, self-managed Elasticsearch, and the open-source Grafana stack all run on your own infrastructure. Splunk offers a self-managed Enterprise edition. Datadog and Dash0 are SaaS-only. Coralogix runs as SaaS but stores your data in your own cloud object storage.

