- 45 min read
7 Better Stack Alternatives in 2026
Better Stack sells one clean idea: monitoring, on-call, status pages, and telemetry in one place, on one bill, with no second vendor to integrate. For a five-person team running a handful of services, that idea holds up well. The free tier is real, the status pages look good enough to put in front of customers, and the phone alerting works. And life was good.
Then you grow. You add a second status page, and want the Better Stack footer gone. Your compliance reviewer asks for audit logs and Okta. Somebody wires up call routing so support calls page the on-call engineer. Your log volume triples because a chatty service ships debug output to production. Each of those is a separate line on the bill, and none of them moved because you got more value out of the core product.
One reason teams start shopping is depth. Better Stack accepts OpenTelemetry data over OTLP, the OpenTelemetry protocol, and stores logs, traces, and metrics, but it grew outward from uptime monitoring rather than inward from a tracing model, and that shows up when you try to debug a distributed system rather than confirm that a host answered a ping. If you are asking questions about tail latency across a request path, you are asking more of the telemetry layer than Better Stack was originally shaped for.
Better Stack is really two products sharing a login: an external monitoring and incident workflow product, and a telemetry backend. Almost every tool marketed as a Better Stack alternative replaces one half convincingly and the other half badly, or not at all. Pick wrong and you replace a single bill with two vendors and a webhook holding them together.
This comparison treats that split as the central question rather than a footnote. Every tool below is assessed on which half of Better Stack it replaces, what its billing meters are, how long it keeps your data by default, and what happens to your configuration if you leave. Where a tool only covers part of the job, that is stated plainly instead of being smoothed over.
Why replacing Better Stack is harder than swapping a monitoring tool
Scope is what makes the comparison awkward. A single Better Stack account can be doing uptime checks from global probes, running Playwright transaction checks, watching cron jobs through heartbeats, paging an on-call rotation by phone and SMS, hosting a public status page, ingesting logs and traces, storing Prometheus and OTel metrics, catching frontend exceptions through a Sentry-compatible software development kit (SDK), recording session replays, and answering questions through a Slack-native AI agent. No single competitor covers all of that. Working out which parts you rely on is the first job, and it is harder than it sounds, because the cheap parts and the load-bearing parts are not the same parts.
Then there is the shape of the bill. Better Stack's pricing page publishes its rates openly, which is more than several competitors manage, but the number of independent meters is high. Responder licenses run $34 per month each, or $29 annually, while team members who only need telemetry access cost nothing. Uptime monitors come in packs of 50 for $25 per month beyond the 10 included. Heartbeats come in packs of 10 for $20. Telemetry is sold either as bundles or as ingestion plus retention per gigabyte. Advanced Slack and Teams incident workflows add $9 per responder. Status page extras are billed per page, and they are not small: white-labeling a page costs $250 per month, SSO protection on a page costs $250 per month, and password protection costs $50. Call routing is $250 per phone number. Audit logs are $250. Okta and Azure SSO are $5 per user. Region matters too, since ingestion in Singapore costs roughly three and a half times what it costs in Europe.
None of those rates is hidden, and several are cheap for what they do. The problem is forecasting. Fifteen meters that each look reasonable in isolation produce a bill that is hard to predict a year out, and the enterprise controls a security review will ask for sit behind the most expensive add-ons.
Check the retention numbers closely, because they are easy to misread. The included telemetry allowance keeps logs, traces, and web events for three days. Telemetry bundles extend that to 30 days for logs. Anything longer is priced per gigabyte per month, and metrics retention costs considerably more per gigabyte than log retention does. If your debugging habits assume last week's logs are still there, check which plan you are actually on.
Nobody quotes a number for portability, which is why it gets skipped. Better Stack accepts OTLP, which means your instrumentation is portable in the sense that matters most: you can point a standard OpenTelemetry collector somewhere else without touching application code. What does not travel is everything you built on top. Monitors, escalation policies, dashboards, Vector Remap Language (VRL) transforms, status page configuration, and alert rules live in Better Stack's own schema. A Terraform provider makes that configuration reproducible. Reproducible is not portable. Nobody's Terraform resources migrate to a different vendor's API. Be honest about that switching cost when you evaluate anything below, including Dash0. OpenTelemetry reduces instrumentation lock-in. It does not eliminate lock-in.
We will evaluate each tool against these criteria:
- Suite coverage: which half of Better Stack it replaces, and what you still need to buy
- Telemetry model: whether OTel data keeps its shape, and which query languages you get
- External monitoring: uptime checks, cron and heartbeat monitoring, browser and Playwright checks
- On-call and incident response: rotations, escalation, phone and SMS paging, postmortems
- Status pages: whether they exist, and what the good ones cost
- Cost model: what dimensions the vendor bills on, and what those dimensions reward
- Retention: what you get by default and what longer costs
- Portability and residency: self-hosting, region choice, and what your configuration is worth if you leave
At a glance
Better Stack is included as the baseline row so you can see what you are trading away alongside what you are getting.
| Tool | Suite coverage | Telemetry model | External monitoring | On-call | Status pages | Cost model | Default retention |
|---|---|---|---|---|---|---|---|
| Better Stack | Both halves | OTLP in, proprietary wide-event storage; SQL, PromQL, drag-and-drop | Uptime, heartbeats, Playwright | Built in, phone and SMS included per responder | 1 included, extras per page | Responder licenses + monitor packs + telemetry GB + per-page add-ons | 3 days included, 30 days on bundles |
| Datadog | Both halves | OTLP supported, proprietary storage; per-signal query editors | Synthetics, API and browser | Datadog On-Call, seat-based | Included with Incident Response bundle | Per host, per GB, per indexed event, per session, per test run, per seat | 15 days indexed logs, 15 months metrics |
| Grafana Cloud | Both halves, cloud only | OTLP and Prometheus native ingest, separate backend per signal; PromQL, LogQL, TraceQL | Synthetic Monitoring, per execution | Grafana Cloud IRM, per active user | Not offered | Platform fee + active series + GB + per active user, several meters | 14 days on free tier, configurable on paid |
| Site24x7 | Both halves, status pages sold separately | Proprietary agents and collectors; own query tooling | Uptime, network, synthetic transactions | Basic schedules and escalation | StatusIQ, separate subscription | Plan tier + monitor licenses + add-on packs | Varies by plan and add-on |
| Dash0 | Telemetry half plus synthetic and web monitoring | OTel-native end to end; PromQL, SQL, and natural language across signals, Perses dashboards | Synthetic API and uptime checks | Alerting and notifications only, no rotations | Not offered | Per million spans, log records, metric data points, web events; per thousand check runs | 30 days spans and logs, 13 months metrics |
| Sentry | Application half, plus basic uptime and cron | OTLP-compatible SDKs, proprietary storage; issue-centric UI | 1 uptime and 1 cron monitor included, extras priced per monitor | Not offered, integrates with pagers | Not offered | Plan tier + errors, spans, logs, replays; per extra monitor | 90 days on paid plans, varies by category |
| OneUptime | Both halves, self-hostable | OTel-native ingest; own query UI | Uptime, synthetic, probes in multiple regions | Rotations, escalation, phone and SMS | Included, unlimited subscribers | Free self-hosted, usage-based cloud plans | Configurable when self-hosted |
| UptimeRobot | External monitoring and status pages only | None; no logs, metrics, or traces | HTTP, keyword, ping, port, API, UDP, DNS, SSL, heartbeats | Alert contacts and integrations, no rotations | 1 free, 3 on Solo, 100 white-label on Team | Flat tier by monitor count and interval, plus login seats and SMS credits | 3 months free, 12 on Solo, 24 on Team |
1. Datadog
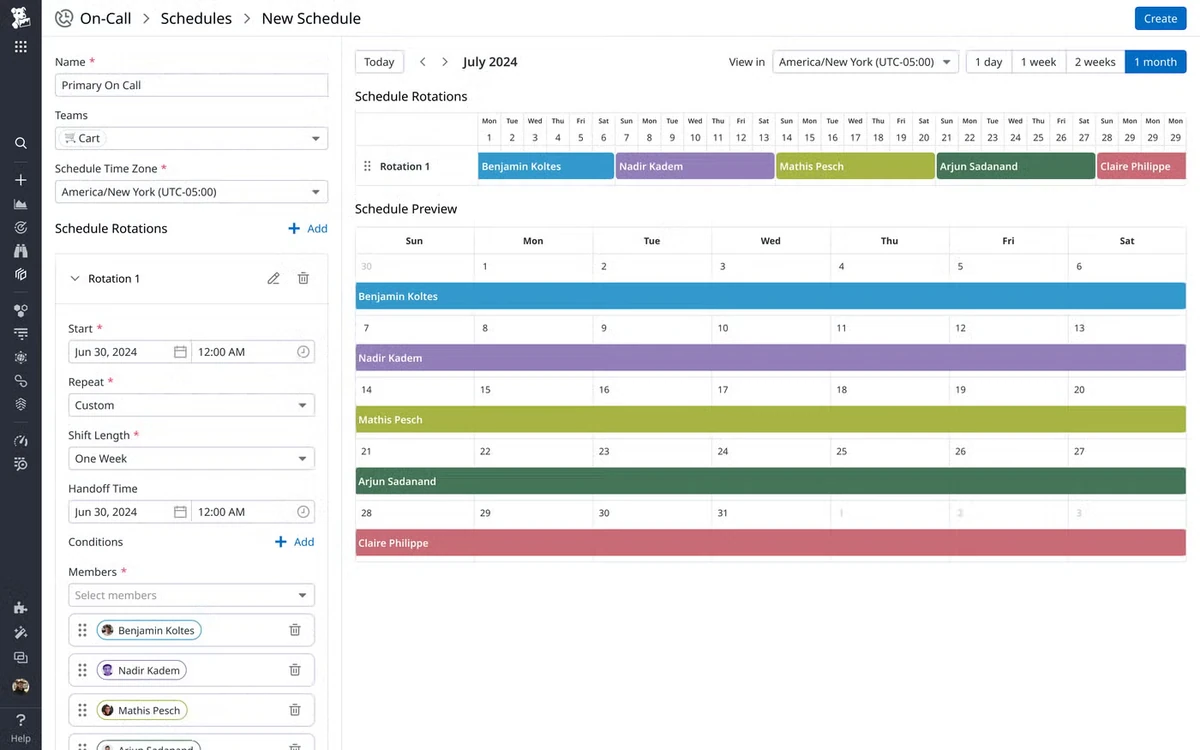
Datadog is the most complete answer to "one vendor for everything," and by 2026 that includes the incident workflow half that Better Stack built its name on. Datadog On-Call handles rotations and escalation, Incident Management handles the response process, and the Incident Response bundle combines the two and includes status pages. On the telemetry side it is the deepest product in this comparison by a wide margin.
What's good
- Debugging depth that nothing else here matches. Continuous Profiler attributes CPU and memory to specific functions, Dynamic Instrumentation adds log lines to running production code without a redeploy, and Watchdog flags anomalies you did not write a monitor for. If you left Better Stack because trace-level questions were hitting a wall, this is the other end of the spectrum.
- Integration coverage is the industry benchmark. Several hundred maintained integrations means the odd piece of infrastructure in your stack is probably already covered with a dashboard and monitors you did not have to build.
- Synthetics and real user monitoring (RUM) are first-class products. API and browser checks, session-level frontend data, and Core Web Vitals all live alongside your backend telemetry, so a failing check links to the trace behind it.
The catch
Datadog's problem is not the list price. It is the structure. Datadog bills roughly two dozen products on different meters at once. Infrastructure is per host, application performance monitoring (APM) is per host again on top of that, logs are billed once to ingest and a second time per million events to index, RUM is per thousand sessions, synthetics are per test run, and On-Call is per seat. Custom metrics deserve their own warning: each host includes an allotment, and OpenTelemetry metrics count against it, so an OTel-instrumented fleet can trigger surcharges that a Datadog-agent fleet would not.
Host counting uses a high-water mark, so a five-day traffic spike that doubles your fleet bills the whole month at the peak. If I had to bet on where your first surprise invoice comes from, it is this line and autoscaling.
The seat model on the incident side also cuts against how Better Stack works today. Better Stack charges for responders and gives telemetry access away; Datadog charges a seat for anyone who substantively participates in incident response. If your culture is that everyone joins the incident channel, price that out before you migrate.
Pricing model
Datadog bills on more dimensions than any other tool here, and the dimensions interact. Per-host pricing means your bill tracks infrastructure topology rather than data volume, which punishes container-dense and short-lived workloads. Per-indexed-event log pricing charges you for making logs searchable. That is exactly backwards during an incident. The standard workaround is to index a small slice and archive the rest to Flex tiers, and those tiers do not support monitors. Per-seat incident pricing discourages broad participation in incident response. Nothing about the model is deceptive, and the pricing page is detailed, but forecasting requires you to estimate host count, log ingest, index ratio, span volume, session count, test runs, and seats independently, and be right about all of them.
The verdict
Pick Datadog if you need genuine APM depth, you have the volume discipline to keep the meters in check, and you would rather negotiate one large contract than manage several vendors. It is a poor fit if you came to Better Stack specifically for cost predictability, or if you are a small team that mostly needs uptime checks, paging, and a status page, in which case you will pay platform prices for a fraction of the platform.
2. Grafana Cloud
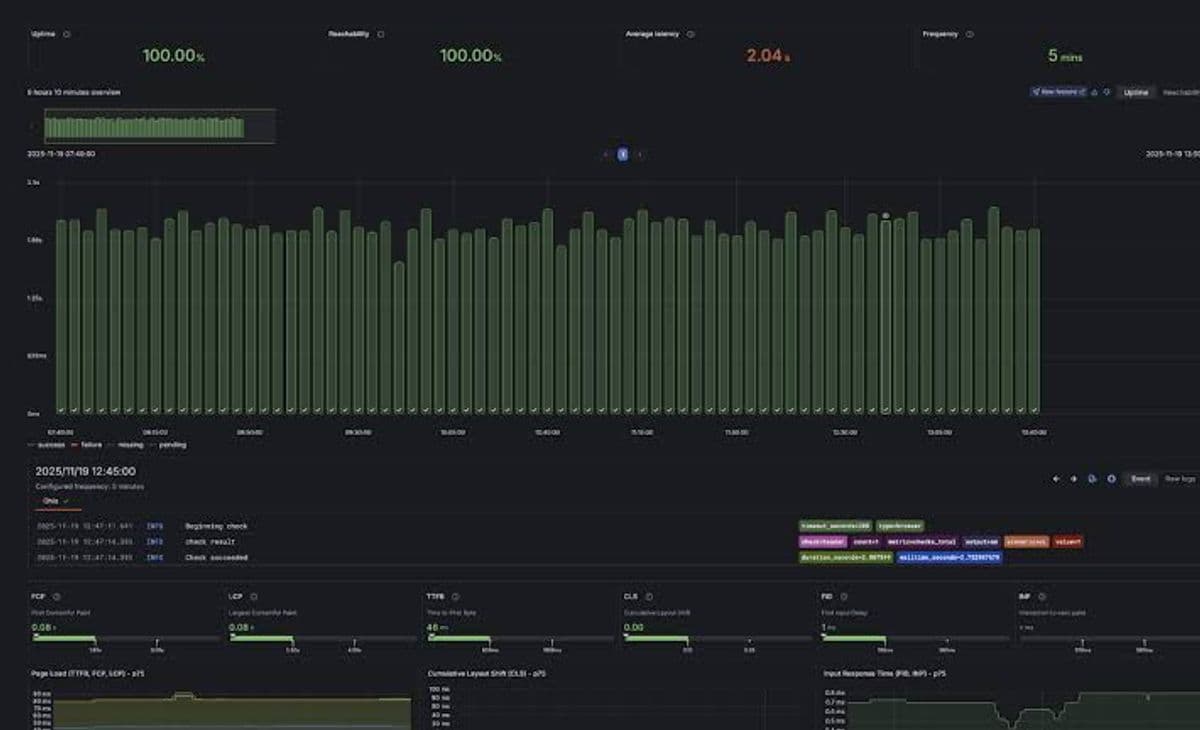
Grafana Cloud is the managed version of the stack a lot of teams would build themselves: Prometheus-compatible metrics, a log store, a trace store, continuous profiling, dashboards everyone already knows how to use, k6 for load testing, Synthetic Monitoring for external checks, and Grafana Cloud IRM, its incident response and management product, for on-call. If your team already lives in Grafana dashboards, the migration cost is mostly about data, not habits.
What's good
- The free tier is unusually generous and does not expire. Ten thousand active metric series, 50 GB each of logs and traces, three active users, and a large allowance of synthetic check executions is enough to run a small production system indefinitely. Evaluation costs you nothing but time.
- Open-source query languages you can take with you. PromQL, LogQL, and TraceQL are all open specifications, and Prometheus-compatible metrics mean your existing recording rules and alerts largely survive the move.
- Dashboards as a genuine ecosystem. Community dashboards for almost any exporter, mature provisioning via Terraform, and a UI your team probably already knows are real advantages that no newer vendor has matched.
The catch
The on-call story changed in a way that matters if self-hosting was part of your plan. Grafana Labs put Grafana OnCall OSS, the self-hosted edition, into maintenance mode in March 2025 and archived the repository on March 24, 2026, deactivating the Cloud Connection that delivered SMS, phone, and push notifications to self-hosted installs on the same date. The supported path is Grafana Cloud IRM, and IRM is cloud only. Teams that chose the Grafana stack precisely because they could run it themselves lost the paging piece.
Architecturally, each signal still lives in its own backend with its own query language. That is a reasonable engineering decision and it scales well. The consequence is that cross-signal correlation becomes something you configure through links and data source relationships rather than something true of the data model itself. Moving between a metric, a log line, and a span means switching query languages. Everyone who is not fluent in all three pays that tax on every incident.
There are also no public status pages, so you need another vendor for customer communication.
Pricing model
Grafana Cloud bills on active metric series, gigabytes of logs and traces split across processing, writing, and retention, per active visualization user, per active IRM user, per synthetic check execution, per k6 virtual user hour, and a platform fee on top. Billing on active series rather than data volume is the most consequential choice: it makes cardinality the thing that drives your bill, so one engineer adding a user ID or request ID label can multiply cost without changing log or trace volume at all. That model rewards label discipline. It also punishes teams who have not built that discipline yet, and that is most teams. The per-active-user meters on visualization and IRM also mean growth in headcount shows up on the bill even when data volume is flat.
The verdict
Grafana Cloud is the strongest option if your team is already Prometheus-shaped, you value open query languages, and you want the option of running parts of the stack yourself. Skip it if you need on-call in your own infrastructure, if cardinality management is not something your team wants to think about, or if a hosted status page is non-negotiable.
3. Site24x7
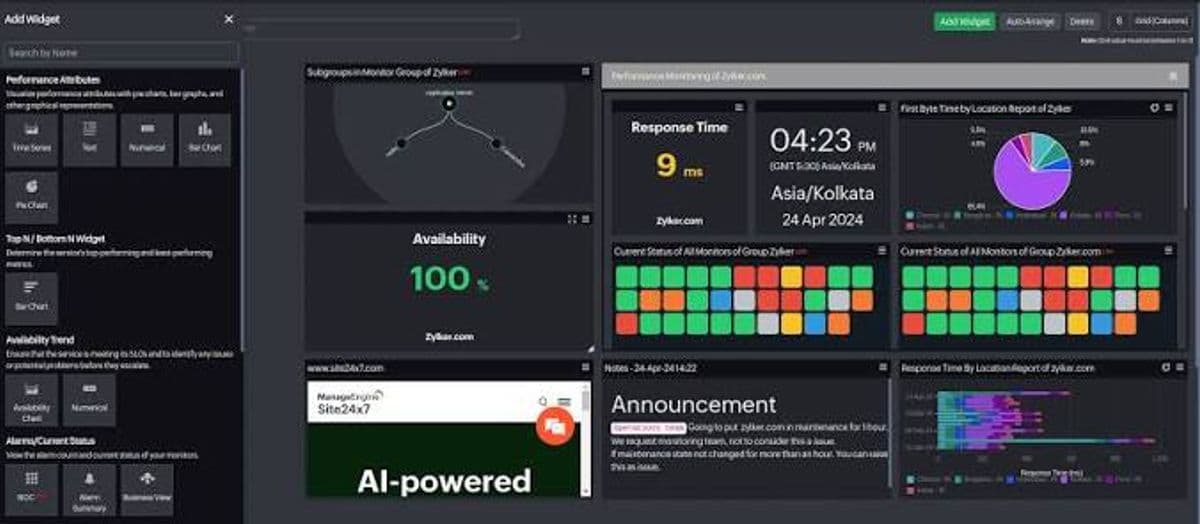
Site24x7, from Zoho, is the option most often overlooked in comparisons written for startup audiences, and it deserves a place here because its breadth overlaps Better Stack's more than most. Website and uptime monitoring, server and cloud monitoring, network device monitoring, APM, log management, RUM, and synthetic transaction monitoring all sit in one product, with published plans that start around $10 per month.
What's good
- Entry pricing is low for the coverage. Published plans start near $10 per month and top out at a few hundred, with monitor allowances included at each tier. For small IT teams the value per dollar is hard to argue with.
- Network and infrastructure monitoring most competitors skip. Simple Network Management Protocol (SNMP) device monitoring, NetFlow, and network configuration management are covered thoroughly. If your environment includes switches, firewalls, and on-prem servers rather than only containers, this is the only tool here that takes that seriously.
- Long operating history and managed service provider support. Multi-tenant MSP plans, mature alerting integrations, and a decade-plus of production use mean fewer rough edges in the boring parts.
The catch
Decoding the licensing model will cost you an afternoon. Site24x7 counts "basic monitors," advanced monitors, and host monitors differently, and layers add-on packs for log volume, RUM pageviews, synthetic runs, and network components on top of the plan tier. Working out what your environment costs means mapping every resource type to a license category first, and the pricing page itself is where you discover that a website and a server are not the same kind of monitor.
Status pages are a separate product. StatusIQ has its own pricing and its own subscription, so replacing Better Stack's bundled status page means adding a second Zoho line item.
On the telemetry side, this is not an OpenTelemetry-first product. It supports OTel ingestion, but the design center is proprietary agents reporting into Zoho's own model, so the OTel-native correlation and portability story is weaker than Grafana Cloud's, Dash0's, or OneUptime's. On-call is functional rather than sophisticated: schedules and escalation exist, but if you want incident command workflows, thread-per-incident Slack automation, and AI postmortems the way Better Stack does them, this is a step down.
Pricing model
Site24x7 bills a plan tier plus monitor licenses plus add-on packs. Because the primary unit is the monitored resource rather than data volume, your bill tracks how many things you watch rather than how loud they are. Stable infrastructure stays predictable, and a lot of quiet endpoints stay cheap. The flip side is that resource-count pricing does not reward you for reducing telemetry noise, and log and RUM add-ons reintroduce volume-based cost anyway. Predictability is good at the plan level and poor at the add-on level, since you need to know your pageview and log volumes in advance to size the packs.
The verdict
Choose Site24x7 if your environment is mixed IT infrastructure rather than pure cloud-native, you want broad coverage at the lowest entry price here, and your on-call needs are modest. Look elsewhere if you are a cloud-native engineering team that cares about OpenTelemetry portability, or if bundled status pages were a reason you liked Better Stack.
4. Dash0
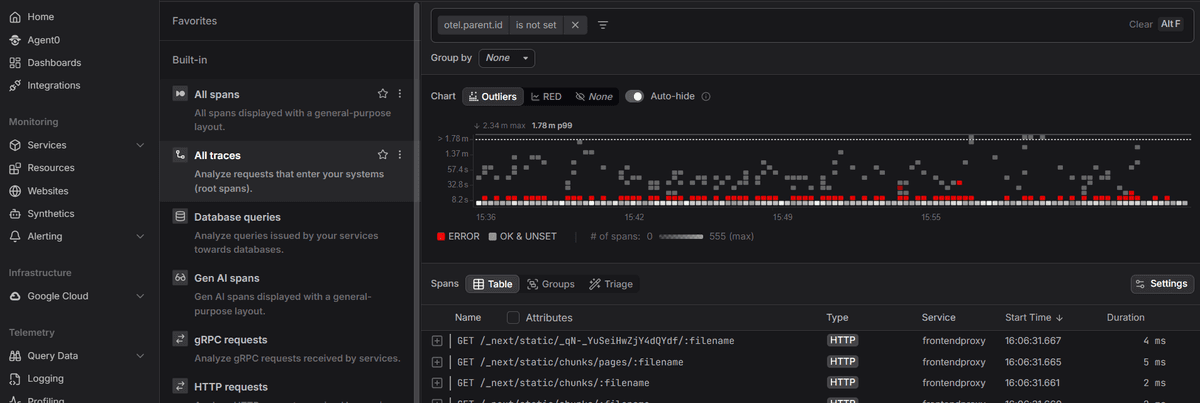
Dash0 is an OpenTelemetry-native platform built by the team behind Instana, and it addresses the telemetry half of Better Stack rather than the whole footprint. Everything runs on one data layer, SignalStore, which holds logs, metrics, traces, profiles, events, and RUM in a single store queryable through PromQL, SQL, or natural language. Three products sit on top of it: Observability covers Kubernetes, infrastructure, services, log management, dashboards, synthetic checks, and website monitoring; Agent0 is an AI SRE that investigates production; and Darkplane sits upstream of the deploy, tracking what your coding agents build.
What's good
- Open interfaces rather than a house dialect. PromQL runs across every signal instead of metrics only, SQL queries logs and events, and existing Prometheus alert rules import and run unchanged with Alertmanager forwarding intact. Dashboards are built on Perses, a CNCF project, so their definitions stay portable. There is also an MCP server, a CLI, and an API, which means agents and scripts read the same data over the same interfaces engineers use.
- One agent, two modes, no seat tax. Agent0 Chat investigates on request, correlating signals, following the problem into your code through the GitHub integration, and drafting the fix as a pull request you review. Agent0 Automations runs the same loop on a trigger or schedule with nobody present. Both draw on shared task-based credits rather than per-seat AI fees.
- Cost control before ingestion. Spam filters drop a noisy log pattern or metric series from the UI, and filtered data never reaches storage or the bill. Those rules export to the OpenTelemetry Transformation Language (OTTL), so the logic stays standard rather than becoming configuration you cannot reuse.
The catch
Dash0 does not page anyone and does not host a status page. Alerting notifies through email, Slack, and webhooks and forwards to Alertmanager, so routing into a pager you already run works fine, but on-call rotations, escalation policies, and phone or SMS paging live in another tool. For teams already running PagerDuty or incident.io beside their telemetry platform, that changes nothing. If Better Stack's built-in rotations and status page were the reason you were there, it means two vendors where you had one.
Retention differs by signal. Metric data points and synthetic check runs are kept for 13 months, while spans, log records, and web events default to 30 days. Longer retention are available, so remember to bring this up if that's something you need. Confirm the number you need against the default rather than assuming.
The three products bill on separate meters: Observability on telemetry volume, Agent0 on task credits, AI Coding Insights per user. Each cost stays tied to what you actually use, at the price of modeling three lines instead of one. Parts of the wider roadmap are labeled as such, with AutoMerge still ahead and spam filtering the SignalControl capability shipping today.
Auto-instrumentation through the open-source Operator covers the common runtimes rather than everything, so a less usual stack may need manual OTel SDK work, and the integration catalog is younger than Datadog's or Site24x7's. Dashboards travel through Perses and instrumentation through OTLP, though alert rules and automations still carry switching cost, as they would anywhere.
Pricing model
Dash0 bills per million metric data points, spans or span events, log records, and web events, and per thousand synthetic check runs, at published rates with no base platform fee and no per-seat charge for the observability platform. Agent0 adds task-based credits, where a task is an investigation, a pull request, or a documentation update, so an AI-heavy month costs more than a quiet one. AI Coding Insights is billed per user.
Per-signal pricing does not penalize rich attributes, and there is no custom-metric surcharge or cardinality penalty, which inverts Grafana Cloud's active-series incentive. Volume still costs money, so the lever is sampling low-value telemetry rather than stripping metadata from what you keep. Budget limits and spend forecasting make the bill tractable, though only as good as your metric hygiene: high-cardinality metrics scraped every 15 seconds across many services add up fast.
The verdict
Dash0 fits teams that left Better Stack over telemetry depth and OTel fidelity rather than over paging, that want per-signal pricing with no seat tax on the platform, and that already run Prometheus or Kubernetes. It is the wrong choice if a single bundled vendor for on-call and status pages is the requirement, or if you need log retention beyond 30 days.
Start a free Dash0 trial with 14 days of unlimited access and no credit card.
5. Sentry
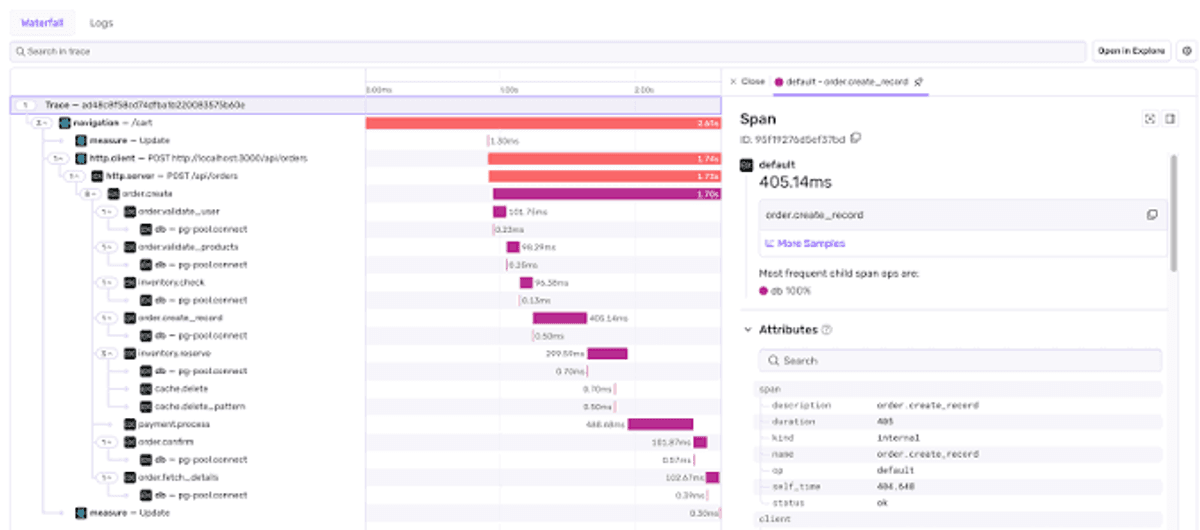
Sentry approaches the problem from the application inward rather than the infrastructure outward. It started as error tracking and has grown into tracing, logs, session replay, profiling, cron monitoring, uptime monitoring, and an AI debugging agent. For a product engineering team whose incidents are usually "this deploy broke checkout" rather than "a node went away," it is often a better fit than a platform-shaped tool.
What's good
- Error debugging that no platform here matches. Stack traces with source context, release tracking, breadcrumbs, and issue grouping that actually groups. Session replay tied to the exception means you watch what the user did before it broke.
- Unlimited users on every plan. Seats are not a billing dimension, which means the whole team can look without a licensing conversation. That is the same instinct behind Better Stack's free team members.
- Cheap entry that maps to what small teams need. The Team plan runs $26 per month annually and includes 50,000 errors, 5 GB of logs, 5 million spans, and one uptime and one cron monitor, which covers a small SaaS product properly.
The catch
The uptime and cron monitoring are real but thin. Paid plans include one of each, and additional monitors are priced individually at $1.00 per uptime monitor and $0.78 per cron monitor per month. That is inexpensive, but there is no multi-step transaction monitoring in the Playwright sense, no traceroute diagnostics, and the check configuration is nowhere near what a dedicated uptime product gives you. Replacing 60 Better Stack monitors and 20 heartbeats here means running the equivalent of a monitoring product inside a product that treats monitoring as a side feature.
There is no on-call scheduling and no status page. Sentry expects to hand off to PagerDuty or similar.
Infrastructure monitoring is out of scope. Host metrics, Kubernetes state, and network data are not what this product does, so if Better Stack's metrics side was load-bearing for you, Sentry alone leaves a gap. Costs also climb sharply once you cross the included quotas, and Seer, the AI debugging agent, is billed per active contributor on top of everything else.
Pricing model
Sentry bills a plan tier plus consumption across separate quota categories: errors, spans, logs, replays, attachments, and monitors, with reserved capacity available at a discount over pay-as-you-go. The category split is where forecasts go wrong, because you can be well within your error quota and still get a surprise from span volume after turning on tracing at a high sample rate. Per-event pricing rewards filtering noise at the SDK level. Spike protection also throttles ingestion automatically when volume jumps, a guardrail few vendors bother to build. Seat-free pricing means headcount growth is free. The unpredictability lives in the quota categories you have not tuned yet, and Sentry's pricing page is worth reading category by category before committing.
The verdict
Sentry suits product teams whose reliability problems are mostly application bugs and frontend regressions, and who already page through another tool. Pair it with a dedicated uptime and on-call product and you have a strong stack. Do not expect it to replace Better Stack's monitoring and incident halves on its own.
6. OneUptime
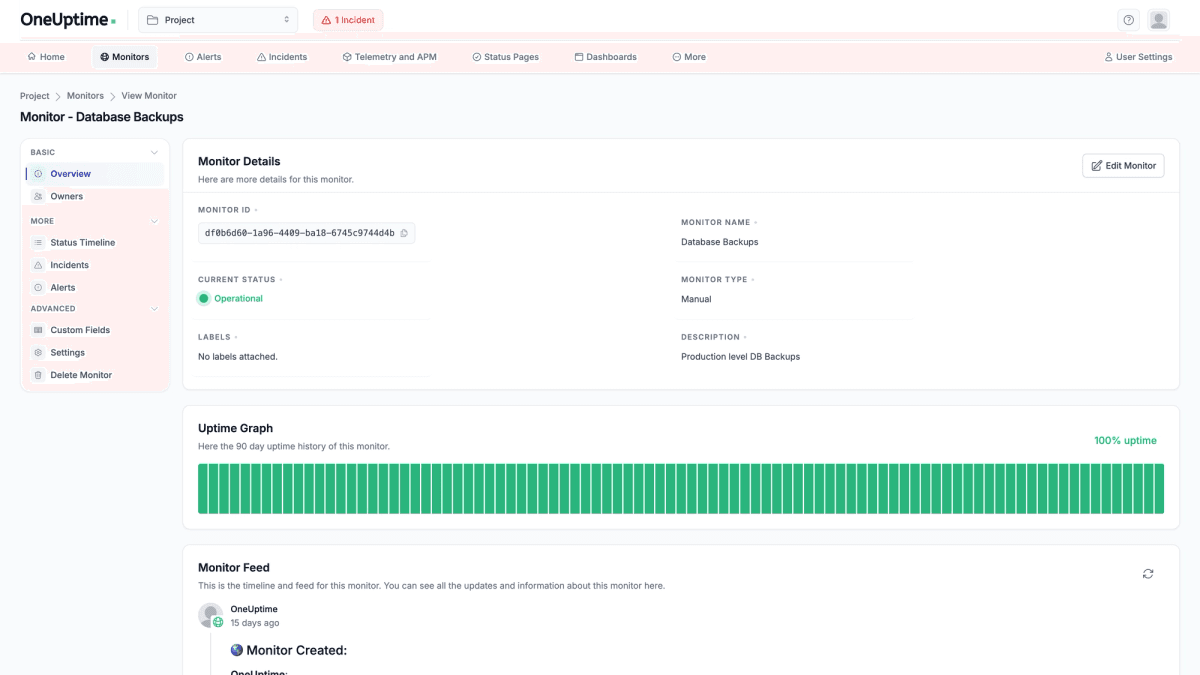
OneUptime is the closest thing here to a one-to-one open-source equivalent of Better Stack. Uptime monitoring, status pages, on-call rotations with escalation, incident management, logs, traces, metrics, error tracking, dashboards, and runbooks all ship in one Apache 2.0 licensed application that you can self-host or buy as a hosted plan.
What's good
- Feature coverage that maps to Better Stack. Monitors, status pages with unlimited subscribers, escalation policies, incident timelines, postmortems, and OTel telemetry ingestion in one place. Very few products cover both halves, and fewer still let you run them yourself.
- Apache 2.0 rather than open core. The license is permissive and the features are not split across a free tier and a paid enterprise edition, which is a meaningfully different deal from most "open source" observability vendors.
- Data residency is entirely yours. Self-hosting means logs, traces, and customer status data stay in infrastructure you control, which resolves the compliance conversations that hosted-only vendors cannot.
The catch
I like this project more than I would recommend it to a three-person team, and the reason is operational. Self-hosting an observability platform is a commitment. You are running the application, its databases, a telemetry store, and multi-region probes if you want checks from more than one place. Someone has to patch it, upgrade it, monitor it, and be responsible when the thing that monitors production is itself down at 3am. That cost appears on no pricing page. It is frequently larger than the SaaS bill it replaced.
Then there is maturity. The project has roughly 6,800 GitHub stars and an active development pace, but it is a smaller engineering effort than Datadog or Grafana, and it shows in polish, integration breadth, and documentation depth. Some capabilities listed on the marketing site are newer than others, so verify the specific features you depend on against the current release rather than the feature list.
Phone and SMS paging depends on your own Twilio credentials when self-hosted, which is more setup than Better Stack's included unlimited phone alerts, and the per-message cost becomes yours.
Pricing model
Self-hosting costs infrastructure and staff time rather than license fees. You trade a predictable subscription for a roughly predictable compute bill plus an unpredictable engineering commitment. The hosted plans are usage-based and sit in the tens-of-dollars-per-month range for small teams, with the full feature set included rather than gated behind add-on SKUs. The absence of per-page status page fees, per-responder licenses, and per-user SSO charges is the sharpest contrast with Better Stack's model: the dimensions that make a Better Stack bill grow are simply not billing dimensions here. Whether that is cheaper overall depends entirely on how you value the engineering time self-hosting consumes.
The verdict
OneUptime is the right call if you have a platform team, a data residency requirement, or a philosophical preference for owning your reliability tooling, and you want Better Stack's feature shape without Better Stack's add-on meters. It is the wrong call if your team is small enough that nobody has time to operate another stateful service, in which case a hosted product is cheaper once you price the hours.
7. UptimeRobot
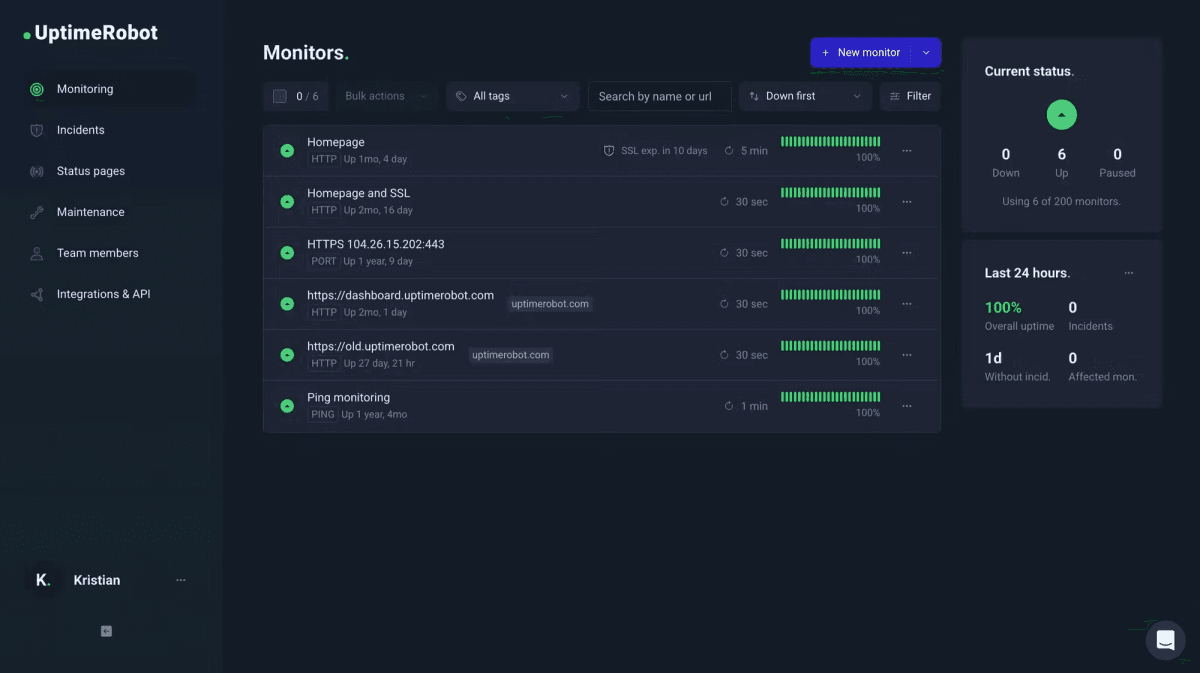
UptimeRobot is the narrowest tool in this comparison and the one most likely to be what a departing Better Stack user actually needs. It does external checks and status pages, nothing else. No logs, no metrics, no traces, no application performance monitoring. If your Better Stack account was mostly monitors, heartbeats, and a public status page, with the telemetry side barely touched, this replaces the part you used at a fraction of the price.
What's good
- The free tier is the most generous in the category. Fifty monitors at five-minute intervals, one status page, and three months of retention, no credit card. Better Stack's free tier gives you 10. The pricing page positions Free for hobby and non-profit projects, so read the terms before running a business on it.
- Monitor type coverage is broad for the price. HTTP and HTTPS, keyword, ping, port, API with custom headers and JSON validation, UDP, DNS, SSL and domain expiry, and heartbeat checks for cron jobs. Multi-location checks span four regions with region-specific alert thresholds.
- Status pages are not a separate purchase. Solo includes three pages on your own domain, Team includes 100 with white-labeling and password protection, and Scale removes the cap. Compare that with the $250 per page per month Better Stack charges to white-label a page.
The catch
There is no on-call scheduling. The feature comparison table lists alert contacts, integrations, and recurring notifications, but no rotations, no escalation policies, and no follow-the-sun scheduling. UptimeRobot expects you to route into PagerDuty, and PagerDuty integration requires Team or above. For a team that relied on Better Stack's built-in rotations and unlimited phone alerts per responder, this is the biggest functional step down in the article.
Phone and SMS alerting runs on credits rather than an allowance. Credits are one-time purchases, from $3 for 10 up to $100 for 1,000, they do not renew with your subscription, and consumption runs one to five credits per message depending on country, with voice calls costing two everywhere. A noisy week drains the balance quietly, which is a different failure mode from Better Stack's unlimited included phone alerts.
Seats and intervals are both plan-gated. Free and Solo include no login seats, Team includes three and Scale five, with extras at $15 to $19 per month each, so a ten-person team on Team adds roughly $105 to $133 monthly on top of the base plan. Check intervals are set by tier rather than per monitor, which means you cannot run checkout at 30 seconds and the marketing site at five minutes from a cheaper plan.
Pricing model
UptimeRobot bills a flat plan tier determined by monitor count and check interval, then meters login seats and alert credits separately. Solo runs $13 per month, or $12 annually, and Team runs $46 per month, or $39 annually, with Scale at $98 and $83. Because the primary dimension is monitor count rather than data volume, the bill does not move when traffic spikes, which is the opposite of every telemetry-priced tool here and the reason small teams find it predictable. The dimensions that do grow are headcount and alert volume, so a large on-call rotation is the scenario where the model works against you. There are no ingestion charges, no retention tiers to price, and no add-on catalog, which makes forecasting a one-line calculation once you know your monitor count and seat count.
The verdict
Pick UptimeRobot if the honest audit of your Better Stack usage comes back as "checks and a status page," and you are willing to run paging through PagerDuty or accept contact-based alerting. Skip it if you need on-call rotations in the same tool, or if the telemetry side of Better Stack was doing real work for you, because there is nothing here to replace it with.
Which tool fits your situation
If you left because of trace-level debugging limits and have budget: Datadog. The depth is real, and nothing else here matches Continuous Profiler and Dynamic Instrumentation. Go in with a volume plan and a custom-metrics audit.
If your team is already Prometheus-shaped: Grafana Cloud. Your alert rules and PromQL knowledge transfer, the free tier lets you evaluate properly, and IRM covers paging. Accept that you will need a separate status page and that cardinality is now your main cost lever.
If you want OTel-native telemetry with per-signal pricing and no seat tax: Dash0, paired with incident.io or PagerDuty for paging. One query language across signals and portable Perses dashboards are the draw. Check the 30-day span and log retention against your requirements first.
If your environment includes on-prem servers and network gear: Site24x7. It is the only tool here that treats SNMP and network devices as first-class, and entry pricing is the lowest. Budget for StatusIQ separately.
If your incidents are application bugs rather than infrastructure failures: Sentry, with a dedicated uptime tool alongside it. Unlimited seats and error debugging that outclasses every platform here, for less than most of them charge for one host.
If you need data residency or want to own the stack: OneUptime. It maps to Better Stack's feature shape more closely than anything else and the license is permissive. Be honest about whether you have the operational capacity.
If the honest audit says checks and a status page: UptimeRobot. Fifty free monitors, status pages included rather than billed per page, and a bill that does not move when traffic does. Route paging through PagerDuty and count your login seats before you commit.
If none of these feel like an upgrade: consider staying. Better Stack's published rates are competitive for the core product, unlimited phone alerts per responder undercuts most pagers, and free telemetry access for non-responders is a model most vendors do not offer. Model your actual add-on usage before assuming a migration saves money.
Final thoughts
The tools above sort into three approaches. Broad commercial platforms like Datadog, Grafana Cloud, and Site24x7 cover most of Better Stack's footprint and trade cost predictability for coverage, each in a different way: Datadog on infrastructure topology, Grafana Cloud on cardinality, Site24x7 on monitor licenses and add-on packs. Dash0 and Sentry go deep on one half and expect you to buy paging separately. OneUptime offers the whole shape in exchange for operating it yourself. UptimeRobot goes the other direction entirely, covering the checks and status page slice at a price the platforms cannot approach, and leaving everything else to you.
None of them answers the question you have to answer first: which half was doing the work? Teams that answer that honestly usually find their spend was concentrated in one half and their frustration in the other. The migrations that go badly are the ones where a team replaces the half that was cheap and keeps paying for the half that was expensive.
Dash0 sits in the telemetry half deliberately. If your reason for leaving is that OTLP data got translated into somebody else's schema, that debugging across signals meant learning several query languages, or that your bill grew on dimensions unrelated to how much telemetry you sent, those are the specific problems an OTel-native platform with per-signal pricing addresses. If your reason for leaving is that you need better paging and a nicer status page, be upfront that Dash0 is not that product and pair it with one that is.
Sign up for a free Dash0 account with 14 days of unlimited access.
Frequently asked questions
Can one tool replace everything Better Stack does?
Rarely. Better Stack bundles two distinct products: external monitoring with on-call and status pages, and a telemetry backend for logs, traces, metrics, errors, and session replay. Datadog, Site24x7, and OneUptime cover both halves, with trade-offs on cost model, on-call depth, and operational burden respectively. Grafana Cloud covers both but has no status pages. Dash0 and Sentry replace the telemetry half only, so pair either with a dedicated on-call tool. UptimeRobot replaces the checks and status page slice and nothing else. Work out which half your spend and your frustration sit in before shortlisting.
Is Better Stack actually expensive?
The core rates are competitive. Responder licenses are $34 per month, or $29 annually, team members who only need telemetry access are free, and unlimited phone alerts per responder undercuts most dedicated pagers. Cost grows on the add-ons: white-labeling or SSO-protecting a status page runs $250 per page per month, call routing is $250 per phone number, audit logs are $250, and Okta or Azure SSO is $5 per user. Ingestion in Singapore costs roughly three and a half times the European rate. Price your real configuration against the published rates rather than the headline number.
Does Better Stack support OpenTelemetry?
It ingests OTLP, so your instrumentation is portable and you can repoint a standard OpenTelemetry collector elsewhere without touching application code. Storage is a proprietary wide-event schema rather than the OTel data model, and monitors, dashboards, alert rules, VRL transforms, and status page configuration live in Better Stack's own format. Instrumentation travels; configuration does not.
Does Dash0 replace Better Stack's on-call and status pages?
No. Dash0 covers the telemetry half plus synthetic and website monitoring, and its alerting notifies through email, Slack, and webhooks and forwards to Alertmanager. There are no on-call rotations, no escalation policies, no phone or SMS paging, and no hosted status pages. Teams moving from Better Stack for telemetry reasons typically pair Dash0 with incident.io or PagerDuty.