
Everyone in observability knows the three main signals, the so-called “three pillars”: metrics, logs, and traces. This is a relic of time past, when it was literally how monitoring worked: three separate systems, each standing on its own.
It wasn’t unusual to collect your logs in Elasticsearch, traces in a dedicated APM tool (almost all of them commercial), and metrics in Graphite. But when an incident did hit, for example a sudden latency spike in a key service, you had to understand how these signals relate to each other. That usually meant opening three dashboards side by side, squinting at timestamps, and trying to connect the dots with your half-awake brain at 3 in the morning.
Thankfully, modern observability platforms are closing this gap by unifying signals in one place. But even when the data lives together, true correlation is still rare and that’s the missing piece we wanted to fix.
At Dash0, we made “Everything is connected” one of our core product principles, and it appeared also as the first item of our “OpenTelemetry-native” manifesto.
From Logs to Traces to Metrics – and back
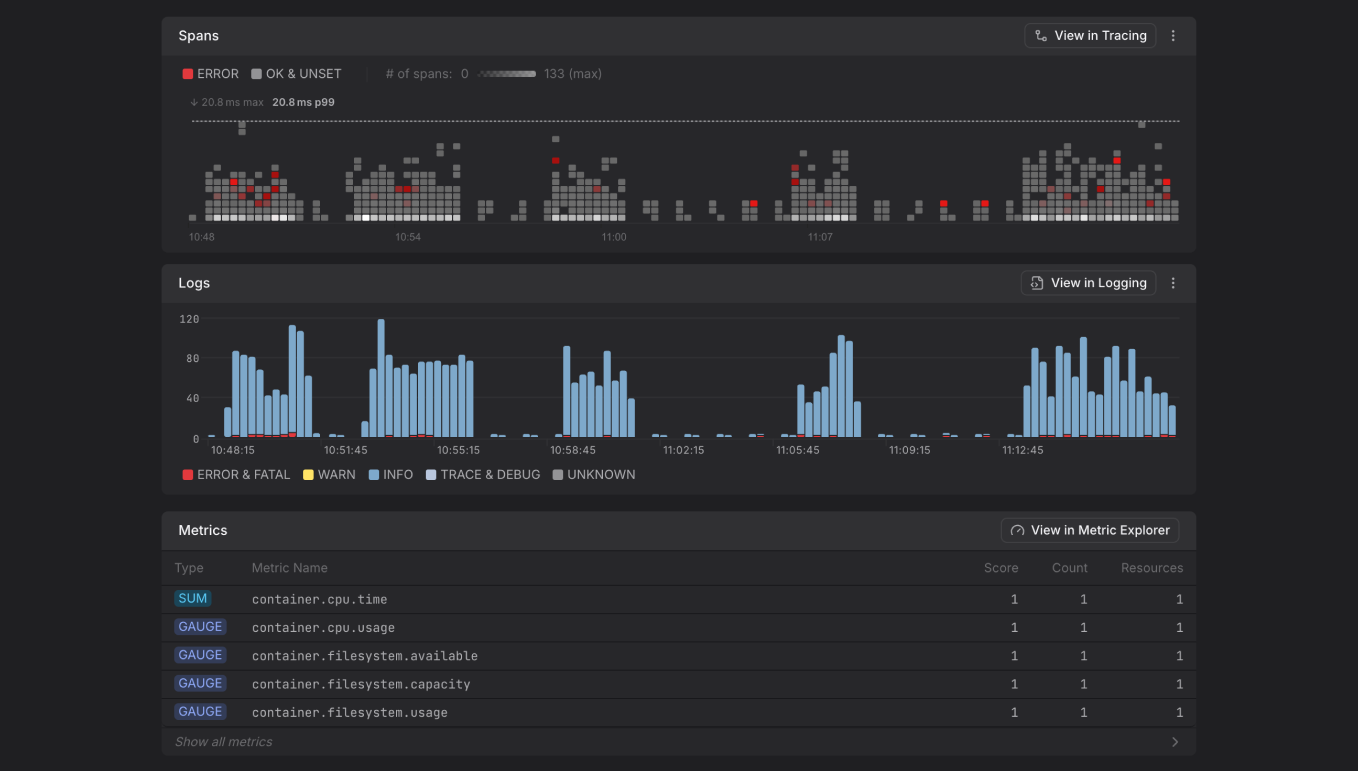
In the Dash0 UI, you can instantly see how the three signals relate. If a service starts producing erroneous API calls, you’ll immediately notice the corresponding changes on the tracing outlier map, in log volume, severity, and related metrics.

When an alert fires, a single click reveals correlated traces, logs, metrics (even web events when available) within the alert’s timeframe. The result: dramatically shorter time to root cause.

This principle that “Everything is connected” is woven throughout the product:
- Hover over any service to see how many logs, spans, and metrics it generated in the selected window, and jump into any of them with one click.
- View a distributed trace with correlated logs and open each log’s details inline, and very soon you will be able to pivot to all related logs within a ±5 min window.
- Jump from a synthetic check or web event directly to its corresponding distributed trace.
And many more use-cases like these.


The best part? Nearly no extra configuration required. Once your telemetry flows in, it just… works.
Three types of correlation
Behind the simple user experience lies a lot of work under the hood. To make seamless correlation possible, Dash0 continuously analyzes and upgrades incoming telemetry so that signals follow a consistent structure and naming scheme. This enhanced consistency is a major reason why correlations across logs, metrics, and traces work so reliably across three key dimensions:
- Time: When a log entry and a trace event occur within the same window (say a few milliseconds or seconds apart) that temporal proximity is our first clue that they’re related. Dash0’s time-based correlation engine continuously aligns timestamps across signals, so you always see data in a consistent timeline.
- Space: It’s not just when things happen, but in which part of your system. Each log line, span, or metric belongs to a specific resource. Dash0 uses OpenTelemetry attributes such as
service.name,host.name, or Kubernetes metadata to tie signals back to their source. While traces, logs and metrics already include rich resource attributes, they seldom agree with one another. For example, it is very seldom that, on Kubernetes, logs haveservice.nameannotated on them, while trace data will almost always do. To bridge that gap, we automatically enrich logs with contextual metadata, making it possible to connect them to the same resource as traces and metrics. - Trace context: The most powerful correlation happens through trace context propagation, the distributed tracing
trace_idandspan_ididentifiers that connect events across resources. Dash0 reads the trace context from your telemetry and uses them as the backbone for linking logs, spans, and metrics that share the same request path. This means when you open a span in Dash0, you can instantly explore all related logs and metrics from that request even across microservices. It’s how we ensure that following a single trace feels like following a story, not jumping between data silos.
Together, these three dimensions form the core of Dash0’s correlations. By relying on time, space, and trace context, Dash0 brings structure and meaning to your telemetry.
One step further
Good observability isn’t about more data, it’s about the invisible threads that connect it. And there’s always room to go deeper. We’re taking the “Everything is connected” principle a step further with Agent0, our agentic observability woven into Dash0.

Agent0 scans across logs, traces, and metrics to uncover correlations automatically. Then it summarizes its findings in a concise, human-readable format.
But it’s not a black box. Agent0 behaves more like a power user of the platform than a hidden engine. Every conclusion it presents is accompanied by the exact steps it took, shown through the same interactive UI components you already use elsewhere in Dash0. You can open the spans it inspected, look at the logs it filtered, compare the metrics it correlated, and retrace the sequence of pivots it followed.
It is not replacing your workflow but accelerating it and showing you the path. And since all of this happens inside the Dash0 UI, every transition from the thread to a specific signal is seamless. Because, after all: in the Dash0 UI everything is connected.

