Dash0 acquires Polar Signals

Monitor Keycloak authentication traffic, error rates, latency, and resource usage with OpenTelemetry in Dash0.
Keycloak is a widely used open-source identity and access management server, providing single sign-on, authentication, and authorization for web applications and services. Because most other services depend on it to authenticate their users, Keycloak's own availability and latency have an outsized impact on everything behind it.
Keycloak exposes Prometheus-format metrics through its management interface, includes a native OpenTelemetry tracer, and can emit structured JSON logs, so the Dash0 integration can collect all three signals using only the OpenTelemetry Collector.
Keycloak monitoring dashboard covering request rate, errors, latency, database connections, and JVM resource usage
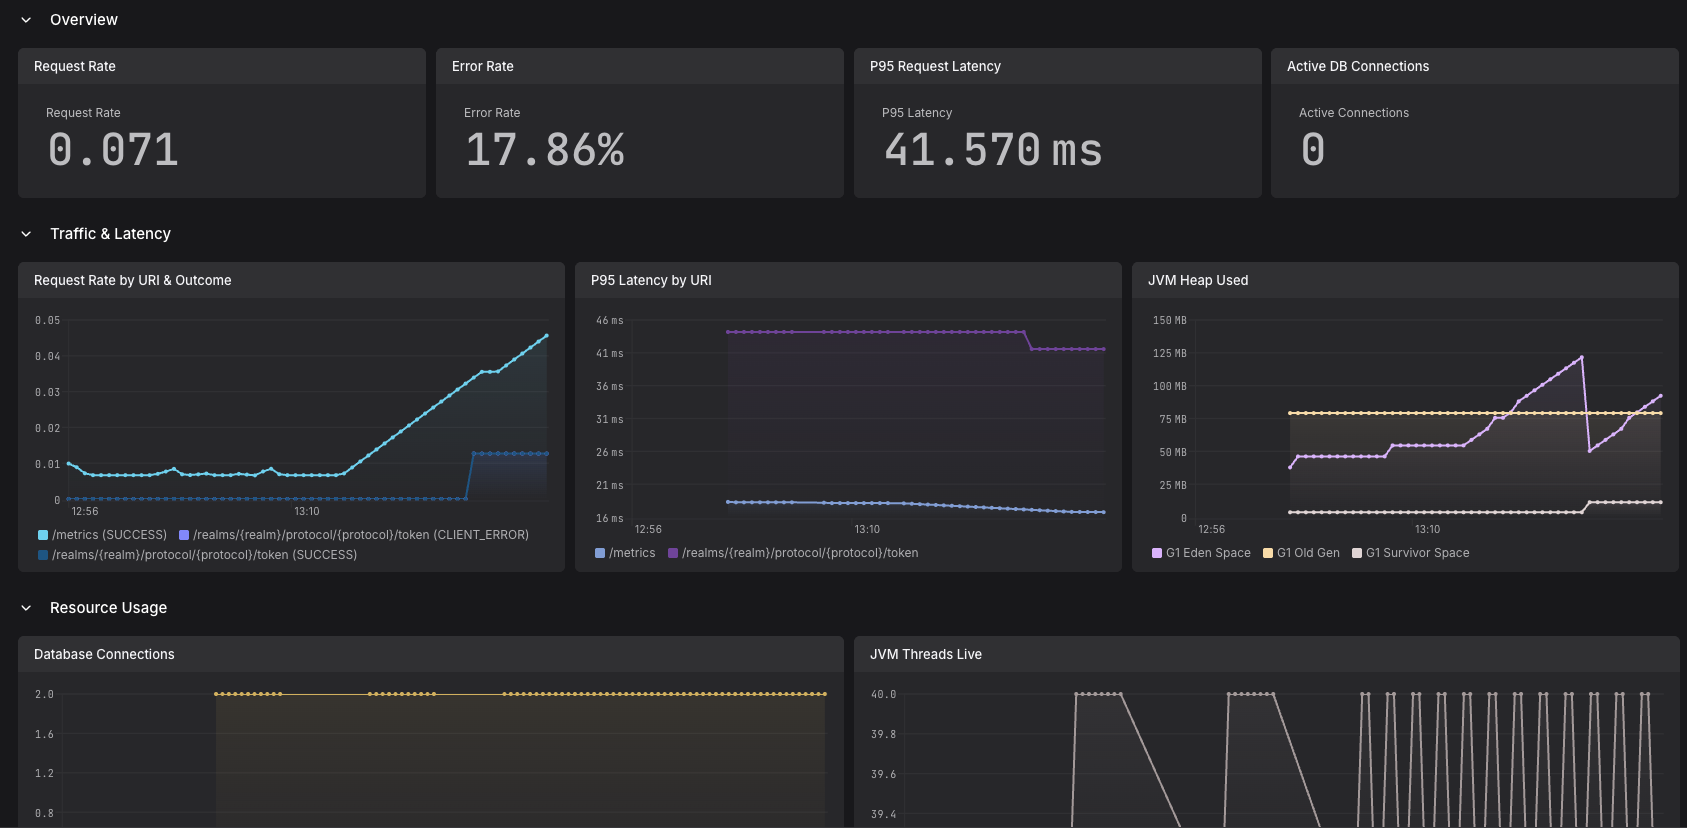
Keycloak collects Prometheus-format metrics through its management interface, supports structured JSON logging, and includes a native OpenTelemetry tracer. This guide configures an OpenTelemetry Collector to scrape and receive Keycloak's telemetry and forward it to Dash0.
For metrics and logs, Keycloak currently offers two paths: a mature, stable path used in this guide by default, and a newer path that exports directly over OTLP. Keycloak's own documentation marks the OTLP metrics exporter as experimental and the OTLP logs exporter as preview, both "not recommended for production" as of Keycloak 26. Both paths are documented below so you can pick either, but the stable path is the default recommendation.
Before setting up Keycloak monitoring, ensure:
9000 by default) is reachable from the
collector.You'll need an OpenTelemetry Collector deployed. Consider using:
Helm Chart for The OpenTelemetry Collector
Enable the stable Prometheus metrics endpoint:
This exposes OpenMetrics-format metrics at /metrics on the management interface (port 9000 by default).
Experimental alternative: Keycloak can instead export metrics directly over OTLP using a Micrometer-to-OpenTelemetry bridge. Keycloak's own documentation currently marks this as experimental and not recommended for production:
If you use this path, skip the prometheus receiver below and add an otlp receiver instead (the same one used
for traces and, optionally, logs).
Enable Keycloak's native OpenTelemetry tracer:
By default, Keycloak samples all traces (tracing-sampler-ratio=1.0). Lower this for production traffic volumes.
Enable structured JSON console logging:
Preview alternative: Keycloak can instead export logs directly over OTLP. Keycloak's own documentation currently marks this as a preview feature that is not fully supported:
Don't enable both the file-based and OTLP log paths at once, since Keycloak's structured log lines (including its
org.keycloak.events audit logger, which records login attempts) will otherwise be collected twice.
Configure the collector to scrape Keycloak's stable metrics endpoint and receive traces (and logs, if you use the OTLP log path) over OTLP:
If you're using the stable, file-based logging path instead of the OTLP logs exporter, collect Keycloak's JSON log
file with a filelog receiver:
Keycloak includes traceId and spanId in each log record's MDC when tracing is enabled, so logs and traces
correlate automatically once both are flowing into Dash0.
http_server_, agroal_, or jvm_.LOGIN_ERROR audit
events arrive.POST /realms/{realm}/protocol/{protocol}/token (and similar routes)
appear for authentication requests.