Synthetic monitoring sends scripted, automated requests against your APIs and websites at regular intervals, from one or more locations, so you find out about an outage or a slow endpoint from a probe instead of from a customer. The requests aren't real user traffic; they're synthetic, hence the name. A scheduler fires the request, the response gets checked against assertions you define (status code, response time, body content), and a failure triggers an alert before anyone outside your team notices.
This article covers how synthetic monitoring works, what it's good for, where it falls short, and how it fits alongside the rest of your observability stack.
How synthetic monitoring works
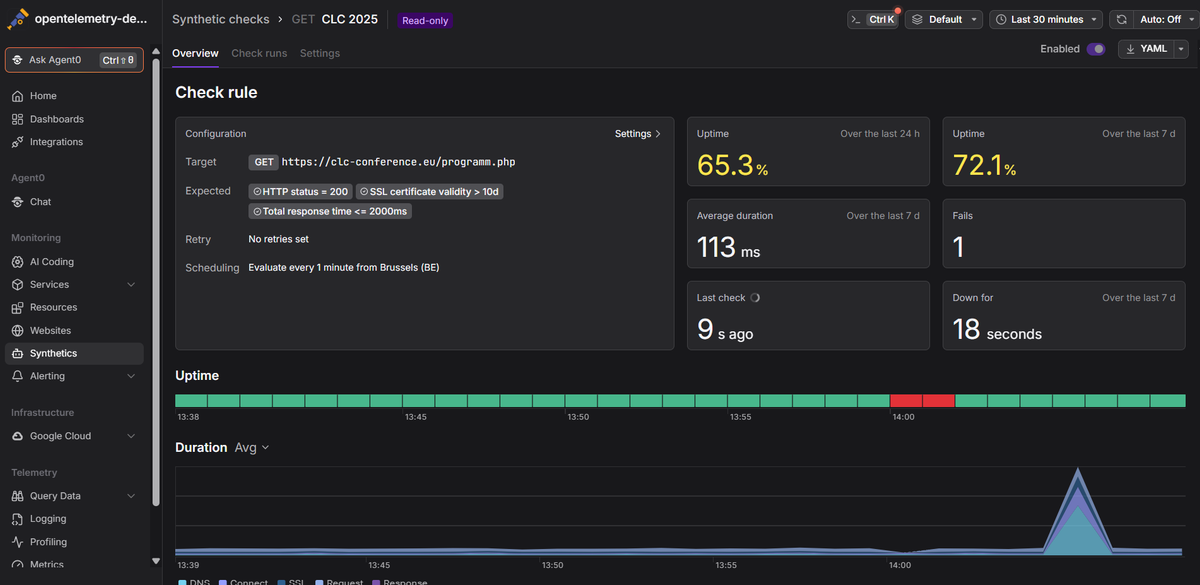
A synthetic check has three moving parts: a request definition, a schedule, and a set of assertions.
The request definition describes what to send: an HTTP method, a URL, headers, query parameters, and optionally a body and authentication. This can be as simple as a GET against your homepage or as involved as a multistep flow that logs in, fetches a token, and calls an authenticated endpoint with it.
The schedule controls how often the check runs and from where. Running every minute from a single region catches an outage fast but tells you nothing about whether the problem is global or local. Running from six regions every five minutes costs more but tells you whether your CDN is having a bad day in Singapore while everything looks fine from Virginia. Most tools let you choose between running from every configured location on every interval, or round-robining through them to spread out the load.
The assertions are what turn a response into a pass or fail. A status code of 200 is the obvious one, but you'll also want assertions on response time (mark it degraded above 300ms, failed above 1500ms, for example) and sometimes on response body content, to catch the case where the server returns 200 with an error page.
When a check fails, retries matter more than people expect. A single dropped packet shouldn't page anyone. Configuring a retry count and interval before a failure counts as real means transient network blips get absorbed instead of generating 3am alerts for nothing.
What it's used for
The most common use is uptime and availability: is the endpoint reachable, and is it responding in a reasonable time. Right behind that is SSL certificate monitoring, since an expired cert is a predictable, calendar-driven outage that's embarrassing to get caught by. Beyond those two, synthetic checks are useful for verifying that a critical business transaction (login, checkout, search) still works end to end, especially right after a deploy, and for testing in environments that don't have real traffic yet, like a staging cluster or a feature not released to users.
Because the checks run on a fixed schedule regardless of whether real users are active, synthetic monitoring is also how you get coverage during low-traffic windows: 3am on a Sunday, a regional holiday, an internal tool only a handful of people touch. Real user monitoring (RUM) has nothing to measure if nobody's using the page.
Synthetic monitoring vs. real user monitoring
These two get compared constantly because they answer different questions. Synthetic monitoring tells you "is this endpoint up and fast, right now, from this location," using traffic you generate yourself on a schedule. RUM tells you "how is this actually performing for the people using it," using telemetry collected from real sessions, typically by instrumenting the frontend itself.
The practical difference shows up in coverage and visibility. Synthetic checks exercise exactly the paths you scripted, nothing more, but they run continuously and predictably, including for endpoints or regions with no real traffic at all. RUM sees everything real users touch, including the long tail of browsers, devices, and network conditions you'd never think to script, but it only sees what users are actually doing right now, and it can't tell you about an outage during a quiet period.
Most teams end up running both: synthetics for the always-on canary that catches regressions before launch and during traffic lulls, RUM for understanding what production load actually looks like once people are hitting it.
Common pitfalls
Synthetic failures get triaged in a silo, separate from everything else. A check fails, someone opens the synthetic monitoring dashboard, sees a 500 and a duration spike, and then has to correlate that by hand against application traces, logs, and infrastructure metrics in a different tool. That correlation step is where most of the time in an incident actually goes. It doesn't have to be that way: if your synthetic checks generate OpenTelemetry traces and metrics that flow into the same backend as your application telemetry, the failed check is already linked to the exact downstream spans it triggered. You go from "the checkout API failed" to "the checkout API failed because the payment service's database call hit a 2-second timeout" without leaving the trace view.
Synthetic traffic pollutes your real-user metrics. If your checks aren't tagged distinctly from production traffic, a burst of synthetic requests during a deploy can show up as a spike in your request-rate dashboards, or a synthetic check hitting a broken staging dependency can trigger an alert meant for real users. Make sure your platform can filter or exclude synthetic-origin spans and metrics, particularly when you're investigating an actual outage and don't want your own monitoring traffic adding noise to the signal.
A response time threshold that's too generous hides real degradation. Teams often set the "failed" threshold high enough to avoid noisy alerts, then never revisit it. A check that only fails above 5 seconds won't catch the slow creep from 200ms to 2 seconds, and your users will notice long before your alerting does. Set a separate, tighter "degraded" threshold alongside the hard failure one, and treat degraded as a trend to watch rather than something to ignore until it crosses into failure.
Setting up your first checks
Start with the handful of things that would actually wake someone up if they broke: your main API endpoints, your login flow, anything customer-facing where downtime shows up as lost revenue or support tickets. Add SSL certificate checks for any domain you control. There's no excuse for getting caught by one of those; the expiration date is known months in advance. Resist the urge to script every possible user path on day one. A small set of checks on critical paths, running reliably with sane thresholds, beats a large set of checks nobody trusts because half of them are flaky.
Once the basics are running, route failures through the same alerting channels you already use, so a failed check shows up in Slack or PagerDuty next to everything else rather than in a tool people forget to check.
A check that just tells you something broke isn't worth much on its own. The useful version hands you a trace straight into whatever broke downstream, so you're not the one digging for it. Dash0's synthetic monitoring runs HTTP checks from multiple global locations and correlates every check down to the individual span, at any depth, in the traces it generates, so a failed login check and the database timeout that caused it show up in the same place. Combined with logs and metrics from the rest of your stack, you go from alert to root cause without switching tools.
 Start a free trial to add your first synthetic check in under a minute. No credit card required.