Most outages don't live in one place. A user can't check out because a payment service times out, because a downstream database is thrashing, because a Kubernetes node ran out of memory during a deployment. If your logs, metrics, and traces are stored in separate tools owned by separate teams, you spend the first thirty minutes of an incident figuring out whose problem it is before you can actually fix anything.
Full stack observability means collecting telemetry from every layer of your system and correlating it in one place. The goal is that when something breaks, you can trace it from symptom to root cause yourself, without handing off to another team or digging through another tool.
What "full stack" actually means
The term covers every layer a user request passes through.
At the front is the user experience layer: what the browser or mobile client observes. Page load times, JavaScript errors, Core Web Vitals. Real user monitoring data tells you what users actually experience, not what your backend thinks it's delivering, and those two things can diverge in surprising ways.
Below that is the application layer, where distributed traces live. A single e-commerce checkout might touch an API gateway, an order service, an inventory service, a payment processor, and a notification service. Traces map the full path so you can see exactly where latency builds or errors propagate.
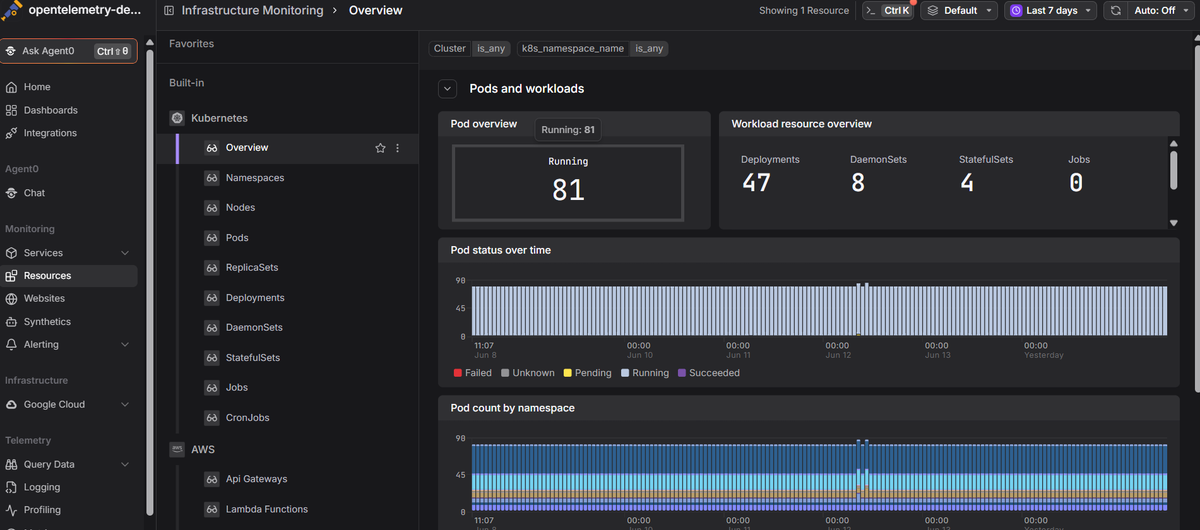
Under that is the infrastructure layer: the Kubernetes nodes, databases, message queues, and cloud services all those applications run on. CPU throttling, memory pressure, slow disk I/O all produce symptoms that look like application bugs until you see them with context.
These layers aren't independent. Isolating them in separate tools reintroduces the exact blind spots you're trying to fix.
How it differs from monitoring
Monitoring tells you what broke. Full stack observability tells you why.
Traditional monitoring watches predefined metrics (CPU above 80%, error rate above 1%, latency above 500ms) and fires alerts when thresholds are crossed. That works for failure modes you anticipated. When a checkout latency spike comes from an unindexed query triggered by a new code path, no threshold catches it.
Observability changes the model. Instead of configuring alerts for every possible failure in advance, you collect rich telemetry with enough context to investigate after something goes wrong. You can ask questions you didn't think to write alerts for: which user segment sees this error? Which service version introduced the regression? Did this start at the same time as the 14:21 deploy?
Full stack observability adds scope. Single-service observability is useful. Cross-layer correlation is what gets you from "we see high latency in the payment service" to "the Postgres replica the payment service reads from has a locking issue triggered by a background migration that started at 14:03.
The signals involved
A full stack observability platform connects three core signal types, and the value is almost entirely in the connections rather than the individual signals.
Metrics are time-series measurements: request rates, error counts, latency percentiles, resource utilization. Cheap to store, fast to query, good for dashboards and alerting. A P99 spike is a useful starting point. It tells you something is wrong but not what or why.
Logs are timestamped records of discrete events: which query a service ran, what parameters it received, what error it hit. High-fidelity, expensive at scale, and useless for debugging unless they carry enough context to connect them to the request they belong to.
Traces are where things get interesting. They map the end-to-end journey of a single request through a distributed system. Each service adds a span recording how long it took and what it did. When logs and metrics are linked to traces via shared trace IDs, you can pivot from a slow trace directly to the relevant log lines and infrastructure metrics without any manual searching. OpenTelemetry defines a standard for emitting all three signals with consistent context, which is what makes automatic correlation possible.
Some platforms also include profiling (CPU and memory flamegraphs across the fleet), web events, and synthetic monitoring. The thread connecting all of it is shared context, so correlation is structural rather than something you reconstruct on your own.
Why correlation is the hard part
Collecting signals is easy. The tools for it are mature and cheap. Making them useful together is where most setups fall short.
When a service emits a trace and a log entry for the same request but those two records don't share a common identifier, they're functionally unrelated. You can't pivot from a slow trace to the log that explains why it was slow. You end up grepping through time windows and hoping the timestamps align, which works when you have twenty minutes and it's not a revenue-impacting incident.
Telemetry without shared context is just data. OpenTelemetry solves this at the instrumentation level: every signal carries trace context, so a metric, a log, and a span belonging to the same request can be joined by trace ID. That's the foundation—a data model that makes correlation possible before the data even reaches your backend.
What this looks like in practice
Your metrics dashboard shows a P99 latency spike for the orders service at 14:23. With metrics alone, you know something is wrong. With full stack observability:
- You drill down from the spike into the slowest traces in that window.
- One trace shows the
ordersservice making 47 sequential calls to the inventory service instead of one batched call. - You pivot from that trace to the log entries for that request. A newly deployed version of the order handler introduced an N+1 query bug.
- You check the deployment timeline. A deploy went out at 14:21.
That same investigation in a siloed setup takes two or three team escalations and an hour of log-grepping. During a revenue-impacting outage, that's often the difference between a P1 resolved in 15 minutes and one that drags through a war room.
What to look for in a platform
Not all platforms that call themselves "full stack" actually deliver correlated telemetry. Worth checking:
OpenTelemetry-native vs. OTel-compatible. These aren't the same thing. "Compatible" often means the platform accepts OTLP at the door, then normalizes your data into a proprietary model that strips cardinality and context. If your instrumentation is OTel but your backend is proprietary, you get the portability on the way in and none of it when you need to query.
Whether signal correlation is actually one click. If you're copying timestamps between tabs, the signals aren't really correlated. They're just stored in the same product. Drilling from a trace to a log to an infrastructure metric should take one click.
High-cardinality filtering. Debugging distributed systems often means filtering on user ID, tenant, deployment version, or other dimensions you didn't declare in advance. Platforms that pre-aggregate or aggressively sample make some of these queries impossible after the fact.
Pricing. Per-gigabyte and per-log-line pricing creates a perverse incentive: you strip context to control costs, and then you're missing exactly what you need during an incident. Per-data-point pricing keeps costs predictable without forcing you to choose between cost and debuggability.
Feature lists explain what an observability platform is designed to support, but practitioner discussions can provide additional context on how different tools perform in day-to-day use. For perspectives on OpenTelemetry support, deployment models, cost, and operational trade-offs, explore these observability tools discussions on Reddit.
Final thoughts
Getting to full stack observability is mostly about making sure your signals share context, which means OpenTelemetry instrumentation and a backend that preserves that context rather than discarding it. Most teams running siloed tools aren't far from this; they're just missing the common context model that makes everything joinable.
Dash0 is an OTel-native observability platform with unified logs, metrics, and distributed traces. Per-data-point pricing means you don't have to choose between cost and context.
 Start a free trial. No credit card required.