
Availability monitoring is the practice of continuously verifying that a system is reachable and doing its job, then recording every moment it isn't. The recording part is what makes it more than a red/green light: those records are what let you say "we were up 99.94% last month" instead of guessing.
The word that trips people up is "available." A server can respond to a ping while the application on it returns 500s to every request. That gap between reachable and actually working is where most availability monitoring quietly fails.
What "available" actually means
"Available" isn't one thing. It's a stack of increasingly strict conditions, and a check is only as good as the layer it tests.
- Reachable at the network layer. An ICMP (Internet Control Message Protocol) ping gets a reply. This tells you the host is powered on and the network path works. It tells you nothing about whether anything useful is running.
- Accepting connections. A TCP handshake on port 443 succeeds. The process is bound to the port and listening. Still no guarantee it does anything correct.
- Responding correctly at the application layer. An HTTP request returns
200with the body you expect. Now you know the app is handling requests, not just holding the socket open. - Completing a real transaction. A scripted login, search, or checkout runs end to end and returns the right result. This is the only layer that reflects what a user actually cares about.
Each layer up costs more to run and catches failures the layer below misses. A ping stays green through a database outage that makes every page throw an error. This is why "our monitoring said we were up" and "customers couldn't check out" are both true more often than anyone likes.
The practical rule: monitor the highest layer that matters for the thing you're protecting. For a marketing site, an HTTP 200 on the homepage is probably enough. For a payments API, you want a synthetic transaction that actually posts a test charge and confirms the response, because that's the failure that costs money.
Turning availability into a number
The point of recording outages is to compute availability as a percentage over a window. The formula is boring on purpose:
1Availability (%) = (Total time − Downtime) / Total time × 100
If a service was down for 7.3 hours in a 30-day month (720 hours total), that's (720 − 7.3) / 720 × 100 = 98.99%. Just under two nines.
The "nines" shorthand hides how brutal each additional nine is. Every nine you add cuts your allowed downtime by a factor of ten:
| Availability | Downtime per year | Downtime per month |
|---|---|---|
| 99% (two nines) | ~3.65 days | ~7.2 hours |
| 99.9% (three nines) | ~8.8 hours | ~43.8 minutes |
| 99.99% (four nines) | ~52.6 minutes | ~4.4 minutes |
| 99.999% (five nines) | ~5.3 minutes | ~26 seconds |
The jump from three to four nines is the one that changes how you operate. At 99.9%, a human can get paged, wake up, and fix a 20-minute outage without missing the monthly target. At 99.99%, your entire yearly budget is under an hour, which means detection and recovery have to be automatic. If you're promising four nines while running on a single region with a human in the loop, the arithmetic doesn't close.
This number is also the foundation of the SLI/SLO/SLA vocabulary. The measured availability is a service level indicator (SLI). The target you commit to internally is a service level objective (SLO). The number in a contract, with penalties attached, is a service level agreement (SLA). Availability monitoring is what produces the SLI; everything else is a decision about what to do with it. If those terms blur together, the SLA vs. SLO vs. SLI breakdown untangles them properly.
How you actually measure it
There are two vantage points, and they answer different questions.
Synthetic monitoring runs scripted checks against your endpoints on a schedule, from machines you control, whether or not any real users are around. This is the workhorse for availability, because it runs continuously and predictably even at 3am on a Sunday with zero live traffic. It's also how you catch problems that only show up from certain regions, since you can run the same check from Frankfurt, Oregon, and Melbourne and compare. The tradeoff is that a synthetic check only exercises exactly the path you scripted, and nothing else. If a whole walkthrough of the approach helps, that's covered separately.
Real user monitoring (RUM) measures availability and performance from actual user sessions, usually by instrumenting the frontend. It sees everything real users touch, including the long tail of browsers, networks, and edge cases you'd never think to script. But it only tells you about paths users actually took, so it goes blind during exactly the low-traffic windows when synthetic checks keep watching.
Most teams run both. Synthetic gives you a clean, always-on availability signal you can put in an SLA. RUM tells you whether that signal matches reality for the people paying you.
Common pitfalls
The health check that returns 200 while broken
A /health endpoint that returns 200 as long as the process is running is worse than useless, because it turns green while the service is broken. If it doesn't touch the database connection and the downstream dependencies the real request path needs, your monitoring reports full availability straight through an outage. Make the health check exercise the same dependencies a real request does, or check a real endpoint instead.
Measuring from inside your own network
A probe running in the same virtual private cloud (VPC) as your service skips the load balancer, DNS resolution, TLS negotiation, and the public internet path, which is where a lot of outages actually live. Availability that only holds from inside your datacenter is not the availability your users get. Measure from outside, in the regions your users are in.
A single probe location
One check location can't tell a real outage apart from a routing problem between that one probe and your service, and a transient blip from it will page someone for nothing. Run from several locations and require agreement before declaring an outage, then add a retry policy so a single dropped packet stays quiet.
Averages that hide short outages
A monthly figure of 99.95% can bury a hundred 15-second blips that each dropped in-flight requests and annoyed real users. A rolled-up percentage is a compliance number, not a debugging tool. Keep the raw outage timeline underneath it so you can see the pattern, not just the total.
Watching the wrong layer
This is the first pitfall again in a different costume. If you monitor a ping and the thing that fails is application logic, a green dashboard means nothing. Match the check to the failure you're actually afraid of.
Final thoughts
Availability monitoring comes down to three decisions: which layer you check (reachable versus actually working), how you turn outages into a percentage over a window, and where you measure from. Get those right and the uptime number you report is one you can defend.
The number itself is only the start of an incident. The moment a check goes red you need to know why, which dependency broke and what the traces and logs around it show. That's why availability checks are most useful sitting next to the rest of your telemetry instead of in a standalone uptime tool.
Dash0 is an OpenTelemetry-native observability platform, so its synthetic monitoring runs availability and SSL checks from multiple regions and links every check run to backend distributed traces, right alongside your logs and infrastructure metrics in one place.
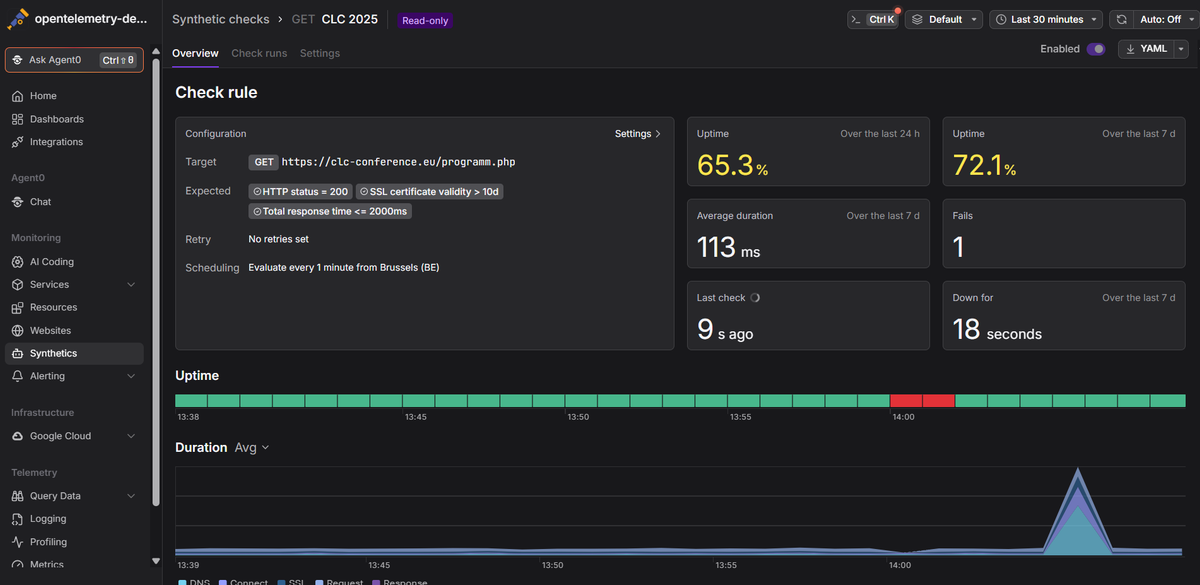 Start a free trial to monitor uptime and trace failures back to root cause from a single view. No credit card required.