Last updated: March 3, 2026
View Log Details
Dash0 provides quick access to relevant information based on context.
The detail panel on the right-hand side opens when a record in the log table is selected, such as the below.
![]()
The detail panel contains information distributed across several tabs.
Overview Tab
The overview tab is active by default and contains the most relevant information for quick access and navigation.
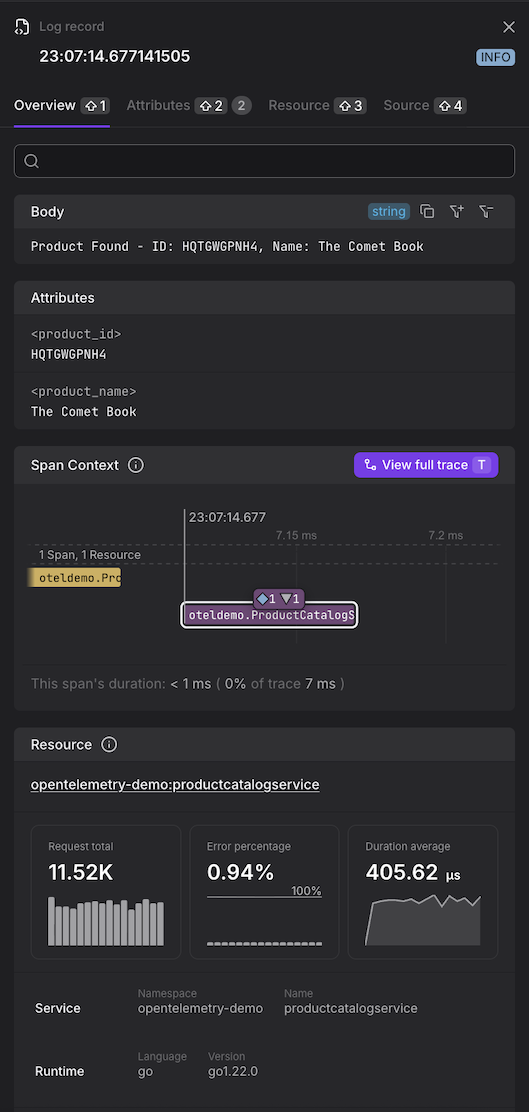
- Body - The log message content
- Log Attributes - For a list of all attributes, open the Attributes tab
- Span Context - This shows the relevant part of the distributed trace and, specifically, the span (highlighted) in which context the log record was created. The trace is limited to the span before and after the highlighted span. Summaries about the other spans of the trace are shown, indicating how many spans from how many resources are not visible in the overview.
- Resource - For a list of all details about the resource, open the resource tab
- RED Metrics - Request, Error, and Duration metrics
- Attributes - Full list of log attributes
Source Tab
The source tab contains the raw data of the log record, including all fields and attributes.
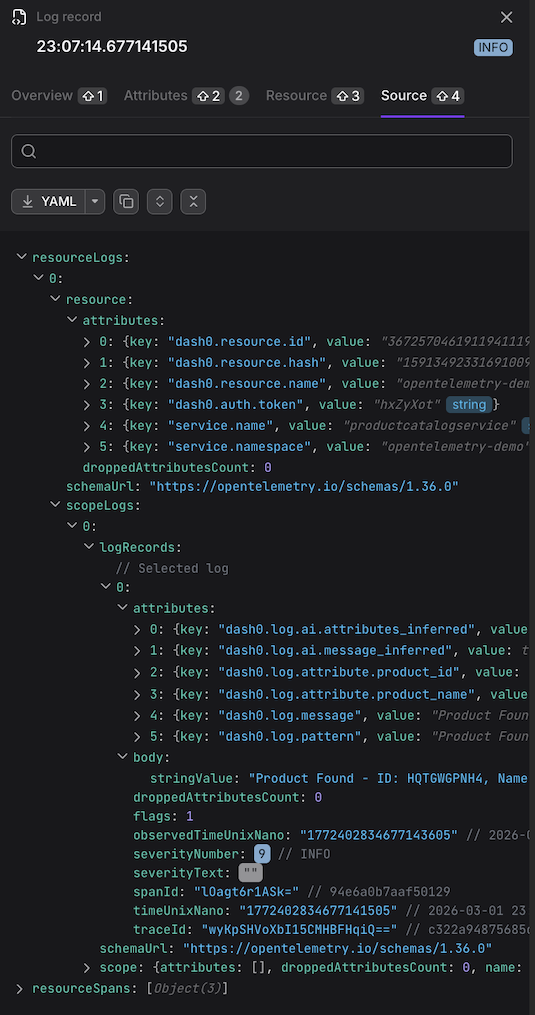
Tip
The Source tab shows the log record as OTLP JSON. This is how Dash0 represents the log internally — it does not mean the log was received via OTLP or that it was originally encoded as JSON.