- 17 min read
7 Best Mezmo Alternatives in 2026
Mezmo combines centralized log analysis with an Active Telemetry Pipeline that can profile, transform, sample, and route logs, metrics, and traces before they reach a destination. It fits platform and SRE teams that want a managed way to reduce telemetry noise, enrich data in flight, and search operational logs without building their own pipeline stack. Mezmo is particularly strong when log investigation and pre-ingest data control need to live in one product.
Teams usually compare Mezmo alternatives for one of two reasons. Some want broader application, infrastructure, and user-experience monitoring around their logs. Others need a deeper, independently deployable routing layer, more deployment control, a different query model, or pricing that maps more cleanly to their workload. That distinction matters: replacing Mezmo Log Analysis is a different decision from replacing Mezmo Telemetry Pipeline, and only a few products cover both jobs well.
Quick picks
| Tool | Best fit |
|---|---|
| Cribl Stream | Large teams that need a dedicated, destination-neutral telemetry routing and reduction layer |
| Grafana Cloud | Grafana and Prometheus users who want managed Loki logs with an open-source ecosystem |
| Dash0 | OpenTelemetry-first teams that want logs, metrics, and traces in one managed investigation workflow |
| Elastic Observability | Search-heavy teams that need flexible schemas, deployment choices, and deep log analytics |
| New Relic | Teams that want full-stack observability with a relatively simple ingest-based billing model |
| Coralogix | High-volume environments that want policy-based data tiers and full-stack observability |
| Better Stack | Small and midsize teams that prioritize fast SQL log search, uptime, and on-call workflows |
What to look for in a Mezmo alternative
-
Replacement scope: Decide whether you are replacing log storage and search, the in-flight telemetry pipeline, or both. A log backend is not automatically a vendor-neutral router, and a router does not provide an investigation UI.
-
Collection and portability: Check support for your existing agents, OpenTelemetry Collector, Fluent Bit, syslog, and cloud-native sources. Portable instrumentation lowers migration cost, but dashboards, alerts, queries, processors, and retention policies can still create switching costs.
-
Processing point: Compare transformations at the edge, in your infrastructure, and after vendor ingest. Processing before billable ingestion can reduce downstream cost and limit sensitive-data exposure.
-
Investigation workflow: Test live tail, parsing, search language, saved views, alerts, and navigation from logs to related traces or infrastructure. Query familiarity often matters more during an incident than the length of an integration list.
-
Deployment and data control: Validate SaaS regions, self-managed or hybrid options, private connectivity, encryption, redaction, and archive ownership against residency and compliance requirements.
-
Billing dimensions: Model ingest, indexed or retained data, query scanning, hosts, seats, active series, pipeline workers, and add-ons. Products with a low ingest rate can still be unpredictable when several independent meters apply. For a deeper framework on evaluating these tradeoffs, see what makes a good OpenTelemetry backend.
1. Cribl Stream
Best for: Large organizations replacing Mezmo Telemetry Pipeline while retaining existing analytics destinations.
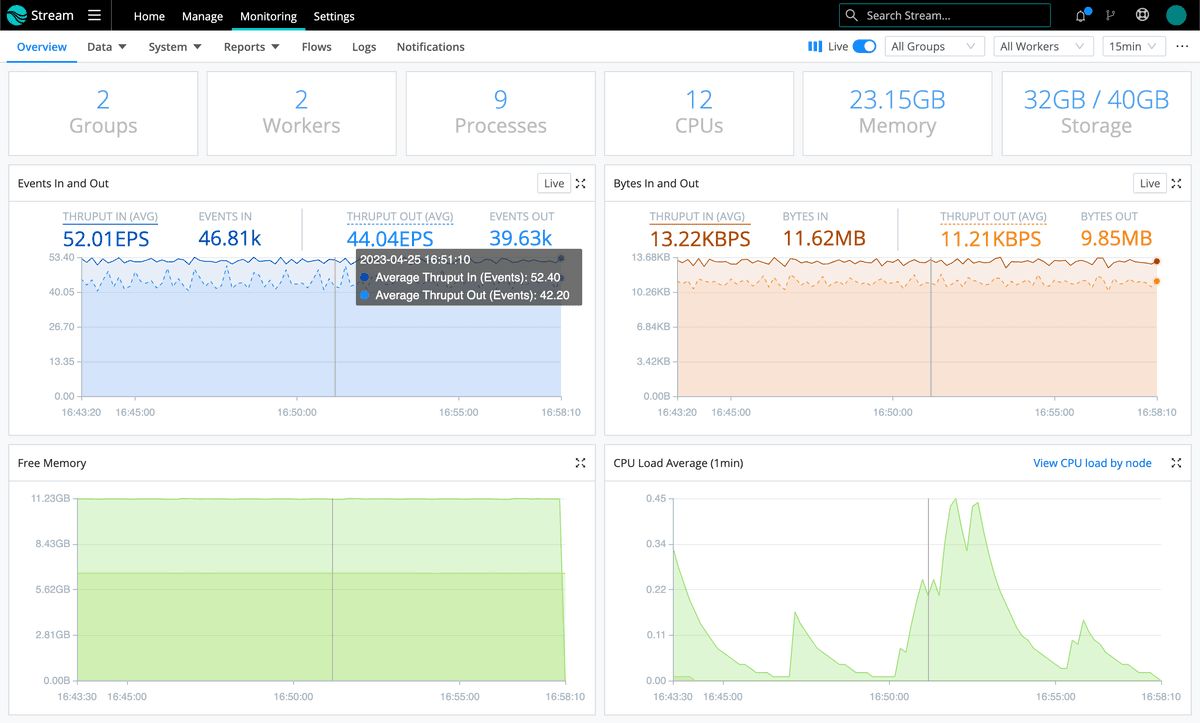
Cribl Stream is a dedicated telemetry processing and routing layer, not a direct replacement for Mezmo Log Analysis. It collects data from sources, applies functions through pipelines, and uses routes to send events to one or more destinations. This separation is the point: teams can reduce, redact, enrich, replay, or fan out data without making the pipeline subordinate to a single observability backend.
Cribl belongs near the top of the shortlist when routing depth and destination independence matter more than an integrated log-search experience. It can support a multi-vendor architecture or a staged Mezmo migration, but you still need Cribl Search, Cribl Lake, or another backend for storage and investigation. Cribl Stream pricing meters cloud ingest and worker infrastructure; hybrid workers use a different rate, and egress is not billed. Public pricing and a free tier are available, but worker sizing introduces an infrastructure dimension beyond raw volume.
Worth exploring if: you need a neutral control plane for high-volume telemetry and expect to keep multiple downstream systems.
Give it a pass if: you want a single, lightweight replacement that includes log storage, search, dashboards, and alerting out of the box.
2. Grafana Cloud
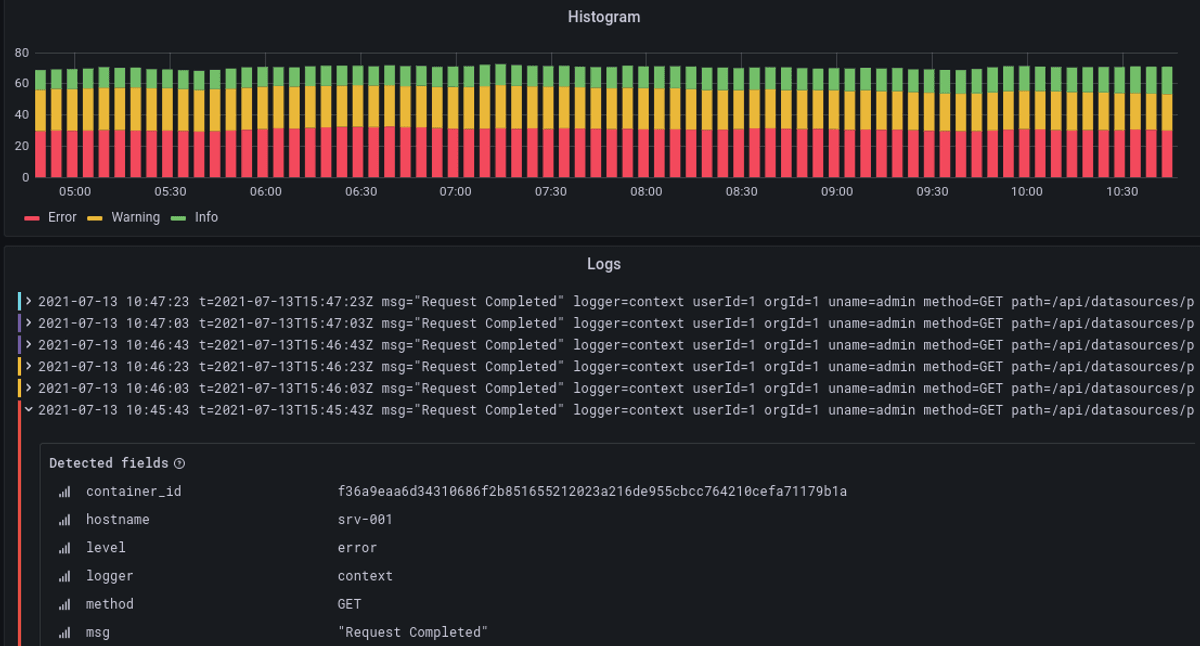
Best for: Teams already fluent in Grafana, Prometheus, and Loki that want managed cloud operations.
Grafana Cloud Logs is a managed log aggregation service powered by Loki. It is attractive when your team already uses Grafana dashboards and Prometheus-style alerting, or when you want logs, metrics, traces, and profiles backed by the Grafana ecosystem. Loki indexes labels rather than the full log body, which can control index growth but makes label design and LogQL proficiency important.
Grafana Cloud removes the work of operating Loki yourself while preserving a path to the open-source components. That flexibility is genuine, but it is not a single uniform data model: PromQL, LogQL, TraceQL, and backend-specific concepts remain part of daily operations. Pricing is public, with a free tier; paid usage spans log ingest and retention plus separate meters for other signals and platform features. Spend is reasonably modelable per signal, though a full-stack rollout requires tracking several units.
Worth exploring if: your engineers already work comfortably across Grafana’s dashboards and signal-specific query languages.
Give it a pass if: you want one query and resource model across every telemetry signal or a pipeline product centered on arbitrary destination routing.
3. Dash0
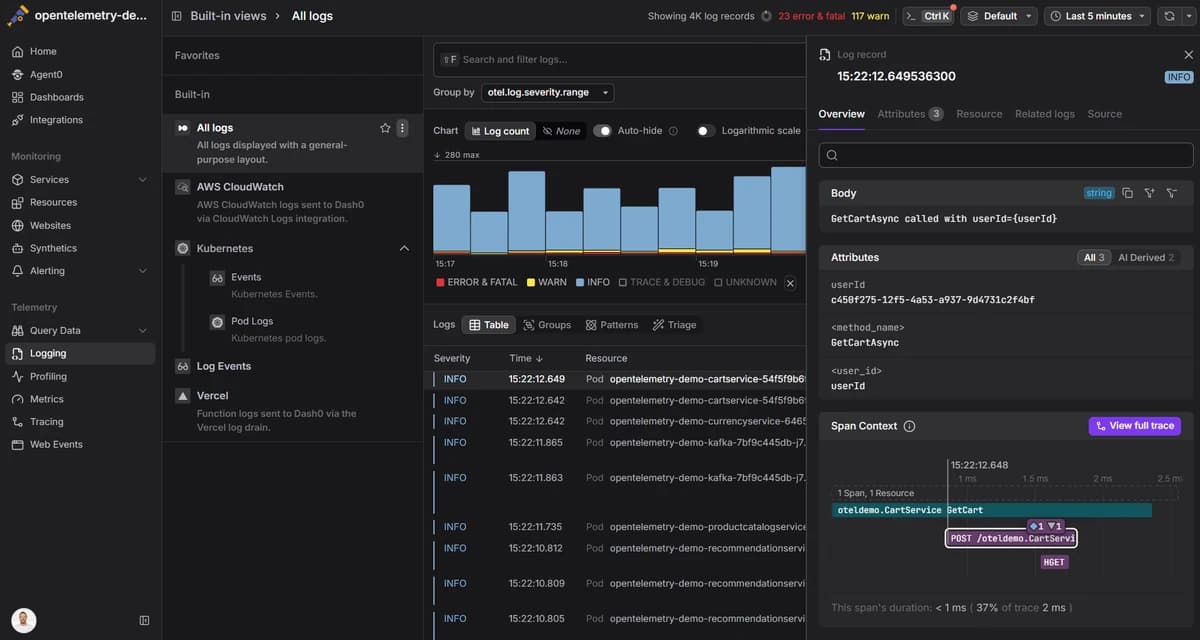
Best for: OpenTelemetry-first cloud-native teams replacing log silos with correlated logs, metrics, and traces.
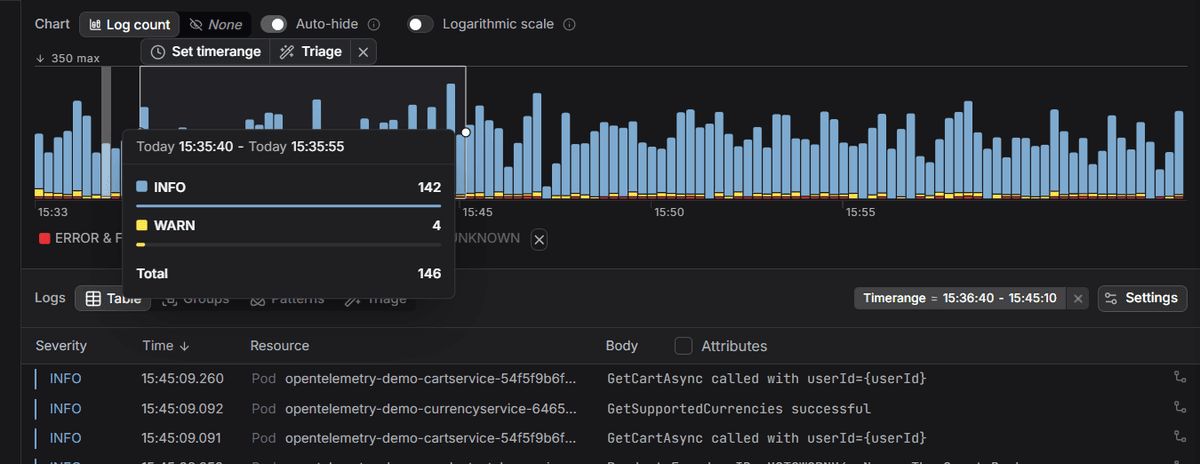
Dash0 is a managed, OpenTelemetry-native observability platform. Logs arrive as OpenTelemetry log records and retain resource and trace context, so engineers can move between log events, spans, metrics, and infrastructure without rebuilding correlation around a proprietary agent. This reduces instrumentation and transport lock-in, although saved views, alerts, investigation workflows, and retention configuration remain migration work.
Dash0 is a stronger replacement for Mezmo Log Analysis than for Mezmo’s destination-neutral pipeline. SignalControl provides ingestion filtering and governance, but teams with elaborate multi-destination routing should keep an OpenTelemetry Collector layer or shortlist Cribl. Dash0 pricing splits into two meters rather than bytes, hosts, or seats: an Ingest charge on every log record, span, and metric data point you send, and an Index charge, priced by volume tier, only on what you choose to retain. This is more predictable than host- or seat-based billing, but teams should model both meters, since filtering or sampling reduces what you index, not what you're charged for ingest. Public pricing and a free trial are available.
Worth exploring if: standardized OTel context and a unified investigation model are higher priorities than a huge legacy integration catalog.
Give it a pass if: you require self-hosting, security analytics, or a standalone router with extensive non-OTLP source and destination coverage.
4. Elastic Observability
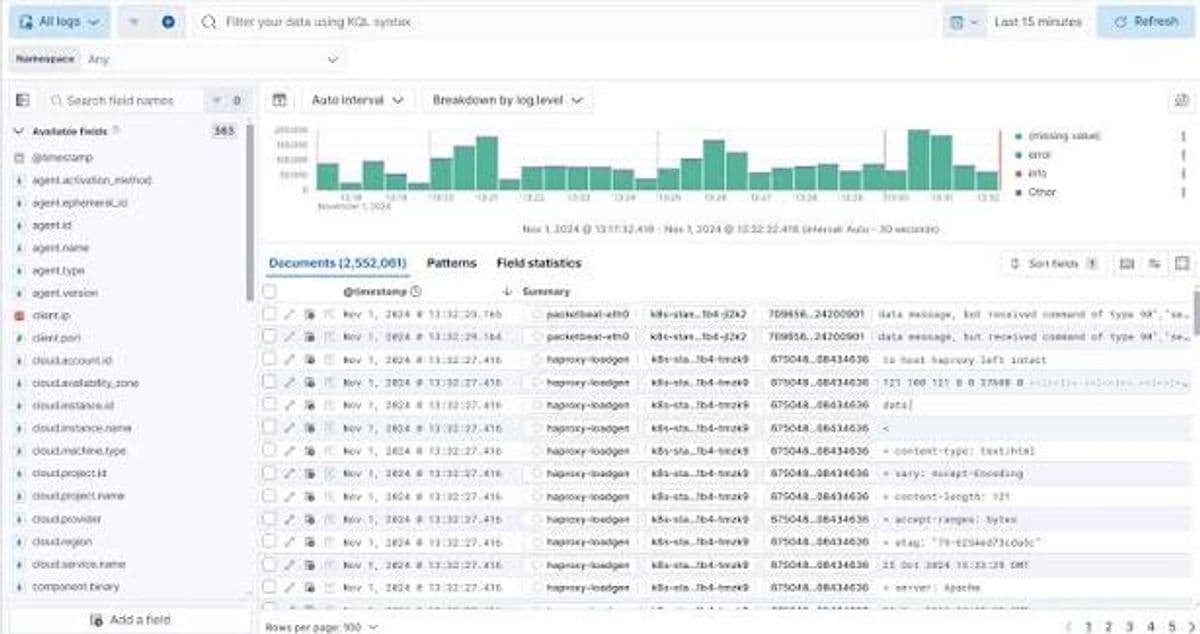
Best for: Search-centric teams that need flexible log analytics and a choice of managed, serverless, or self-managed deployment.
Elastic Observability combines logs, metrics, traces, user-experience data, and infrastructure signals on Elasticsearch. It is the strongest option here when log search, schema flexibility, and the ability to run the stack yourself are central requirements. ES|QL, KQL, and Elasticsearch’s analytics give experienced teams considerable control, while Elastic Cloud removes much of the cluster work.
That flexibility creates more architectural choice than Mezmo, but also more decisions around mappings, data streams, lifecycle policies, storage tiers, shards, and upgrades when self-managed. Elastic Cloud Serverless offers a Logs Essentials tier and meters ingest, retained data, and egress; Elastic Cloud Hosted prices provisioned resources instead. Public pricing and trials are available, but cost predictability depends on choosing the right deployment model and retention design.
Worth exploring if: sophisticated search and deployment control justify deeper platform ownership.
Give it a pass if: your team wants a highly opinionated service with minimal schema, capacity, and lifecycle tuning.
5. New Relic
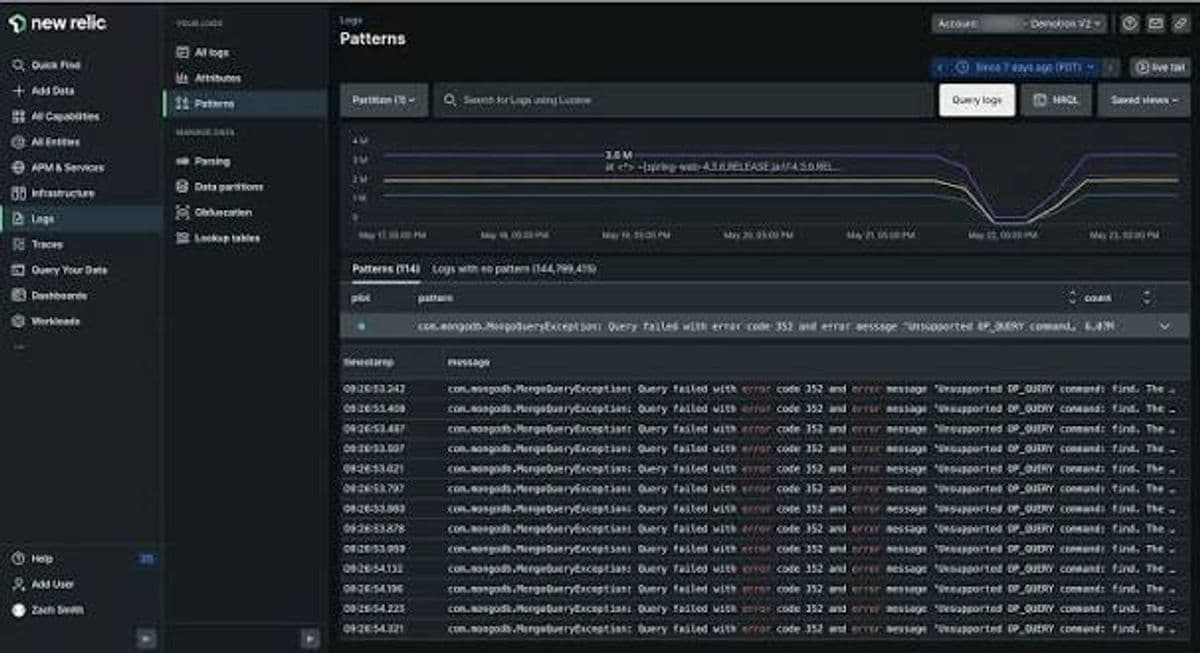
Best for: Application teams that want logs correlated with APM and infrastructure under ingest-based pricing.
New Relic Log Management brings logs into the same platform as application traces, metrics, errors, and infrastructure data. It fits teams moving beyond Mezmo’s log-centric workflow that want developers to investigate a service through a shared telemetry graph and NRQL rather than operate a separate logging product.
The billing model is easier to explain than a host-plus-product matrix: New Relic measures the volume of telemetry data ingested, while user entitlements and advanced capabilities can add commercial dimensions. Its pricing documentation describes included ingest and a free edition. Pre-ingest drop rules can reduce unwanted logs, but New Relic is an observability destination rather than a destination-neutral pipeline comparable to Mezmo or Cribl. Moving away later also means migrating NRQL queries, dashboards, alerts, and workflows.
Worth exploring if: application-centric investigation and a common ingest meter matter more than independent telemetry routing.
Give it a pass if: the primary requirement is to process and fan out data to several third-party destinations before any observability vendor bills for it.
6. Coralogix
Best for: High-volume teams that want full-stack observability with policy-based log value tiers.
Coralogix combines logs, metrics, traces, security data, and application monitoring, with routing policies that assign data to different pipelines according to how frequently it must be searched. This makes it a credible alternative for teams using Mezmo to control log cost as well as investigate production issues.
The distinctive feature is economic rather than cosmetic. Data assigned to frequent search, monitoring, compliance, or blocked pipelines consumes different amounts of a common unit, so teams can reserve expensive searchability for operationally valuable events. Coralogix publishes its unit and volume model, offers trial access, and does not add host or query meters to standard telemetry pricing. Forecasting still depends on classifying data correctly; poor routing policies can place too much volume in the highest-cost tier. The platform is managed, so it is less suitable for teams that require a self-hosted analytics plane.
Worth exploring if: telemetry value varies widely and your team will actively govern which logs need frequent search.
Give it a pass if: tiering policies would add unwanted operational process or self-managed deployment is non-negotiable.
7. Better Stack
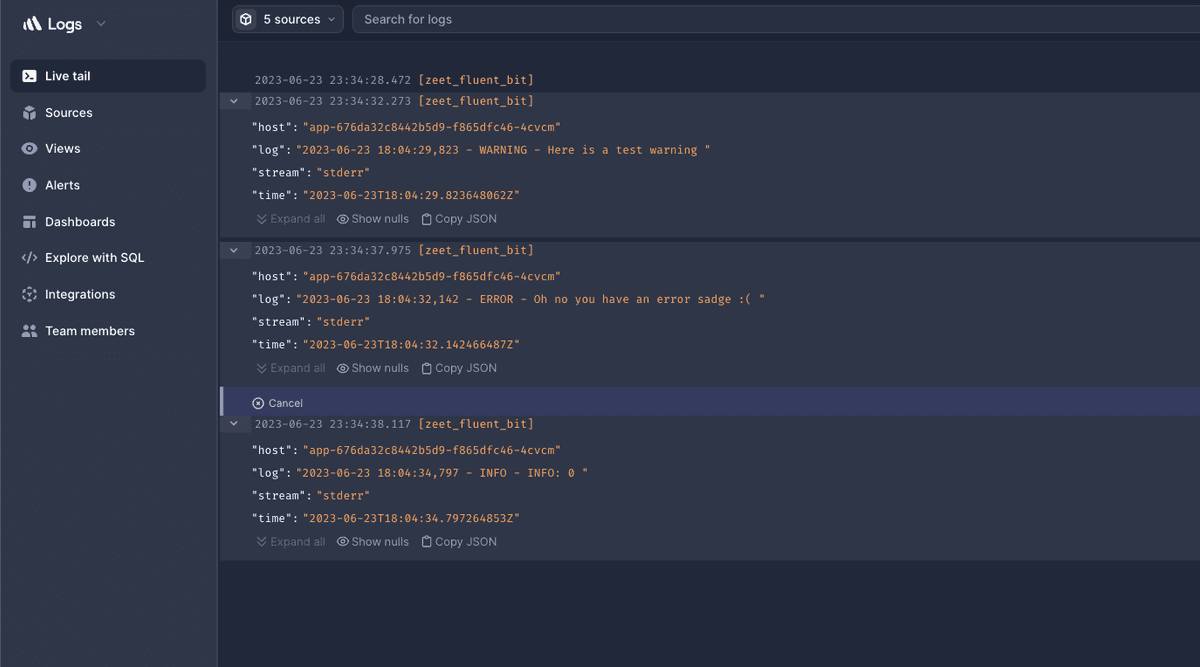
Best for: Small and midsize teams that want straightforward logs, uptime monitoring, and on-call coordination.
Better Stack is the pragmatic logging alternative on this list. It centralizes logs and traces, provides live tail, and supports SQL-based querying, dashboards, and alerts. Its broader suite connects logging with uptime checks, incidents, and status pages without expanding into a sprawling enterprise-wide product surface.
The collector can apply Vector Remap Language transformations before forwarding data, including redacting fields and dropping events that should not be billed. Better Stack pricing separates ingestion, retention, and optional query acceleration, with public rates and a free allowance. That model is legible for smaller environments, although scanned-data charges for boosted queries and premium connectivity or deployment options need to be included in larger forecasts. Better Stack is primarily a managed destination; it is not the strongest choice for complex multi-destination pipeline governance.
Worth exploring if: fast onboarding and an integrated developer operations workflow matter more than maximum enterprise breadth.
Give it a pass if: you need deep security analytics, extensive telemetry fan-out, or fine-grained enterprise platform controls across a very large estate.
Comparison table
| Tool | Best fit | Main strength | Main tradeoff | Pricing model | Deployment |
|---|---|---|---|---|---|
| Cribl Stream | Independent telemetry routing | Deep processing and multi-destination control | Needs a separate analysis backend | Ingest plus worker infrastructure | Cloud, hybrid, or self-managed workers |
| Grafana Cloud | Grafana ecosystem users | Managed Loki with open-source lineage | Multiple query languages and signal meters | Per-signal usage plus platform features | SaaS; OSS components can be self-managed separately |
| Dash0 | OTel-first cloud-native teams | Native OTLP context across signals | SaaS-only; narrower routing and security scope | Ingest (flat, per record/data point) plus Index (tiered by retained volume) | SaaS |
| Elastic Observability | Search and deployment control | Flexible analytics and deployment options | More design and operational choices | Serverless data volume or hosted resources | SaaS, serverless, or self-managed |
| New Relic | Application-centric full stack | Shared context with relatively simple ingest billing | Not a neutral routing layer | Data ingest plus user and capability tiers | SaaS |
| Coralogix | High-volume value tiering | Policy-based search and retention economics | Requires disciplined classification | Volume translated into pipeline-specific units | SaaS |
| Better Stack | Smaller developer teams | Fast SQL search plus incident workflows | Less enterprise and routing depth | Ingest, retention, and optional query acceleration | SaaS |
Final thoughts
The best Mezmo alternative depends first on which Mezmo you are replacing. Cribl is the clearest specialist when the telemetry pipeline is the product you care about, while Grafana Cloud is the most natural landing place for teams already committed to its open-source ecosystem. Dash0 is the most direct choice for teams that want OpenTelemetry context to define the investigation model, and Elastic offers the most deployment and search control. New Relic, Coralogix, and Better Stack provide increasingly opinionated managed paths.
Before switching, replay representative production traffic through a proof of concept and validate parsing accuracy, attribute preservation, redaction, fan-out, live-tail latency, query ergonomics, alert migration, and failure behavior under backpressure. Price the same workload through normal weeks and incident spikes, including retention, cold retrieval, query scanning, pipeline compute, seats, and add-ons. If OTLP-native correlation and per-record pricing fit that model, the Dash0 free trial is a practical way to test the migration with real telemetry. No credit-card required.