

AWS Lambda removes servers from your deployment workflow, but it doesn't remove the distributed systems problems that make production incidents difficult to investigate. A request may pass through API Gateway, a Lambda function, an Amazon Simple Queue Service (SQS) queue, another function, and DynamoDB before anything visibly breaks.
The default Lambda metrics can tell you that invocations are failing, slowing down, or being throttled. They rarely explain which event caused the problem, where an asynchronous workflow lost context, or why a function disappeared after reaching its memory or timeout limit. Those gaps are why teams start looking for dedicated AWS Lambda monitoring tools.
Choosing one is harder than comparing dashboards. Each product collects a different combination of AWS metrics, application traces, logs, runtime telemetry, and event data. Some discover resources at the AWS account level, while others require a layer or agent on every function. Some preserve context through queues and topics, while others focus mainly on synchronous requests.
Their pricing models also respond differently as an application grows. Per-function pricing can penalize highly decomposed architectures, while per-gigabyte pricing makes verbose logs and rich telemetry more expensive. Consumption-based signal pricing may be easier to model, but it still requires you to understand how many spans, log records, and metric data points your functions produce.
This article compares six AWS Lambda observability tools using the questions that matter in production: installation, runtime support, asynchronous tracing, visibility into terminated invocations, sampling, security, pricing, and instrumentation portability.
What makes AWS Lambda monitoring hard
Lambda changes what you can observe and when you can observe it. You cannot log in to a persistent host, inspect a long-running process, or assume that telemetry will finish exporting after your handler returns. Execution environments appear, handle one or more invocations, freeze, and eventually disappear.
Termination is a particularly important blind spot. When a function times out or exceeds its memory allocation, the runtime may be killed before an instrumentation library can close its active span or export buffered telemetry. A regular trace can therefore end before the failure that you most need to understand.
Asynchronous services make the execution path harder to reconstruct. An event may be published to Amazon Simple Notification Service (SNS), delivered to SQS, retried several times, processed as part of a batch, and eventually sent to a dead-letter queue. A monitoring tool must preserve or reconstruct context across those boundaries without pretending that every delivery is one continuous synchronous request.
Batch processing creates another layer of ambiguity. One Lambda invocation can receive several SQS, Kinesis, or DynamoDB Streams records, and only part of the batch may fail. A tool that reports only the invocation-level error may not tell you which record failed, whether successful records were retried, or how the failure affected the wider event chain.
The monitoring code also runs inside the environment you are measuring. A Lambda layer, extension, wrapper, or language agent can add initialization work, memory consumption, network traffic, and deployment complexity. The effect depends on the runtime, package size, architecture, memory allocation, and enabled instrumentation.
At high invocation volumes, sampling becomes unavoidable for many teams. The important question is not simply whether a product supports sampling, but whether errors, unusual latency, and important business transactions remain available after the volume controls are enabled.
Payload capture can make debugging faster, but it can also transmit customer data, credentials, or regulated information to an observability backend. You need to know what is captured, where redaction occurs, how access is controlled, and whether masking rules cover more than a predictable set of field names.
We will evaluate each tool against these criteria:
- Setup complexity: Account-level discovery versus per-function instrumentation.
- Runtime support: Which Lambda runtimes receive automatic tracing.
- Asynchronous tracing: Propagation across queues, topics, streams, and event buses.
- Failed invocation visibility: Timeouts, out-of-memory failures, runtime crashes, and partial batches.
- Monitoring overhead: Deployment, initialization, memory, and export costs.
- Sampling: How traces are selected and what may be unavailable later.
- Security: Payload capture, redaction, permissions, and access controls.
- Cost model: The dimensions that cause the monitoring bill to grow.
- Portability: How much instrumentation and investigation work survives a backend change.
AWS Lambda monitoring tools at a glance
The table summarizes the main trade-offs. Runtime and feature support can change, so verify the linked documentation before starting a rollout.
| Tool | Setup | Automatic runtimes | Async tracing | Failed invocations | Cost model |
|---|---|---|---|---|---|
| CloudWatch, Application Signals, and X-Ray | Native AWS configuration with optional managed OTel layer | Varies by Application Signals and X-Ray support | Supported AWS paths, with gaps outside instrumented services | Metrics and logs show failures, but traces may be incomplete | Logs, metrics, traces, queries, alarms, and related AWS usage |
| Dash0 | AWS integration with automatic or manual Lambda instrumentation | Python, Node.js, and Java | Context for SQS, SNS, EventBridge, Kinesis, and DynamoDB Streams | Synthetic spans for timeouts and out-of-memory failures | Spans, metric data points, and log records |
| Datadog | AWS integration, runtime library, and Lambda Extension | Broad runtime support, with feature differences | Extensive AWS event-source integrations | Enhanced metrics for timeouts, OOM, memory, and cold starts | Active functions, invocations, and separately billed products |
| Dynatrace | AWS integration with Lambda monitoring layer or OTel | Python, Node.js, Java, Go, and .NET | Supported AWS services including SQS, SNS, and EventBridge | Runtime and platform analysis through Lambda monitoring | Platform consumption and data ingestion units |
| New Relic | AWS account integration with agent layer and extension | Node.js, Python, Go, Java, Ruby, and .NET | Supported tracing, with manual propagation in some paths | Agent telemetry, metrics, logs, and Lambda event analysis | Contract plan, ingestion, users, and related usage |
| Sentry | AWS integration or language SDK setup | Automatic AWS setup for Node.js and Python | Strongest inside instrumented application paths | Detailed exceptions, but narrower infrastructure analysis | Errors, spans, logs, and team features by plan |
1. Amazon CloudWatch, Application Signals, and AWS X-Ray
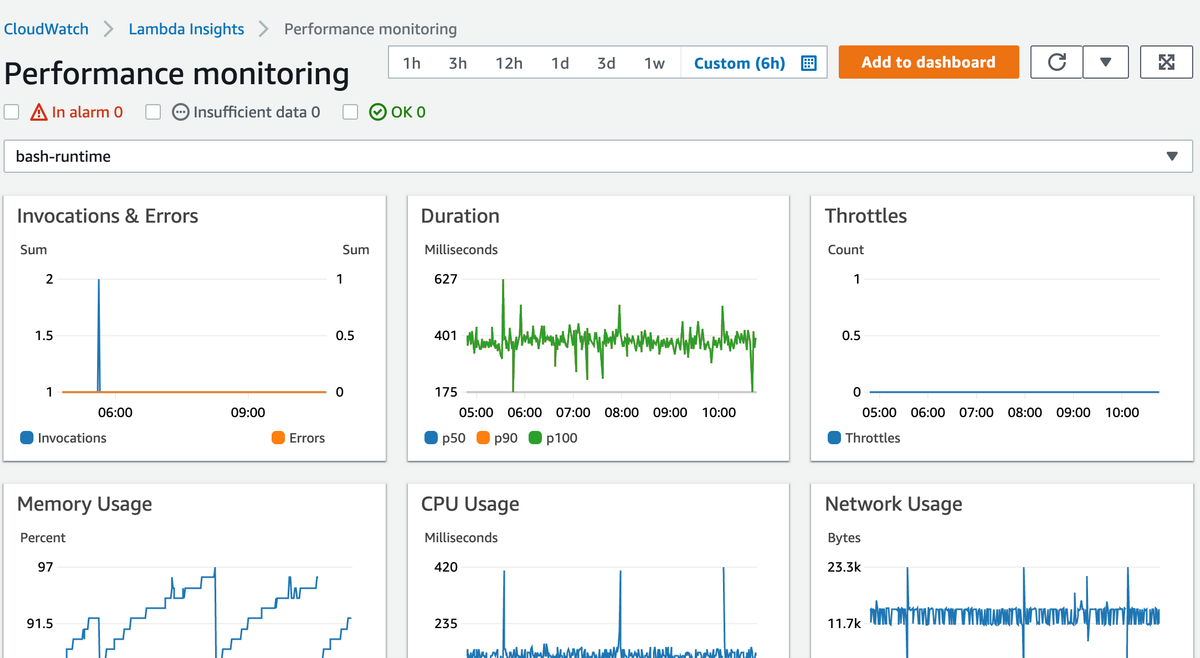
Every Lambda deployment already has a relationship with Amazon CloudWatch. Lambda publishes standard invocation metrics to CloudWatch, while function output can be sent to CloudWatch Logs. AWS X-Ray adds trace summaries and service maps, and CloudWatch Application Signals provides curated application performance views.
Application Signals can automatically instrument supported Lambda functions through an AWS-managed OpenTelemetry layer. AWS lets you enable Application Signals and X-Ray from the Lambda or CloudWatch console, which makes this stack the natural baseline for an AWS-only environment.
What's good
-
The baseline is already present in every Lambda account: Lambda publishes invocation count, duration, errors, throttles, concurrency, and other standard metrics to CloudWatch without requiring an agent or third-party account. This makes the AWS stack the fastest way to establish basic alerts and operational dashboards.
-
Application Signals reduces manual setup for supported runtimes: AWS can apply its managed OpenTelemetry layer and create service-level views for latency, faults, and dependencies. You can enable it through AWS tooling rather than maintaining a separate vendor integration.
-
X-Ray understands supported AWS service relationships: It can connect Lambda invocations with services such as API Gateway and other instrumented AWS components. This is useful when most of the application remains within AWS and the supported trace path matches your architecture.
-
AWS governance applies throughout the stack: CloudWatch and X-Ray use AWS Identity and Access Management (IAM), AWS Regions, resource policies, and existing account boundaries. Teams with strict AWS governance do not need to introduce another identity or data access system.
The catch
CloudWatch, Application Signals, Logs Insights, and X-Ray remain separate products with different interfaces, query models, configuration paths, and billing units. Following one incident can require moving between metric charts, log groups, service views, and trace details while manually preserving the same time range and resource context.
X-Ray traces can end before the failure that matters. A Lambda timeout or out-of-memory termination may be visible in platform metrics and runtime logs without producing a complete application span, leaving you to reconstruct the failed invocation from separate AWS signals.
Application Signals also has narrower runtime and instrumentation support than the underlying CloudWatch metrics. Functions outside its supported path still require AWS Distro for OpenTelemetry, an X-Ray SDK, or manual instrumentation, so the experience can differ across a mixed-runtime Lambda estate.
Pricing model
AWS prices CloudWatch across several dimensions, including log ingestion and storage, custom metrics, dashboards, alarms, API requests, queries, Application Signals, and X-Ray traces.
Standard Lambda metrics do not introduce an additional custom metric charge, but custom metrics, alarms, log ingestion, queries, and trace usage can all increase the bill. A function that emits verbose logs can cost considerably more to monitor than one that produces the same number of invocations with smaller records.
The fragmented model gives you control over which AWS services you enable, but it also makes forecasting harder. You need to estimate log volume, retention, query frequency, custom metrics, alarms, trace sampling, and Application Signals usage rather than relying on a single Lambda monitoring unit.
The verdict
Start with the AWS-native stack when your application is small, AWS-only, and primarily needs health metrics, alarms, logs, and occasional traces. It is also a reasonable choice when AWS-native governance matters more than a unified investigation experience.
Look beyond it when incidents routinely cross asynchronous services, other clouds, Kubernetes, or non-AWS applications, or when engineers spend too much time manually correlating CloudWatch and X-Ray data.
2. Dash0
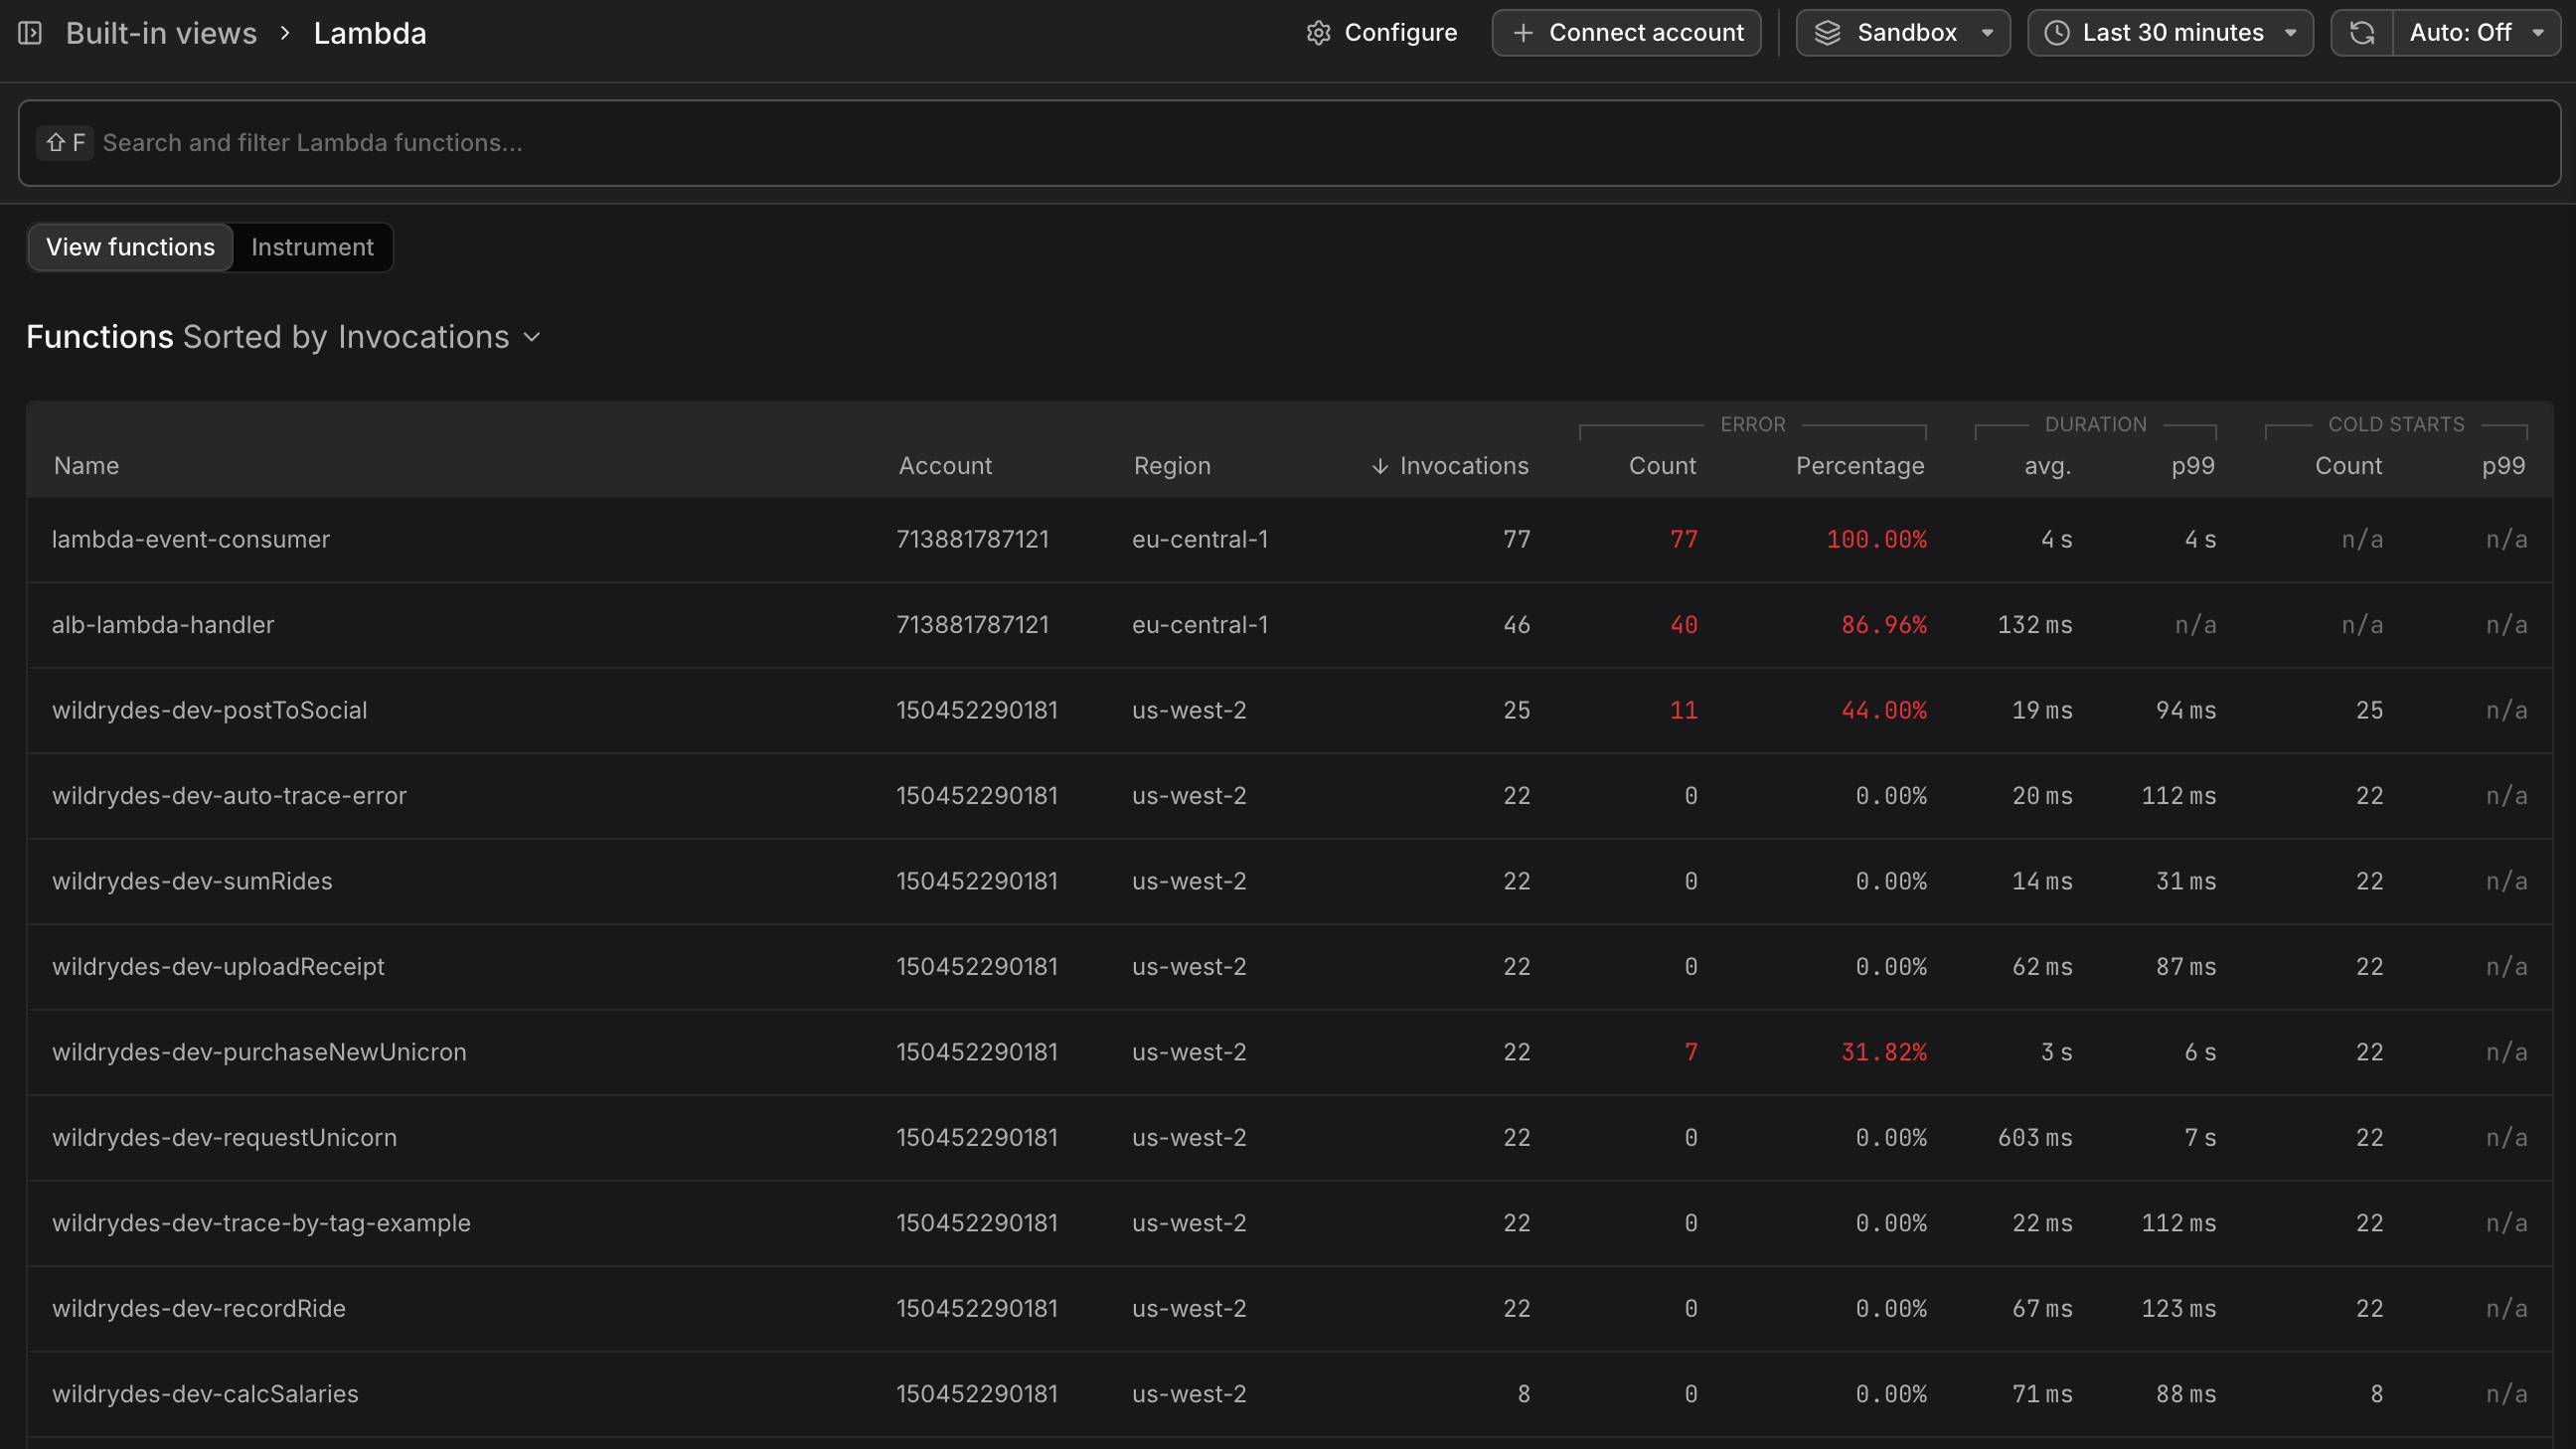
Dash0 provides an OpenTelemetry-native path for collecting Lambda traces, logs, and metrics. Its Lambda Extension runs as a Lambda layer and sidecar process, with automatic instrumentation for supported Python, Node.js, and Java functions.
Dash0's acquisition of Lumigo strengthens its position for AWS Lambda monitoring. Lumigo brings proven expertise in instrumenting Lambda functions, following requests through managed AWS services, and debugging event-driven architectures. Combined with Dash0's OpenTelemetry-native data model, the acquisition gives Dash0 deeper serverless experience.
What's good
-
Terminated invocations receive explicit treatment: Dash0 can generate a synthetic span when a timeout or out-of-memory event prevents the normal application trace from completing. This connects the platform-observed failure to the invocation rather than leaving only a truncated trace.
-
Telemetry remains in the OpenTelemetry model: The extension emits OpenTelemetry telemetry and follows semantic conventions. You can also use upstream OpenTelemetry Lambda layers or manually instrumented functions, which reduces instrumentation and transport lock-in.
-
AWS event-source context is attached to Lambda traces: The integration records information for supported SQS, SNS, EventBridge, Kinesis, and DynamoDB Streams invocations. This helps distinguish individual records and batches inside event-driven workflows.
-
The Lumigo acquisition adds specialized serverless expertise: Lumigo was built around tracing Lambda functions and managed AWS event chains. Bringing that engineering experience into Dash0 strengthens its case for applications built around queues, topics, streams, and short-lived functions.
The catch
Dash0's automatic Lambda instrumentation currently covers Python, Node.js, and Java. Teams running Go, .NET, Ruby, or custom runtimes must add OpenTelemetry instrumentation themselves, which makes the initial rollout less convenient than Dynatrace or New Relic for a mixed-language Lambda estate.
The Lambda integration also assumes that your team is comfortable working with OpenTelemetry concepts and configuration. That is an advantage when you already use OpenTelemetry across your applications, but it introduces a learning curve for teams looking for a fully vendor-managed setup with minimal decisions about instrumentation, resource attributes, propagation, or telemetry processing.
Dash0 has a smaller integration catalog and a shorter enterprise track record than Datadog, Dynatrace, and New Relic. Organizations that need extensive support for legacy infrastructure, specialized enterprise systems, or mature procurement and governance workflows should verify those requirements before standardizing on it.
Pricing model
Dash0 pricing is consumption-based, using published units for spans, metric data points, and log records. It does not add a separate per-seat, per-host, per-function, or base platform charge.
For Lambda, this means decomposing an application into more functions does not automatically create another billing unit. Increased invocation volume still generates more telemetry, so the cost grows with the number of signals you retain rather than with the number of function definitions.
Adding useful OpenTelemetry attributes does not create a separate custom metric or cardinality charge. The model therefore does not directly penalize richer context on an existing span or log record, although producing additional signals still increases usage.
Dash0 provides spam filters that can reject unwanted telemetry before storage and billing, alongside usage views that help you estimate how traffic changes affect consumption.
The verdict
Dash0 fits teams that want Lambda telemetry to remain consistent with an OpenTelemetry-instrumented estate, particularly when debugging requires traces, logs, and metrics from both serverless and non-serverless services. The Lumigo acquisition makes that case more credible by adding specialized experience in AWS Lambda and event-driven systems.
It is not the automatic choice for unsupported runtimes or container-image functions. Teams using Go, .NET, Ruby, or custom runtimes should compare the manual instrumentation effort against platforms with broader automatic runtime support.
Sign up for a free Dash0 trial to evaluate the Lambda integration with a representative workload.
3. Datadog
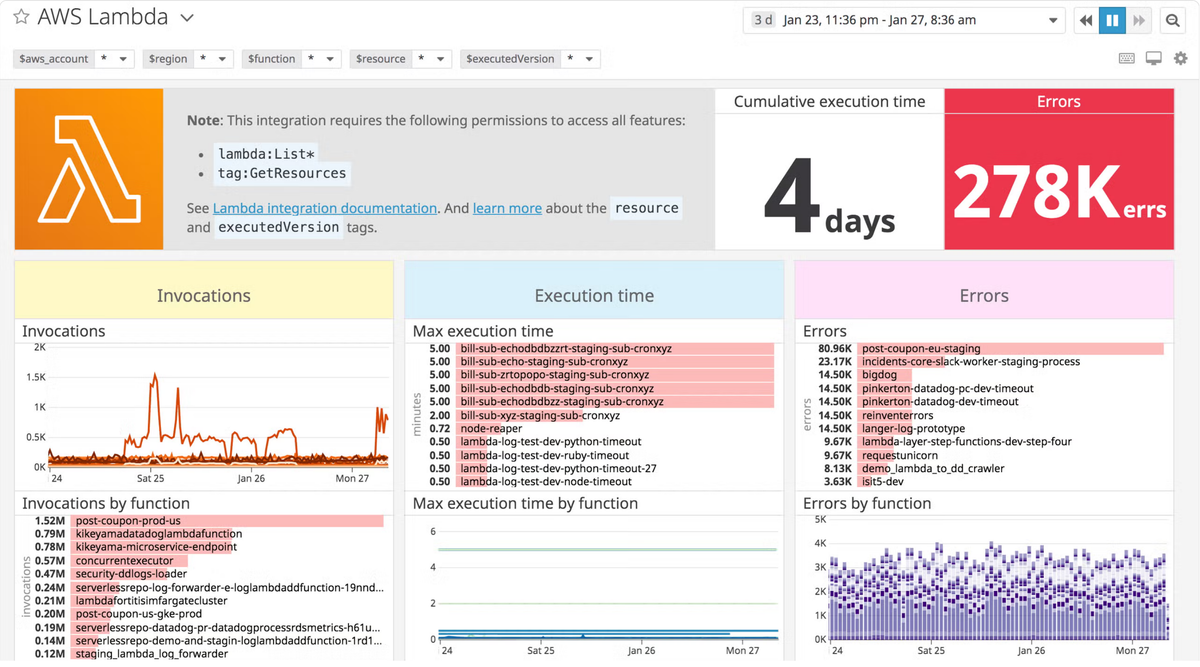
Datadog Serverless Monitoring combines the Datadog AWS integration with a runtime-specific Lambda library and the Datadog Lambda Extension. It collects AWS metrics, enhanced runtime metrics, logs, traces, and application telemetry into the wider Datadog platform.
The product is a natural extension for organizations that already use Datadog for infrastructure, application performance monitoring, logs, security, or incident response. Lambda functions can appear beside containerized and hosted services rather than becoming a separate monitoring island.
What's good
-
Enhanced Lambda metrics expose runtime-specific conditions: Datadog adds measurements for cold starts, estimated AWS cost, memory use, timeouts, out-of-memory failures, and post-runtime duration. These provide more function-level detail than the standard Lambda metrics alone.
-
Lambda telemetry joins the wider Datadog platform: Functions can be investigated alongside containers, hosts, databases, browser sessions, security findings, and incident workflows. This is particularly valuable for teams already using Datadog across the rest of their stack.
-
Datadog supports several deployment workflows: Teams can instrument functions through infrastructure-as-code integrations and Datadog tooling instead of editing every function manually in the AWS console.
-
The product has broad AWS event integration coverage: Datadog documents tracing and enhanced telemetry for common Lambda triggers and managed AWS services, making it suitable for applications that mix synchronous and asynchronous execution paths.
The catch
Datadog's full Lambda experience depends on several Datadog-specific components, including runtime libraries, the Lambda Extension, enhanced metrics, Datadog tags, and product-specific configuration. Sending OpenTelemetry data to Datadog does not reproduce all of these serverless features.
The installation modifies each monitored function by adding layers, handlers, environment variables, permissions, and an API key or secret reference. Teams must keep those components aligned with runtime upgrades and deployment templates across every account and region.
Serverless monitoring is also split across multiple Datadog products. Lambda metrics, APM traces, logs, custom metrics, profiling, and security data can each follow different retention and billing rules, making it difficult to understand the complete monitoring footprint from the serverless product alone.
Datadog's function-based billing creates a direct cost consequence for highly decomposed architectures. Splitting one workflow into more Lambda functions can increase the bill even when the end-user request volume remains unchanged.
Pricing model
Datadog's serverless billing documentation describes billing based on a combination of active Lambda functions and invocations. Logs, APM, custom metrics, profiling, security, and other capabilities can add separate product charges.
The per-function dimension interacts directly with serverless architecture. Splitting one service into several narrowly scoped functions may improve deployment isolation, but it also increases the number of billable functions. Invocation charges then rise with traffic.
Datadog's modular product structure allows teams to enable only the products they need, but it makes the full bill harder to derive from the serverless price alone. A realistic estimate must include function count, invocations, logs, indexed traces, custom metrics, retention, and any additional Datadog products used during investigations.
The verdict
Pick Datadog when your organization already operates the platform and wants Lambda telemetry inside an established cross-environment investigation workflow. Its serverless depth is more compelling as part of a wider Datadog deployment than as an isolated Lambda purchase.
A small AWS-only team should compare its operational and commercial complexity against CloudWatch or a more focused product. Teams prioritizing portable OpenTelemetry instrumentation should also identify which Datadog-specific workflows would need to be rebuilt during a migration.
4. Dynatrace
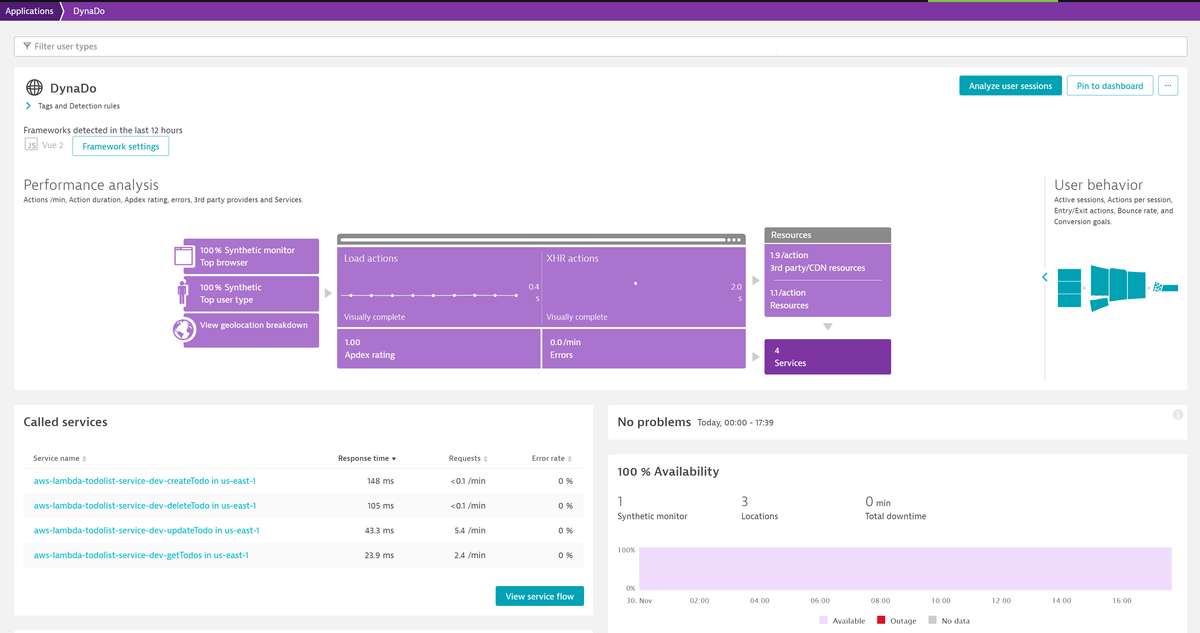
Dynatrace AWS Lambda monitoring combines AWS service metrics with a Lambda monitoring layer and the wider Dynatrace platform. Its documentation covers monitoring for Python, Node.js, Java, Go, and .NET functions.
Dynatrace can trace supported paths through services such as API Gateway, SQS, SNS, and EventBridge. It is particularly relevant to large organizations that already use Dynatrace across cloud, application, and infrastructure environments.
What's good
-
Automatic runtime coverage is comparatively broad: Dynatrace supports Python, Node.js, Java, Go, and .NET Lambda functions. This makes it a strong candidate for organizations using several runtimes that want a more consistent instrumentation path.
-
Lambda functions join Dynatrace's topology model: The platform connects serverless functions with supported applications, services, databases, infrastructure, and AWS dependencies. Existing customers can keep Lambda investigations inside the same entity and problem model.
-
Dynatrace combines AWS metrics with code-level telemetry: CloudWatch metrics can be viewed alongside traces, logs, service relationships, and automated problem analysis rather than remaining a separate AWS-only signal.
-
Several instrumentation paths are available: Dynatrace supports its own Lambda monitoring integration as well as OpenTelemetry-based approaches, giving teams more flexibility when proprietary instrumentation is not suitable for every function.
The catch
Dynatrace has multiple AWS ingestion and instrumentation paths, each with its own prerequisites. Some metric collection configurations require an Environment ActiveGate, while deeper Lambda visibility requires runtime instrumentation. This creates more architecture and administration than a single account-level integration suggests.
The feature experience also varies by runtime and monitoring path. A function instrumented through the Dynatrace layer may expose different detail from one sending only CloudWatch metrics or OpenTelemetry data, so a mixed deployment can produce uneven investigations.
Dynatrace's topology relationships, Davis analysis, management zones, dashboards, queries, and alerting rules are platform-specific. OpenTelemetry can preserve the source instrumentation, but it does not make these operational workflows portable.
The platform is designed for organization-wide observability rather than a narrow Lambda purchase. Teams adopting it only for serverless monitoring still inherit Dynatrace's broader setup, governance, and consumption model.
Pricing model
Dynatrace uses consumption-based platform pricing with capabilities measured through platform-specific consumption units. AWS metrics, logs, traces, and other analytics consume different resources, while AWS may charge separately for CloudWatch metric queries or telemetry delivery.
This structure is better evaluated as a complete observability contract than as a Lambda add-on. The cost depends on which data paths you enable, how much telemetry they produce, and which Dynatrace capabilities process or retain the data.
Forecasting usually requires a representative proof of concept and access to the applicable contract rates. Teams should include both Dynatrace consumption and any AWS services used to collect or transport the telemetry.
The verdict
Pick Dynatrace when Lambda is part of a large enterprise environment already standardized on the platform, or when broad runtime coverage and topology-driven analysis justify the investment.
It is difficult to justify solely for a modest Lambda footprint. Smaller teams should determine whether they need the complete enterprise platform or a simpler AWS-native or OpenTelemetry-focused tool.
5. New Relic
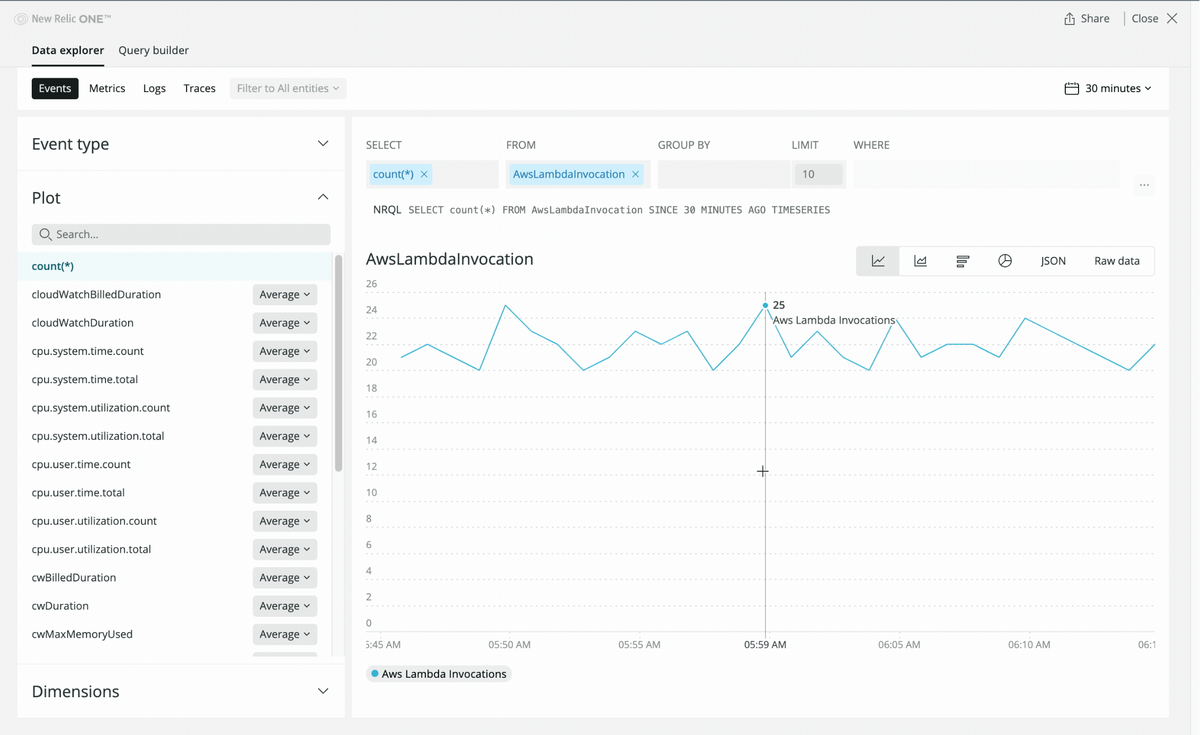
New Relic Lambda monitoring uses an AWS account integration together with a Lambda layer, language agent, extension, or software development kit. Supported examples cover Node.js, Python, Go, Java, Ruby, and .NET.
The platform combines Lambda entities, AWS metrics, logs, errors, traces, and New Relic Query Language analysis. It is most compelling when a team already uses New Relic for application performance monitoring and wants serverless functions in the same application model.
What's good
-
New Relic supports six common Lambda runtimes: Its documentation covers Node.js, Python, Go, Java, Ruby, and .NET. This gives mixed-language teams a broader automatic or agent-assisted path than products focused on fewer runtimes.
-
Instrumentation fits common deployment systems: New Relic supports deployment through Terraform, CloudFormation, the AWS Cloud Development Kit, Serverless Framework, and AWS Serverless Application Model. Teams can keep monitoring configuration close to the function definition.
-
The Lambda Extension can send telemetry directly to New Relic: This avoids depending entirely on a CloudWatch Logs subscription and can reduce the delay between an invocation and its appearance in New Relic.
-
NRQL provides one analysis language across New Relic data: Existing customers can query Lambda events, traces, logs, and related entities through the same language they already use for APM and infrastructure monitoring.
The catch
New Relic's Lambda setup combines an AWS account integration with runtime-specific agents or layers, the Lambda Extension or log-ingestion function, secrets, and IAM permissions. The exact path differs by language and deployment method, increasing the number of configurations a mixed-runtime team must maintain.
Automatic trace propagation is not uniform across every asynchronous AWS path. New Relic documents manual propagation steps for some SQS and SNS workflows, so application changes may be needed to preserve context through particular event chains.
The direct extension and CloudWatch-based delivery paths behave differently. Using CloudWatch as a fallback introduces an additional ingestion function and AWS logging charges, while the direct path depends more heavily on the New Relic extension and its delivery behavior.
New Relic's Lambda experience is tied to NRQL, New Relic entities, agent attributes, dashboards, and alerts. OpenTelemetry ingestion can reduce instrumentation lock-in, but it does not preserve those investigation workflows on another backend.
Pricing model
New Relic's current Lambda documentation states that APM and serverless convergence is billed as an APM entity according to the customer's order. Its broader pricing can combine data ingestion, user access, retention, and contract-specific product usage.
This makes the public list price an incomplete predictor for many customers. Lambda monitoring may also generate AWS charges for metric streams, CloudWatch, a log-ingestion function, or related delivery services.
Per-user charges can discourage broad access when every engineer should be able to investigate production. Data-ingestion charges can encourage aggressive filtering, particularly for verbose Lambda logs. Obtain a quote based on your expected data volume, users, retention, and AWS delivery path.
The verdict
New Relic is a practical choice when your team already relies on New Relic APM, NRQL, dashboards, and incident workflows. Broad language support also makes it worth evaluating for mixed-runtime Lambda estates.
For a new AWS-only project, compare the setup and contract complexity against CloudWatch and newer OpenTelemetry-native platforms. The value is strongest when Lambda monitoring extends an existing New Relic deployment.
6. Sentry
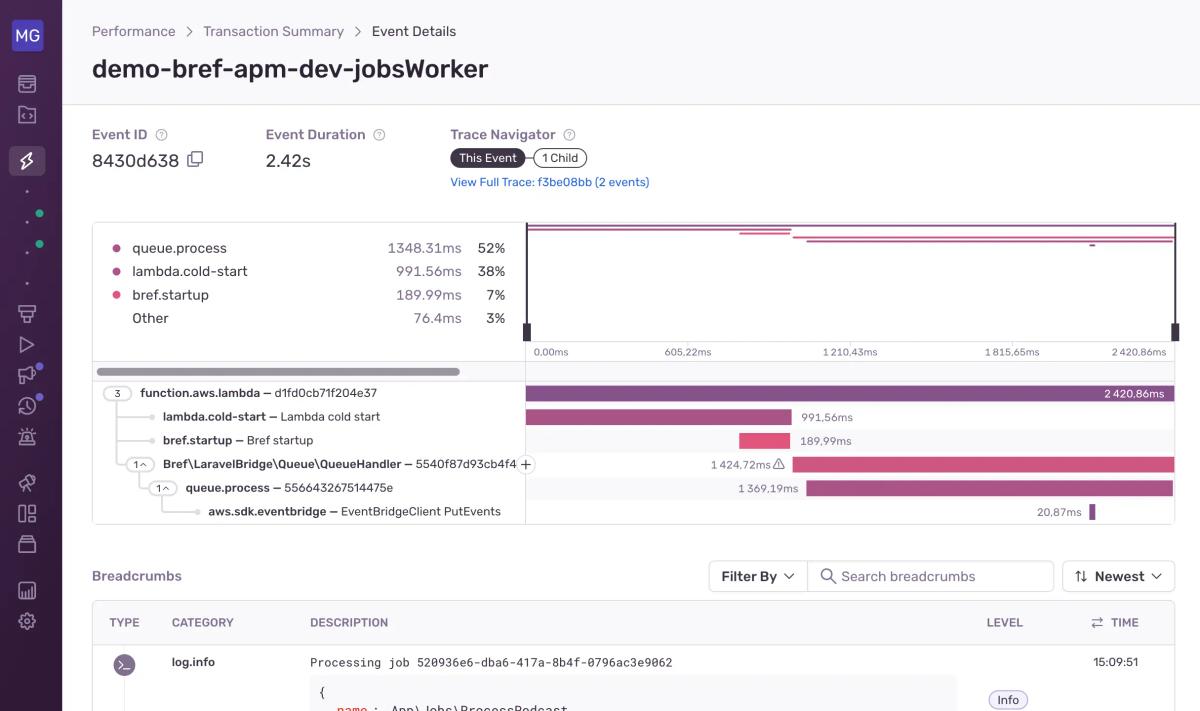
Sentry's AWS Lambda integration can connect an AWS account and add error and performance monitoring to supported Node.js and Python functions. You can also instrument applications through the relevant Sentry SDK.
Sentry approaches Lambda primarily from the developer's perspective. It focuses on exceptions, stack traces, releases, application transactions, and code-level context rather than attempting to replace the complete AWS infrastructure monitoring stack.
What's good
-
Sentry centers the workflow on application failures: It groups related exceptions into issues and connects them with stack traces, releases, ownership rules, and source context. This is often more useful to application developers than beginning with a Lambda log group.
-
Its Lambda setup is straightforward for Node.js and Python: Sentry can instrument supported functions through its AWS integration or language SDKs, making it accessible to teams already using Sentry elsewhere in the application.
-
Errors can be connected to application transactions: Performance data provides context around slow or failed code paths instead of limiting the investigation to an exception message.
-
Release tracking helps identify regressions: Lambda failures can be associated with deployed versions and commits, helping teams determine whether an issue appeared after a particular application change.
The catch
Sentry is primarily an application error and performance product, not a complete Lambda operations platform. It does not replace CloudWatch for concurrency, throttling, account-level service health, quotas, or the complete set of native Lambda metrics.
The automatic AWS integration focuses on Node.js and Python. Other Lambda runtimes require SDK-specific instrumentation and may not receive the same account-level setup or feature depth.
Sentry's transaction model is strongest inside code instrumented with its SDK. It provides less visibility into uninstrumented AWS services and event chains than platforms designed around account discovery and serverless topology.
A complete Lambda deployment will usually retain CloudWatch and may also need a broader tracing or infrastructure platform. Sentry can therefore improve error triage while adding another interface and billing model rather than replacing the existing monitoring stack.
Pricing model
Sentry pricing divides plan capacity across categories such as errors, spans, logs, and team features. Included units and overage behavior depend on the selected plan.
Lambda invocation volume does not map neatly to one Sentry event. A successful invocation may produce performance spans, while one failing invocation may create an error event, trace data, and logs. Sampling and filtering therefore affect both debugging depth and cost.
The model can be economical when the primary goal is application error tracking. It becomes harder to compare with complete observability platforms when you still pay AWS or another vendor for infrastructure metrics, logs, and end-to-end traces.
The verdict
Pick Sentry when code-level exceptions, releases, ownership, and developer triage are the main problems you need to solve. It is especially useful when Sentry already covers the rest of the application.
Do not select it as the only Lambda monitoring tool when you need concurrency, throttling, AWS service health, complete asynchronous traces, resource optimization, or unified metrics and logs. Pair it with CloudWatch or a broader observability platform.
Which tool fits your situation
There is no universal winner because the right tool depends on the environment around your functions and the investigation workflow you want to build.
If you have a small AWS-only deployment, begin with CloudWatch, Application Signals, and X-Ray. You already receive the basic Lambda metrics, and the native stack may be sufficient until manual signal correlation becomes a recurring operational cost.
If you want an OpenTelemetry-native managed platform, evaluate Dash0. Instrumentation and telemetry remain close to the OpenTelemetry model, while synthetic spans address Lambda terminations that ordinary application traces often miss. The Lumigo acquisition also strengthens Dash0's serverless and event-driven expertise.
If Datadog already covers your infrastructure and applications, use its serverless monitoring rather than creating a separate Lambda observability island. Its enhanced metrics and wider platform integrations justify more of the setup when Datadog is already established.
If you operate a large enterprise estate, Dynatrace offers broad runtime coverage and connects Lambda with an extensive topology and operations model. That breadth brings more setup and commercial complexity than a small team usually needs.
If your organization already uses New Relic APM, its Lambda layers and extension provide the most direct route into existing NRQL, entity, dashboard, and alerting workflows. Verify asynchronous propagation and contract pricing with your actual application.
If application exceptions are the main concern, use Sentry alongside CloudWatch. It provides a developer-centered error workflow, but it should not be mistaken for complete Lambda infrastructure and distributed systems observability.
Final thoughts
AWS-native monitoring, broad observability platforms, and developer-focused error tools solve different parts of the Lambda monitoring problem. CloudWatch provides the operational baseline. Datadog, Dynatrace, and New Relic connect Lambda to established enterprise platforms. Sentry focuses on application errors and developer workflows.
The important distinction is not how many Lambda charts each product offers. It is whether the tool can preserve context through asynchronous AWS services, explain invocations that terminate before exporting telemetry, support your runtime mix, and produce a bill you can forecast as traffic and function count increase.
Dash0 fits teams that want those Lambda investigations inside an OpenTelemetry-native platform without separate charges for functions, hosts, or users. Its runtime and packaging limitations remain important, but the acquisition of Lumigo adds deeper AWS serverless experience to its existing OpenTelemetry foundation.
Sign up for a free Dash0 trial with 14 days of unlimited access.
Frequently asked questions
Is CloudWatch enough for AWS Lambda monitoring?
CloudWatch is often enough for basic metrics, logs, alarms, and small AWS-only applications. It becomes less effective when you need end-to-end asynchronous traces, rapid correlation across signals, detailed application context, or one investigation model spanning serverless and non-serverless services.
How do AWS Lambda monitoring tools affect cold starts?
Layers, agents, wrappers, and extensions perform initialization work and consume memory inside the Lambda execution environment. The impact depends on the runtime, architecture, memory allocation, package size, enabled instrumentation, and telemetry export settings.
Benchmark an instrumented and uninstrumented version of each representative function rather than relying on a single vendor benchmark.
How can you monitor Lambda timeouts and out-of-memory failures?
Use platform metrics and runtime logs to detect that the termination occurred. For deeper analysis, choose a tool that can correlate the platform-observed failure with the invocation or reconstruct a synthetic trace when the application process is killed before exporting its active span.
Should you use OpenTelemetry with AWS Lambda?
OpenTelemetry is useful when you want consistent instrumentation across Lambda, containers, Kubernetes, and conventional services. It improves instrumentation and transport portability, but it does not make dashboards, queries, alerts, retention policies, or investigation workflows automatically portable.

