How It Works
Open any log record in the sidebar and switch to the Related Logs tab. Dash0 automatically queries a ±30-minute window centered on the active log and displays the results in a scrollable timeline:
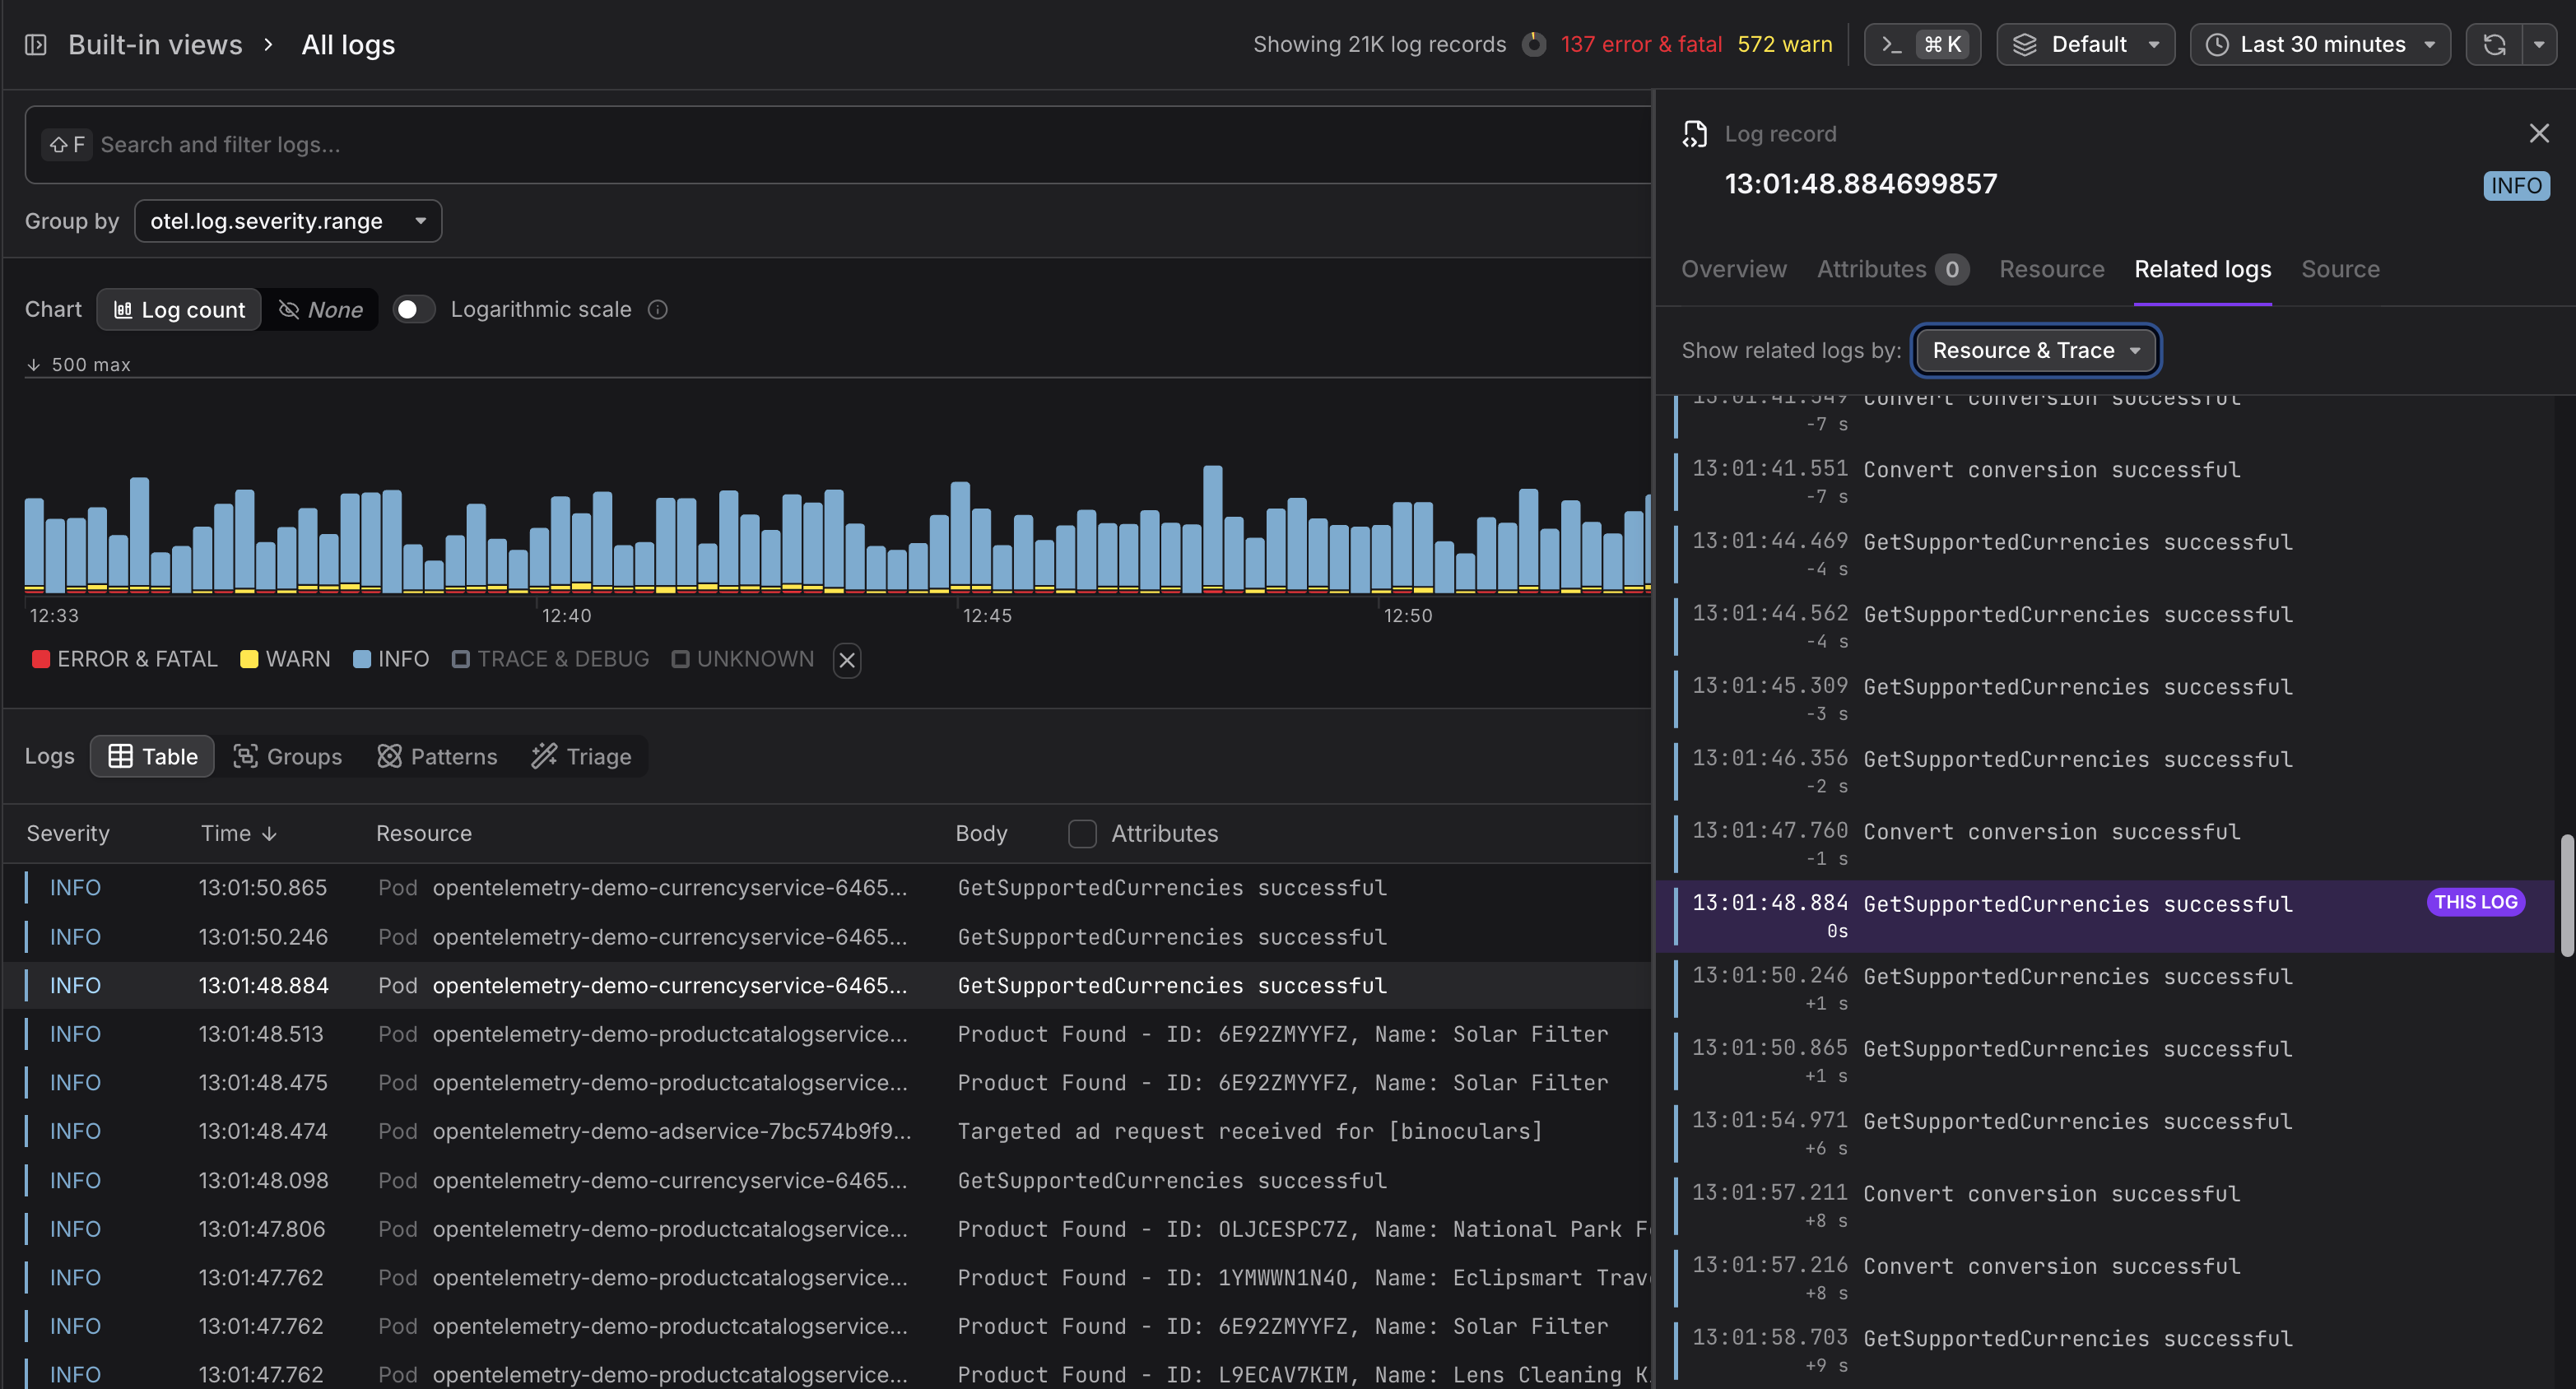
The active log is pinned in the center, clearly marked with a THIS LOG badge and a highlighted background. Older logs appear above, newer logs below, each annotated with a relative time offset (e.g. -2m 15s, +50s) so you can instantly gauge how far apart events are. Infinite scroll loads additional records in both directions as you explore, without ever leaving the panel.
Two Ways to Correlate
Related Logs supports two independent correlation modes that can be combined:
- Resource correlation finds all logs emitted by the same service or infrastructure component, giving you a local timeline of everything that resource was doing.
- Trace correlation finds all logs sharing the same trace ID, letting you follow a single request across service boundaries.
When both are available, toggle each mode on or off with a checkbox to narrow or widen the view. Correlation badges on each log entry make it clear why a record was included.