Zerolog: The Ultra-Fast, Zero-Allocation JSON Logger for Go with OpenTelemetry Integration
In today's high-performance Go applications, logging solutions that minimize overhead while maximizing utility are essential. Among the top contenders in the Go logging ecosystem, Zerolog continues to stand out in 2025 as a premier choice for developers seeking both speed and developer experience. With the rise of OpenTelemetry as the industry standard for observability, Zerolog's integration capabilities make it even more valuable. This introduction explores what makes Zerolog exceptional and how it works with OpenTelemetry for comprehensive observability.
What is Zerolog?
Zerolog is a lightweight, zero-allocation JSON logging library designed specifically for Go. Created by Olivier Poitrey, Zerolog was built from the ground up with performance as its primary goal, while still providing an elegant, chainable API that makes logging a joy rather than a chore.
The library's name reflects its core philosophy: "zero" allocations when logging, resulting in minimal impact on your application's performance. Since its introduction, Zerolog has maintained this commitment to performance while expanding its feature set to meet modern logging requirements.
Key Features That Set Zerolog Apart
1. JSON-First Architecture
Unlike many logging libraries that treat structured logging as an afterthought, Zerolog embraces a JSON-first approach. This design decision makes it particularly well-suited for cloud-native applications where log aggregation and analysis tools expect structured data formats.
2. Zero-Allocation Design
Zerolog's most distinctive feature is its ability to log with zero heap allocations in common use cases. This design significantly reduces garbage collection pressure, resulting in more predictable performance—especially important in latency-sensitive applications.
3. Intuitive, Chainable API
The library provides a fluent, chainable API that improves code readability while maintaining performance:
12345logger.Info().Str("service", "api").Int("status", 200).Dur("latency", duration).Msg("request processed")
This approach makes code more readable while ensuring type safety for logged fields.
4. Context-Aware Logging
Zerolog excels at adding context to logs, making it easier to trace requests through complex systems:
12456logger := zerolog.New(os.Stdout).With().Timestamp().Logger()ctx := logger.WithContext(context)// Later in the codelog := zerolog.Ctx(ctx)log.Info().Msg("Using context logger")
5. Conditional Logging
To further optimize performance, Zerolog provides elegant ways to perform conditional logging:
12345logger.Debug().Enabled() &&logger.Debug().Str("expensive_field", computeExpensiveValue()).Msg("debug message")
Zerolog with OpenTelemetry: Unified Observability
In 2025's observability landscape, OpenTelemetry has become the industry standard for collecting telemetry data across distributed systems. Integrating Zerolog with OpenTelemetry provides a comprehensive observability solution that combines high-performance logging with distributed tracing and metrics.
Seamless Trace Context Propagation
One of the most powerful features when combining Zerolog with OpenTelemetry is the ability to correlate logs with traces:
1234567891011121314161718192021222324// Extract trace information from OpenTelemetry contextfunc loggerWithTraceInfo(ctx context.Context, logger zerolog.Logger) zerolog.Logger {span := trace.SpanFromContext(ctx)if span.SpanContext().IsValid() {traceID := span.SpanContext().TraceID().String()spanID := span.SpanContext().SpanID().String()return logger.With().Str("trace_id", traceID).Str("span_id", spanID).Logger()}return logger}// Usagefunc handleRequest(ctx context.Context) {// Get contextual logger with trace infolog := loggerWithTraceInfo(ctx, zerolog.Ctx(ctx).Logger())log.Info().Msg("Processing request")// The log will include trace_id and span_id automatically}
Creating an OpenTelemetry Log Exporter
Zerolog can be configured to send logs to OpenTelemetry collectors using a custom writer:
1234578910111213141516171819202122import ("github.com/rs/zerolog""go.opentelemetry.io/otel/exporters/otlp/otlplogs""go.opentelemetry.io/otel/sdk/logs")func setupOpenTelemetryLogger() zerolog.Logger {// Configure OpenTelemetry log exporterexporter, _ := otlplogs.NewExporter(otlplogs.WithInsecure(),otlplogs.WithEndpoint("otel-collector:4317"))// Create log providerprovider := logs.NewProvider(logs.WithBatcher(exporter),)// Create a writer that sends logs to OpenTelemetryotelWriter := newOTelLogWriter(provider)// Configure zerolog to use the OpenTelemetry writerreturn zerolog.New(otelWriter).With().Timestamp().Logger()}
Unified Observability Dashboard
When properly integrated, Zerolog and OpenTelemetry provide a complete observability picture:
- Logs (Zerolog): Detailed application events with contextual information
- Traces (OpenTelemetry): Request flows across services with timing information
- Metrics (OpenTelemetry): Aggregated performance data and business metrics
This unified approach allows teams to quickly identify and diagnose issues by correlating information across all three telemetry types.
Performance Benefits While Maintaining Observability
Even with OpenTelemetry integration, Zerolog maintains its performance advantages:
- Sampling-based logging: Log only a percentage of requests at DEBUG level
- Conditional logging: Avoid expensive computations for disabled log levels
- Batched exports: Buffer logs before sending to OpenTelemetry collectors
- Context propagation: Maintain request context across service boundaries
Getting Started with Zerolog and OpenTelemetry
Here's a complete example showing how to set up Zerolog with OpenTelemetry in a web service:
134567891011121315161718192021222324252627282930313233343536373839404142434446474849505152535455package mainimport ("context""net/http""os""github.com/rs/zerolog""github.com/rs/zerolog/log""go.opentelemetry.io/contrib/instrumentation/net/http/otelhttp""go.opentelemetry.io/otel""go.opentelemetry.io/otel/trace")func main() {// Initialize OpenTelemetryshutdown := initOpenTelemetry()defer shutdown()// Configure zerologzerolog.TimeFieldFormat = zerolog.TimeFormatUnixlogger := zerolog.New(os.Stdout).With().Timestamp().Logger()// HTTP handler with OpenTelemetry and Zerologhttp.Handle("/", otelhttp.NewHandler(http.HandlerFunc(func(w http.ResponseWriter, r *http.Request) {// Extract the context with trace informationctx := r.Context()// Get a logger with trace contextctxLogger := loggerWithTraceInfo(ctx, logger)ctxLogger.Info().Str("path", r.URL.Path).Str("method", r.Method).Msg("Request received")w.Write([]byte("Hello, World!"))}), "hello"))// Start serverlogger.Info().Msg("Server starting on :8080")http.ListenAndServe(":8080", nil)}func loggerWithTraceInfo(ctx context.Context, logger zerolog.Logger) zerolog.Logger {span := trace.SpanFromContext(ctx)if span.SpanContext().IsValid() {return logger.With().Str("trace_id", span.SpanContext().TraceID().String()).Str("span_id", span.SpanContext().SpanID().String()).Logger()}return logger}
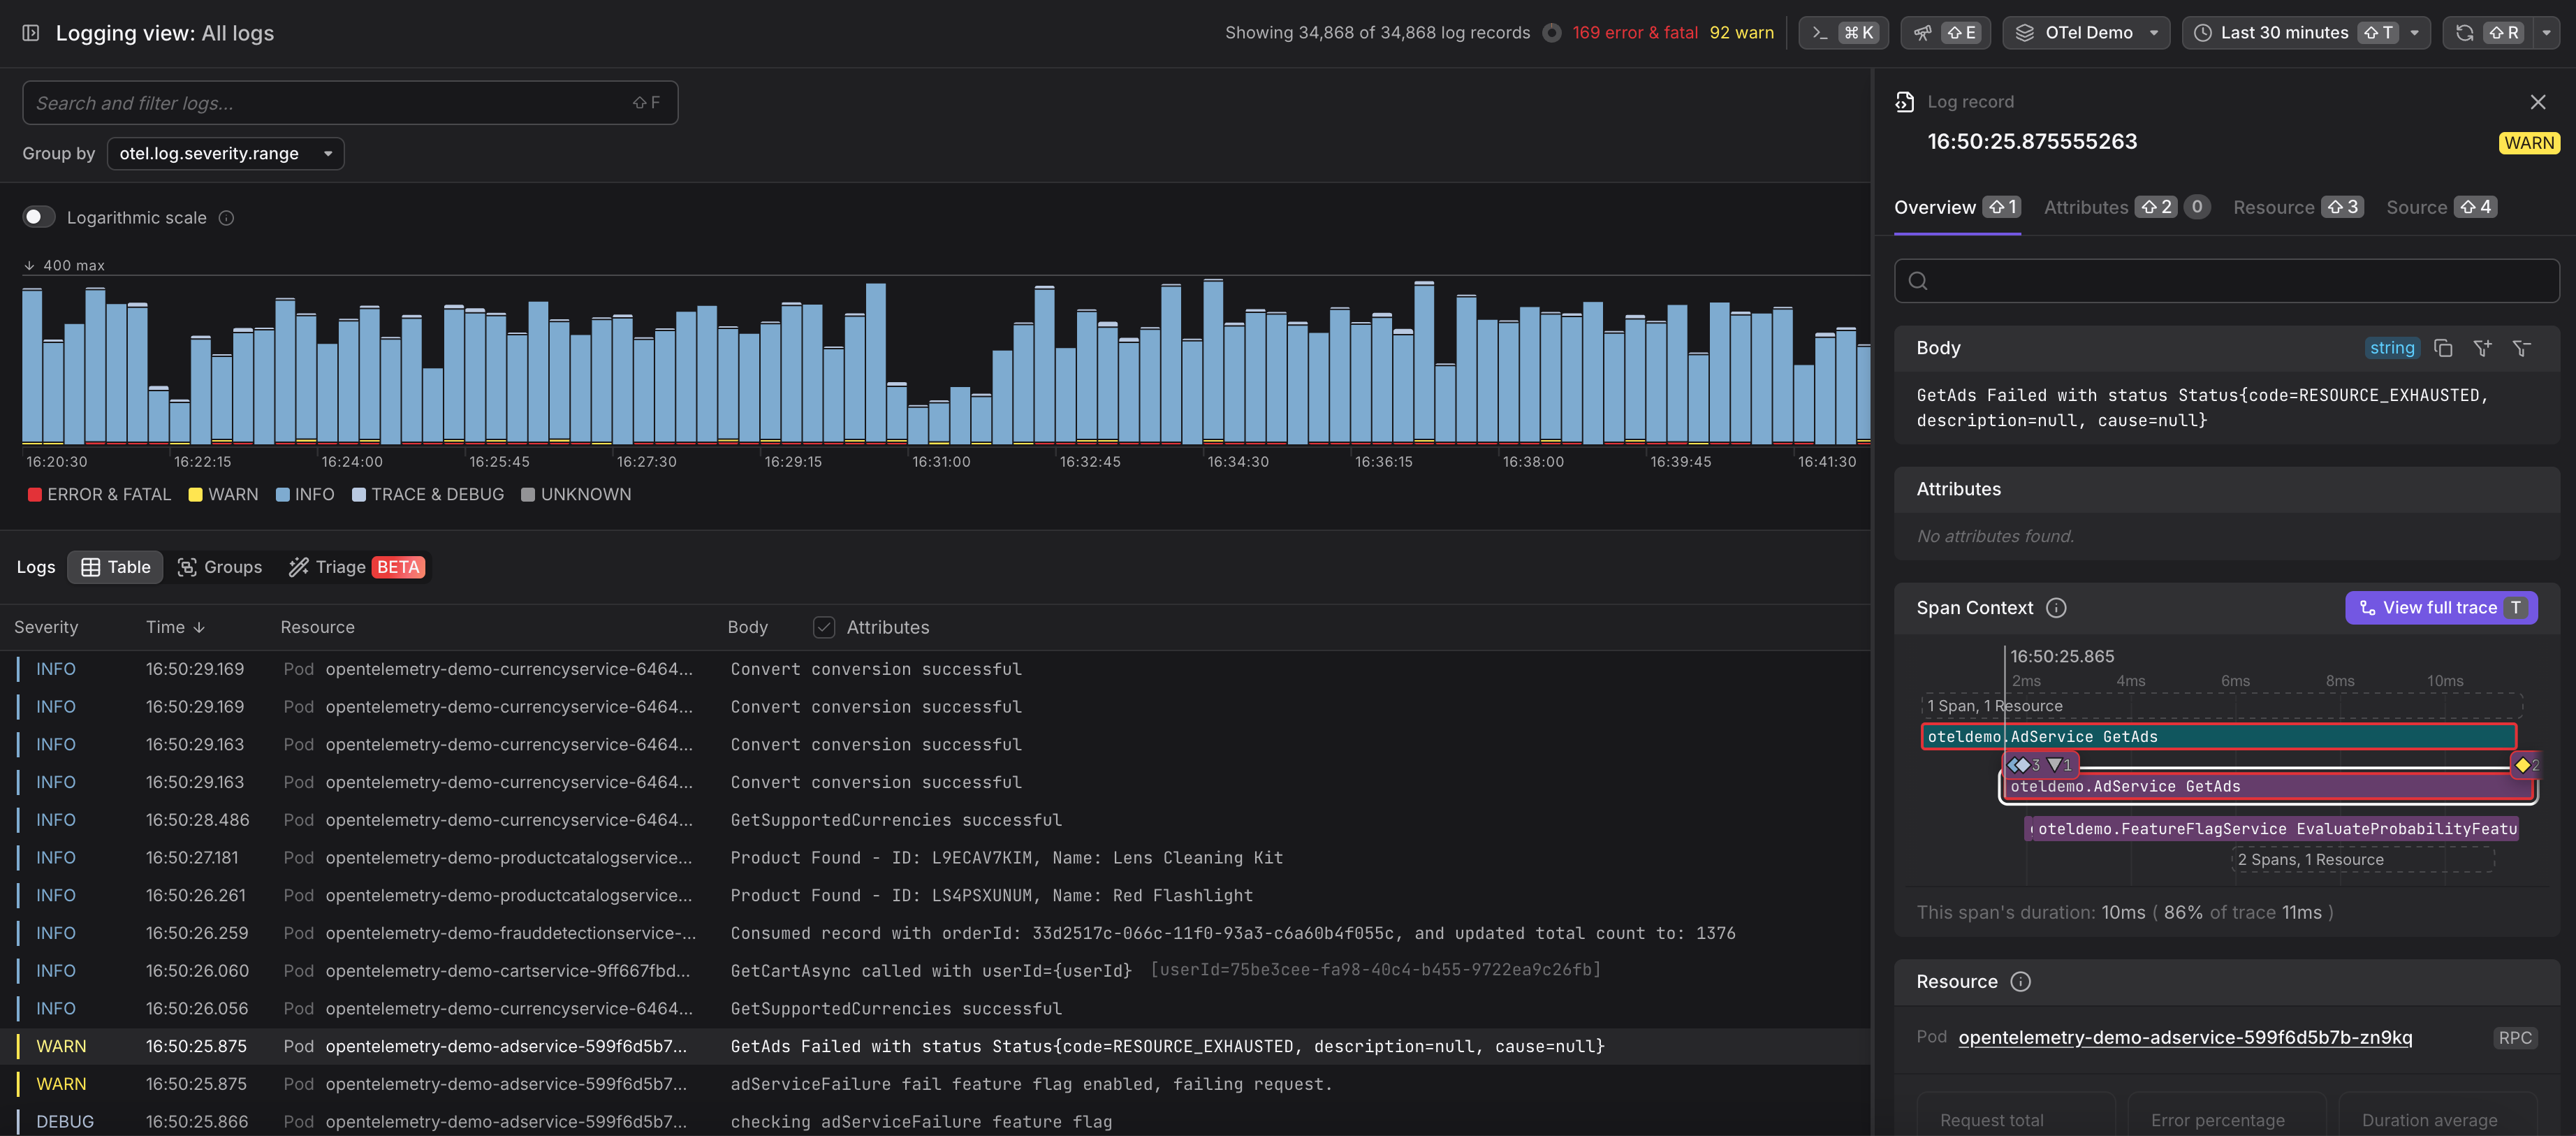
Analyzing OpenTelemetry Logs in Dash0
Logs can be directly routed into Dash0. Dash0 with OpenTelemetry provides the ability to filter, search, group, and triage within a simple user interface, with full keyboard support. Dash0 also gives full log context by showing trace context, the call and resource that created the log - including details like the Kubernetes Pod, server, and cloud environment.
Log AI also enhanced the logs with more semantical metadata and structure without any manual pattern declaration.
Conclusion: Zerolog + OpenTelemetry for Complete Observability in 2025
As Go applications continue to power critical infrastructure and services in 2025, the combination of Zerolog's efficiency with OpenTelemetry's comprehensive observability framework provides an ideal solution for modern development teams. With its zero-allocation performance, structured JSON output, developer-friendly API, and seamless OpenTelemetry integration, Zerolog remains a top choice for Go developers who refuse to compromise on either performance or observability.
Whether you're building microservices, APIs, or CLI tools, Zerolog with OpenTelemetry offers the right balance of features, performance, and observability capabilities to make debugging and monitoring both efficient and effective. As distributed systems become increasingly complex, having a logging solution that integrates smoothly with the broader observability ecosystem is not just convenient—it's essential for operational excellence.
Last updated: March 28, 2025