Logrus: The Feature-Rich, Structured Logging Framework for Go
In the Go ecosystem, Logrus has established itself as one of the most widely adopted logging frameworks, offering a perfect balance of simplicity, extensibility, and powerful features. Its structured logging approach and plugin-based architecture have made it a favorite among Go developers seeking a mature, full-featured logging solution.
Why Logrus Remains a Go Community Favorite
Logrus has earned its place as a leading Go logging framework through several key strengths:
- Structured Logging: Native support for JSON and other structured formats
- Field-Based Context: Add key-value pairs to provide rich context
- Extensive Hooks System: Easily extend functionality with pre-built and custom hooks
- Log Levels: Standard levels with customizable thresholds
- Formatters: Multiple built-in formats with customization options
- Thread Safety: Concurrent-safe for use in highly parallel applications
- Drop-in Replacement: API-compatible with the standard library logger
- Global Instance: Simplifies integration across packages
- Entry Reuse: Pool-based entry allocation for better performance
Getting Started with Logrus
Adding Logrus to your Go project is straightforward:
1go get github.com/sirupsen/logrus
Basic usage in a Go application:
134568910111213141516171819202122232425262728293031package mainimport ("github.com/sirupsen/logrus""os")func main() {// Configure loggerlog := logrus.New()log.SetOutput(os.Stdout)log.SetFormatter(&logrus.JSONFormatter{})log.SetLevel(logrus.InfoLevel)// Basic logginglog.Info("Server starting")// Structured fieldslog.WithFields(logrus.Fields{"service": "payment-api","environment": "production","version": "2.3.1",}).Info("Service initialized")// Different log levelslog.Debug("This won't be visible with InfoLevel")log.Warn("Resource utilization high", logrus.Fields{"cpu": 0.85})// Error logginglog.WithError(errors.New("database connection failed")).Error("Service disruption")}
Enhancing Logrus with OpenTelemetry for Complete Go Observability
While Logrus provides robust structured logging, modern distributed applications demand a more integrated approach to observability. By combining Logrus with an OpenTelemetry-native observability platform, you can transform isolated logs into components of a unified monitoring strategy.
This powerful integration enables:
- Trace Context Enrichment: Automatically add trace and span IDs to your log entries
- Log-Trace Correlation: Connect logs directly to distributed traces for context-rich debugging
- Cross-Service Visibility: Track requests across service boundaries with correlated logs
- Unified Monitoring: Manage logs, metrics, and traces through a single platform
- Performance Correlation: Link performance metrics directly to log events
Implementing Logrus with OpenTelemetry
Setting up the integration is straightforward using Logrus hooks:
134567891112141516171920212223242526272930313233343536373839404142434445464748495051525354package mainimport ("context""github.com/sirupsen/logrus""go.opentelemetry.io/otel""go.opentelemetry.io/otel/trace"sdktrace "go.opentelemetry.io/otel/sdk/trace")// OpenTelemetryHook adds trace context to Logrus entriestype OpenTelemetryHook struct{}// Levels defines which log levels the hook will be triggered forfunc (h *OpenTelemetryHook) Levels() []logrus.Level {return logrus.AllLevels}// Fire adds OpenTelemetry trace context to log entriesfunc (h *OpenTelemetryHook) Fire(entry *logrus.Entry) error {span := trace.SpanFromContext(context.Background())if span.SpanContext().IsValid() {entry.Data["trace_id"] = span.SpanContext().TraceID().String()entry.Data["span_id"] = span.SpanContext().SpanID().String()}return nil}func main() {// Initialize OpenTelemetrytp := sdktrace.NewTracerProvider()otel.SetTracerProvider(tp)tracer := tp.Tracer("example.com/logrus")// Configure Logruslog := logrus.New()log.SetFormatter(&logrus.JSONFormatter{})// Add OpenTelemetry hooklog.AddHook(&OpenTelemetryHook{})// Create a spanctx, span := tracer.Start(context.Background(), "operation")defer span.End()// Log with trace context automatically includedlog.Info("This log will contain trace context")// With additional fieldslog.WithFields(logrus.Fields{"service": "order-processor","user_id": "12345",}).Info("Processing order")}
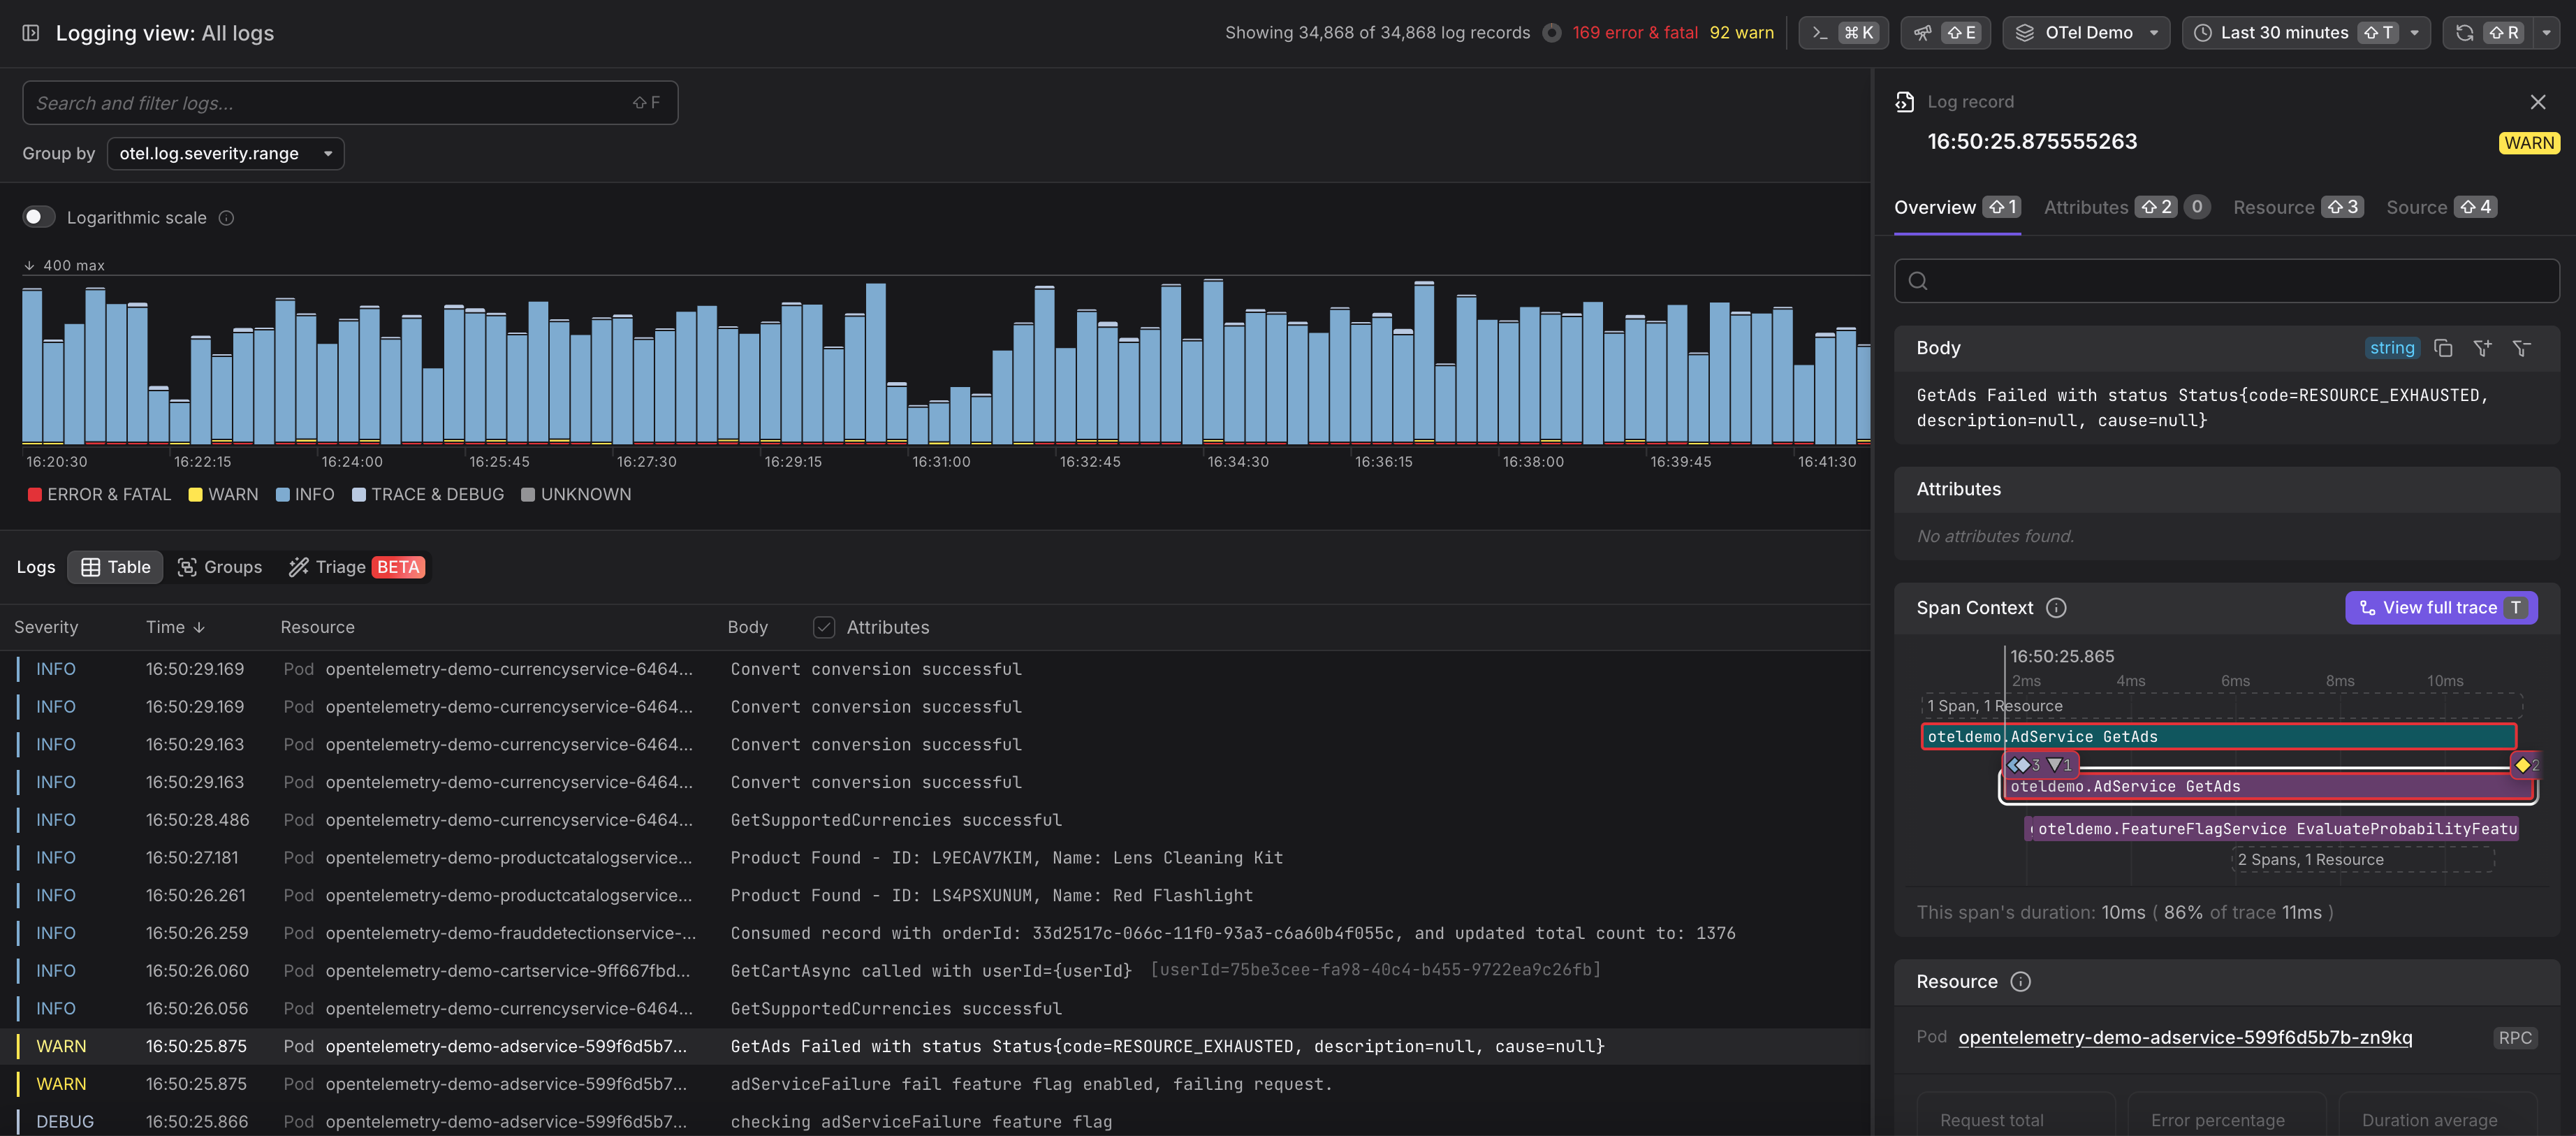
Analyzing OpenTelemetry Logs in Dash0
Logs can be directly routed into Dash0. Dash0 with OpenTelemetry provides the ability to filter, search, group, and triage within a simple user interface, with full keyboard support. Dash0 also gives full log context by showing trace context, the call and resource that created the log - including details like the Kubernetes Pod, server, and cloud environment.
Log AI also enhanced the logs with more semantical metadata and structure without any manual pattern declaration.
Conclusion
In 2025, Logrus continues to be one of the most popular logging frameworks for Go applications, offering a well-balanced combination of simplicity, structure, and extensibility. Its mature feature set and broad community adoption make it a reliable choice for projects of all sizes.
By enhancing Logrus with OpenTelemetry integration, developers can maintain its ease of use and structured logging capabilities while gaining the advantages of unified observability. This combination delivers powerful insights by connecting logs with traces and metrics, enabling faster problem resolution and better application understanding.
For Go applications that need both rich, structured logging and comprehensive observability, Logrus with OpenTelemetry integration provides an ideal solution that builds on familiar patterns while embracing modern observability practices.