Serilog: The Powerful Structured Logging Framework for .NET Applications
In today's complex software environments, effective logging is crucial for maintaining application health and troubleshooting issues. Serilog has emerged as one of the most popular logging frameworks in the .NET ecosystem, offering powerful structured logging capabilities that transform how developers capture and analyze application events.
What Makes Serilog Stand Out?
Serilog introduced a paradigm shift in .NET logging through its structured approach. Unlike traditional text-based logging, Serilog captures events as structured data with properties that can be queried and analyzed programmatically. This approach makes logs significantly more valuable for both developers and operations teams.
Key Features of Serilog
- Structured Logging: Record events with typed properties rather than just text messages
- Extensive Sink Support: Output logs to console, files, databases, cloud services, and more
- Templating Engine: Create rich, formatted log messages with minimal overhead
- Enrichers: Automatically add contextual information to every log event
- Minimal Configuration: Get started quickly with sensible defaults
Implementing Serilog in Your .NET Project
Setting up Serilog in your application requires just a few steps:
12456781011// Install packages: Serilog, Serilog.Sinks.Consoleusing Serilog;// Configure SerilogLog.Logger = new LoggerConfiguration().MinimumLevel.Information().WriteTo.Console().CreateLogger();// Log structured eventsLog.Information("User {UserId} logged in from {IpAddress}", userId, ipAddress);
Enhanced Observability with OpenTelemetry Integration
While Serilog provides excellent logging capabilities, modern application monitoring demands a comprehensive observability solution. This is where OpenTelemetry integration becomes invaluable.
By connecting Serilog with an OpenTelemetry-native observability platform, you can:
- Unify Monitoring Data: Correlate logs with metrics and traces for complete visibility
- Implement Distributed Tracing: Track requests across service boundaries
- Gain Real-time Insights: Analyze application behavior with advanced visualization tools
- Reduce Operational Complexity: Manage all observability data through a single platform
Connecting Serilog to OpenTelemetry
Integrating Serilog with OpenTelemetry is straightforward using the OpenTelemetry SDK and Serilog adapters:
12345678// Add OpenTelemetry integrationservices.AddOpenTelemetry().WithTracing(tracerProviderBuilder => tracerProviderBuilder.AddSource("YourApplication").AddOtlpExporter()).WithLogging(loggingBuilder => loggingBuilder.AddSerilog().AddOtlpExporter());
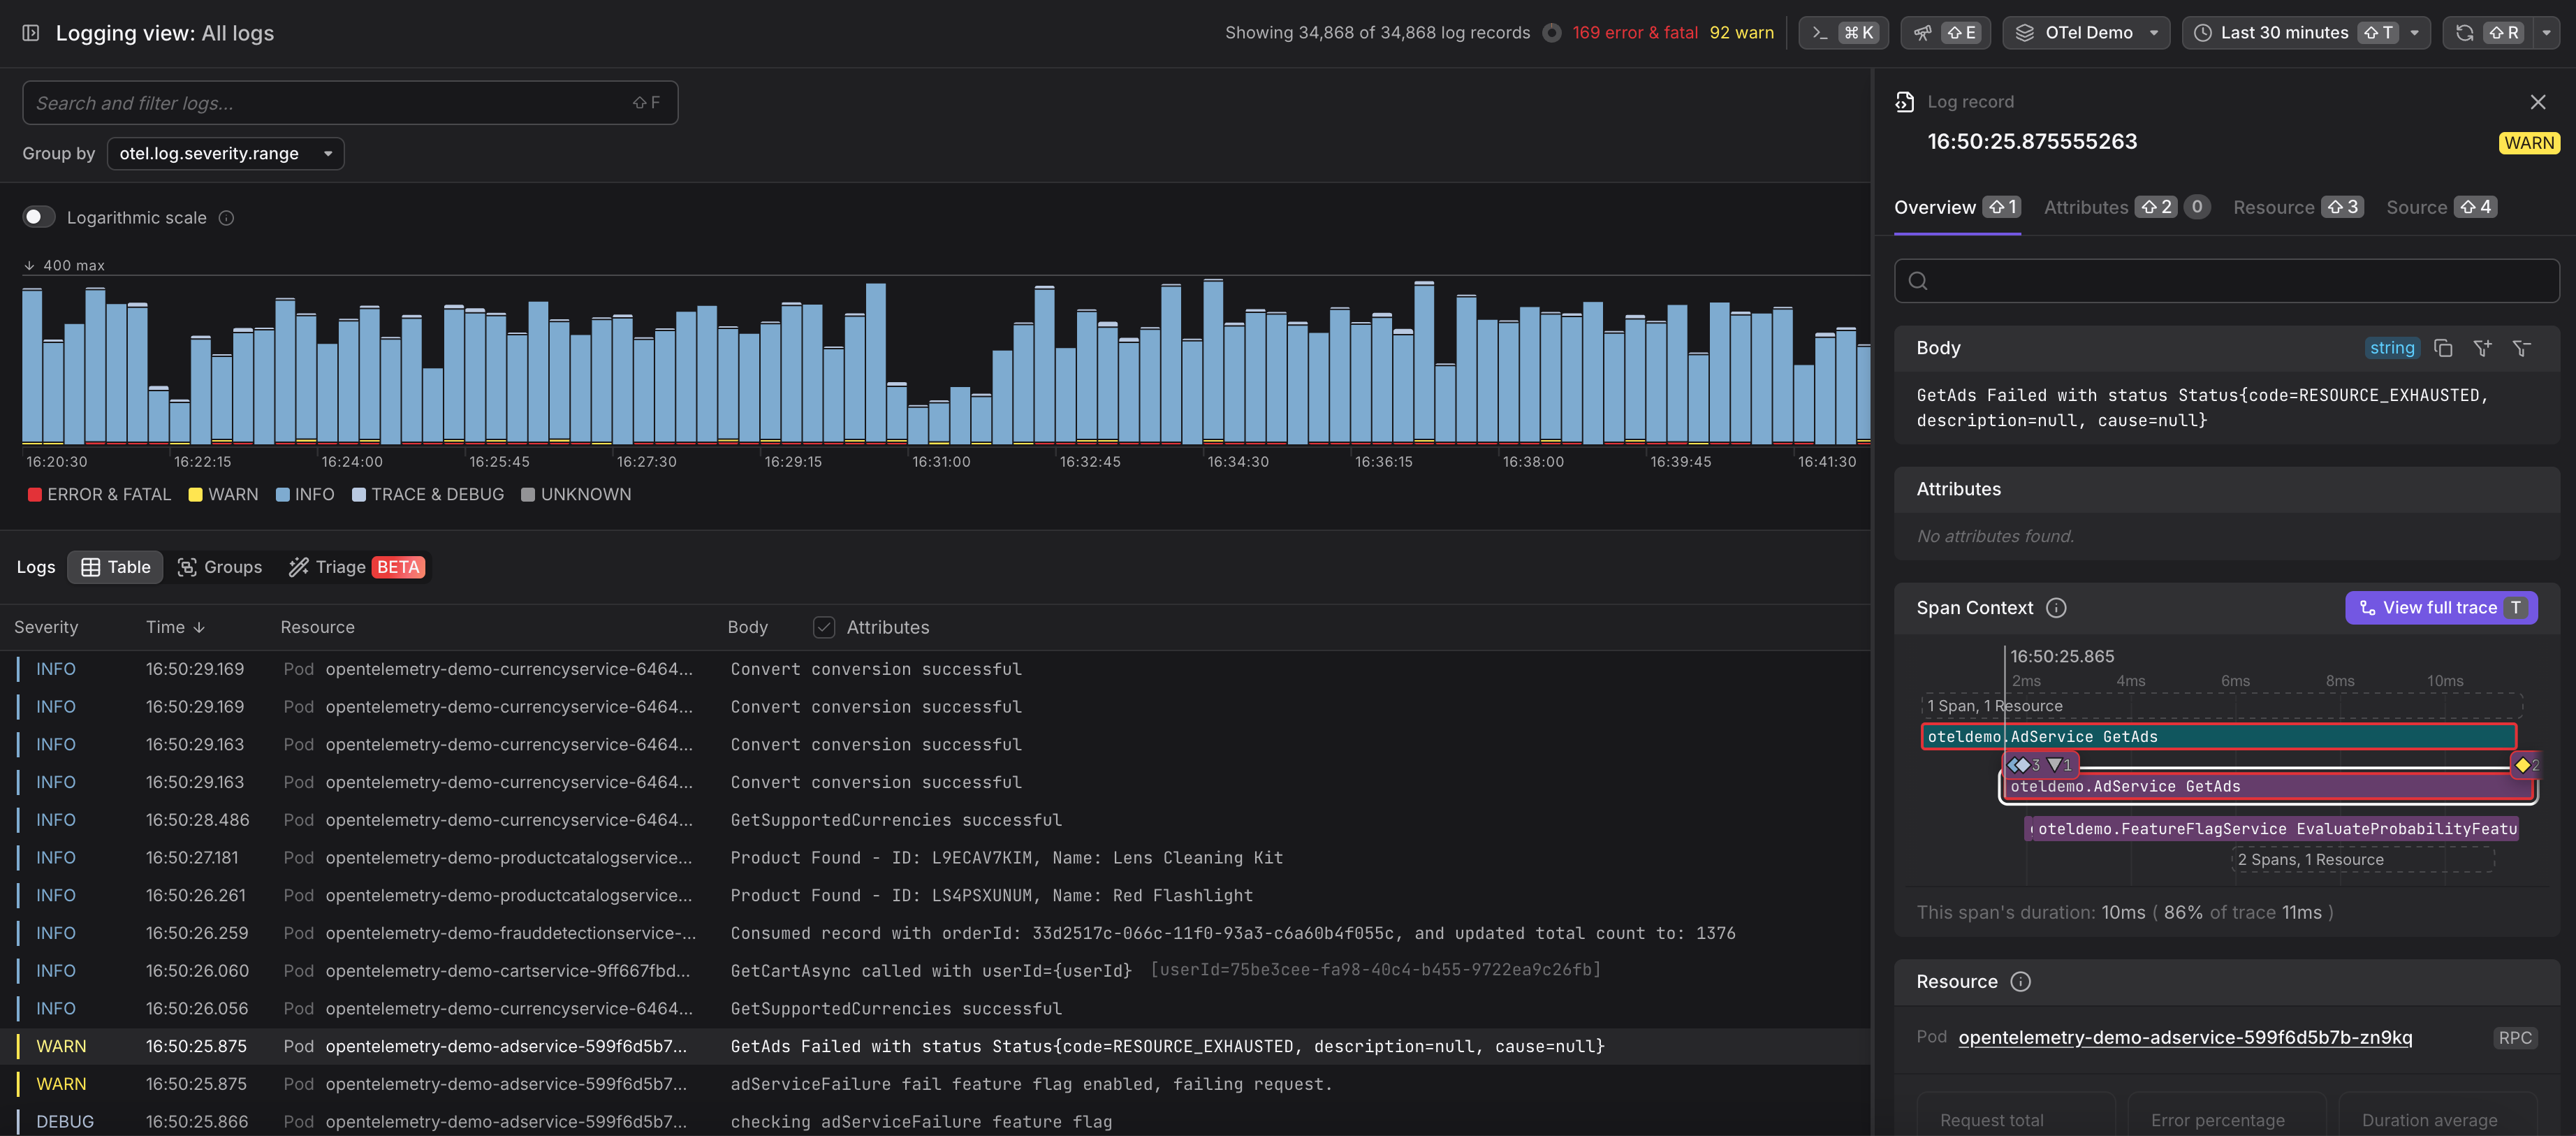
Analyzing OpenTelemetry Logs in Dash0
Logs can be directly routed into Dash0. Dash0 with OpenTelemetry provides the ability to filter, search, group, and triage within a simple user interface, with full keyboard support. Dash0 also gives full log context by showing trace context, the call and resource that created the log - including details like the Kubernetes Pod, server, and cloud environment.
Log AI also enhanced the logs with more semantical metadata and structure without any manual pattern declaration.
Conclusion
Serilog has revolutionized logging in the .NET ecosystem with its structured approach and flexible architecture. When combined with OpenTelemetry-native observability solutions, it creates a powerful foundation for monitoring and maintaining application health.
Whether you're building microservices, web applications, or desktop software, Serilog provides the tools you need to capture meaningful log data. By extending this capability with OpenTelemetry integration, you can transform raw logs into actionable insights that help ensure your applications run smoothly in production.
Start implementing Serilog with OpenTelemetry today to take your application observability to the next level.